


Go on studying SK-FX strategy. In this post, we will study the notion of price jumps, divergence, and convergence.
We will define price jumps, divergence, and convergence. I will describe the features and the properties of their signals, and how to apply them.
Dear friends!
Due to the increased interest in my educational article about SK-FX trading strategy, I decided to share the second part of it, to continue describing the strategy sooner.
I will start with the concept of “price jumps”.
Large market players’ activity and most participants’ high psychological sensitivity often results in the price jumps in the market, which cause the imbalance of supply and demand.
Predicting jumps and understanding their nature is important not only for short-term trading, but also for long-term targets, as exactly these strong moves drive the market and provide signals.
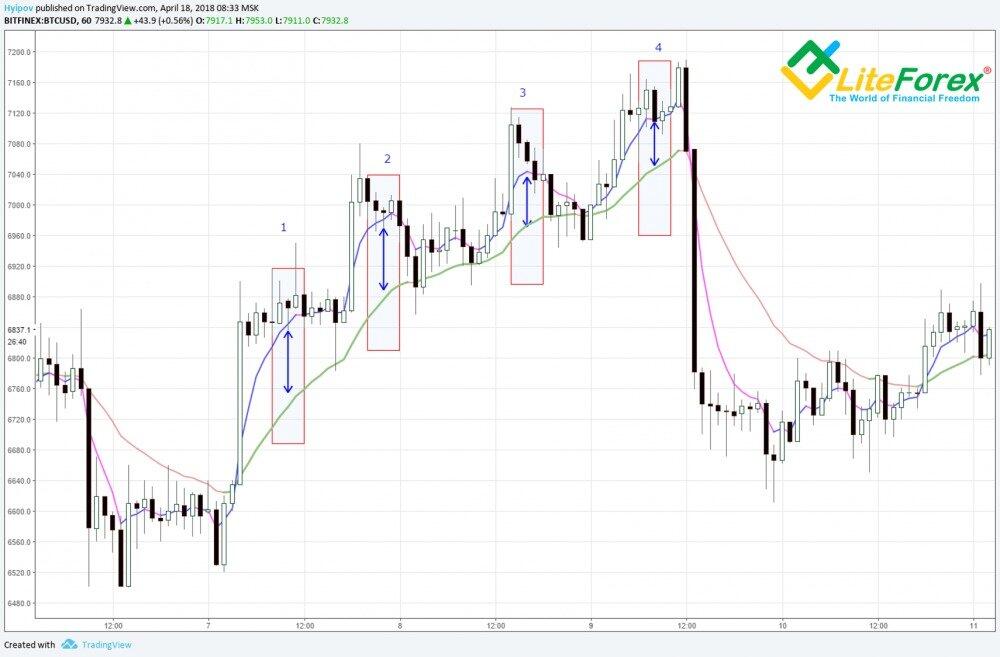
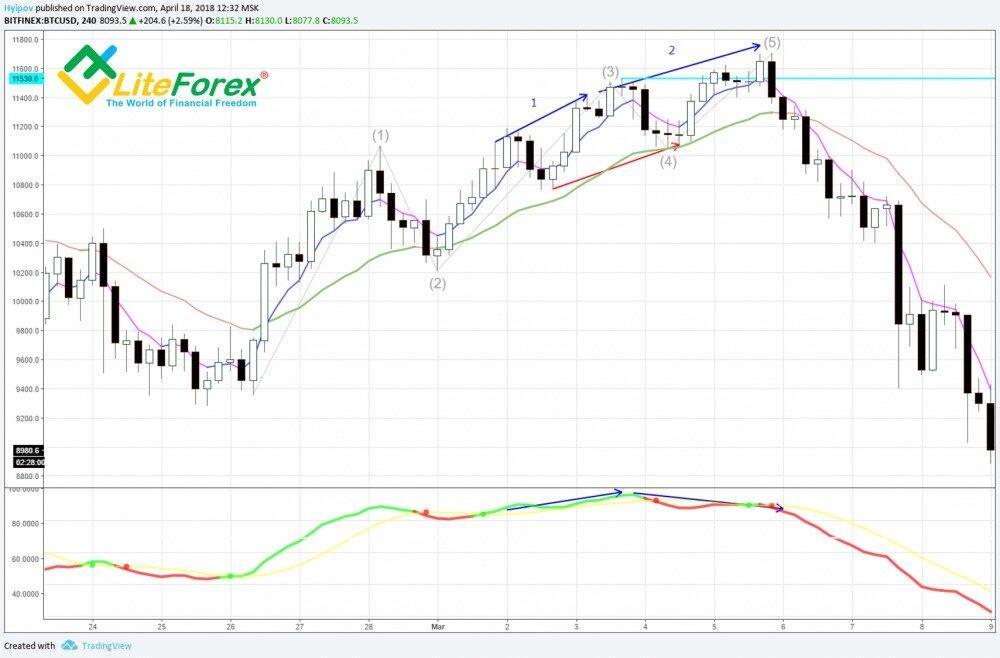
In the chart above, there four price jumps. They look like the deviation of the short moving average from the long one (imbalance).
All jumps have the following properties:
- Jumps are always followed by a rebound moving until the balance (equilibrium) point is reached;
- Jumps in longer timeframes are always more important, according to technical analysis.;
- When the market reaches the equilibrium, it results in new jumps. The market can’t remain at the n the equilibrium point for a long time!
In total, there are two types of jumps in the market: they are “jumps against the trend” (jump 1,2,3) and “jumps along the new trend” (jump 4).
These jumps look alike but they have a fundamental difference. “Jumps against the trend” always signal the trend extension; but the “jumps along the trend” signal a new trend to start.
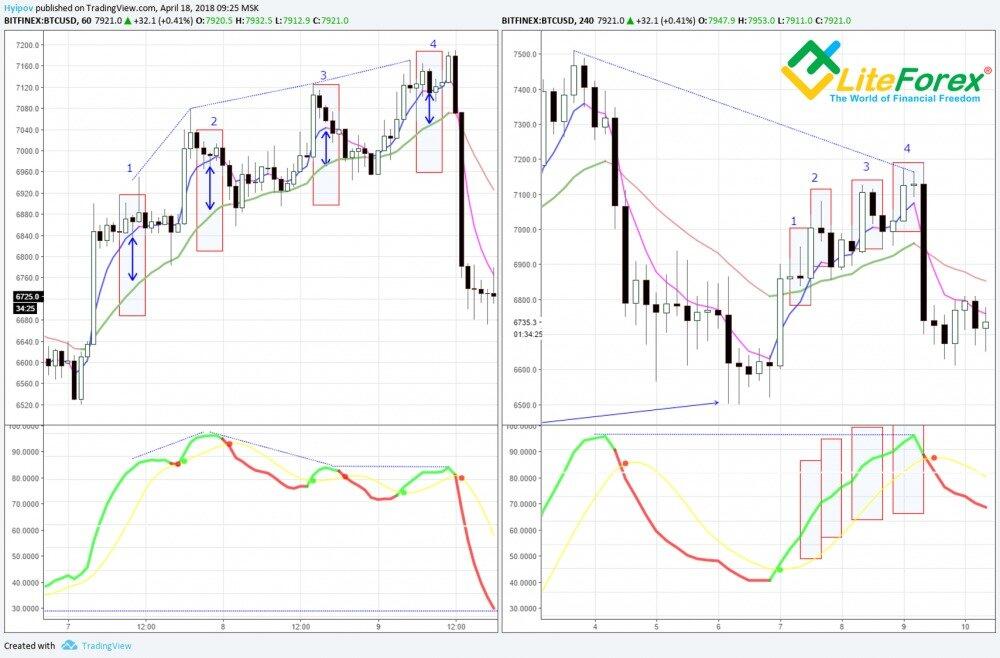
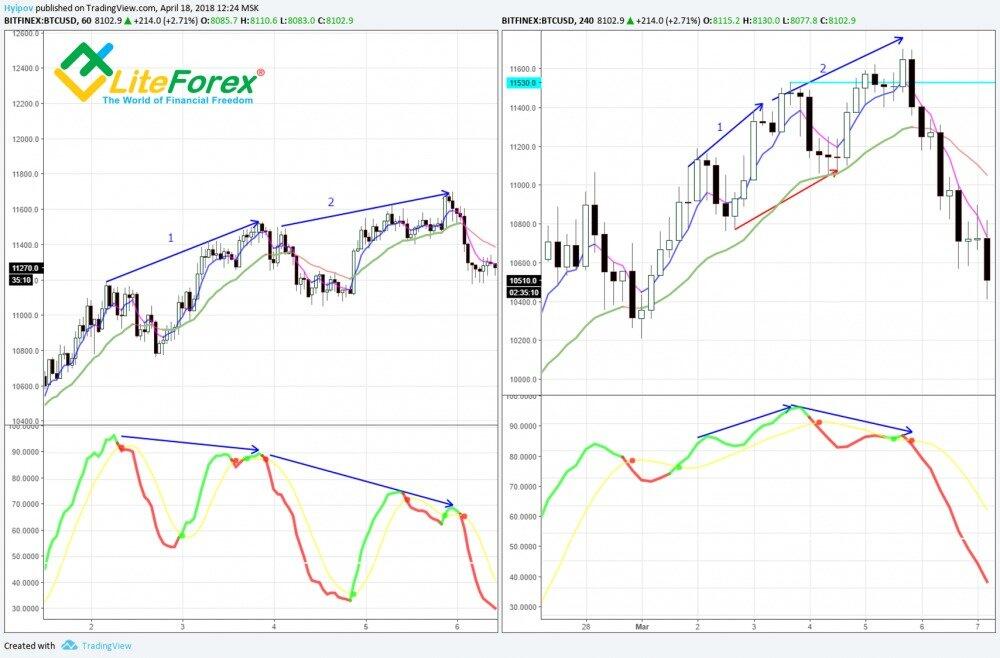
In the chart above, you see that the jumps in the hourly chart (on the left) 1 and 2 are not followed by divergence in the same timeframe; however, there is already bearish divergence between tops 2-3.
Despite this, the moving in the trend extended, and only bearish divergence 3-4 worked out. As you understand, it is jump 4 became the last momentum in the bullish trend, finally resulting in the reversal and a new trend direction.
To filter out such jumps and understand, which of them result in reversal, and which don’t, we need to take a look at a longer timeframe. Here, it is 4-hour one.
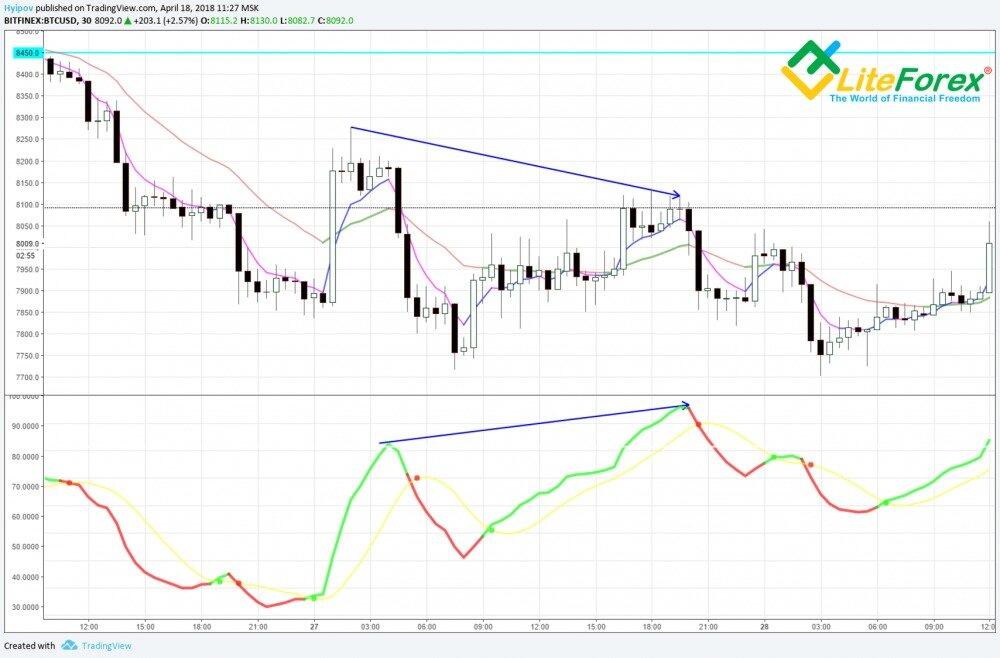
You see in the chart above, jumps 1,2, 3 didn’t create divergence in the 4-hour timeframe. Only the last, the fourth, jump signaled reversal, making up convergence (bearish hidden convergence) in the longer timeframe. We see, after the last, the fourth jump, MACD oscillator reaches its previous local high, although the price ticker hasn’t.
Therefore, reversal jumps along a new trend are always matched by the oscillator divergence (convergence) in the current timeframe, or a longer one.
As SK-FX strategy combines trend indicators and oscillators, it is very important to understand these tools and feel them!
If it is more or less clear with trend indicators, many can still have problems with oscillators. One of the most important oscillators’ signal is divergence! I devoted a whole post to this signal (see here). I strongly suggest those, who are not familiar with this notion, should read the post.
Today, I’m going to reveal how to monitor these signals and filter them out most efficiently, applying SK-FX strategy. Sergey Kucher suggests using MACD, OsMA or MACD indicators, based on moving averages. Speaking about divergences, the strategy author gives some important tips and reveals the secrets of applying these signals.
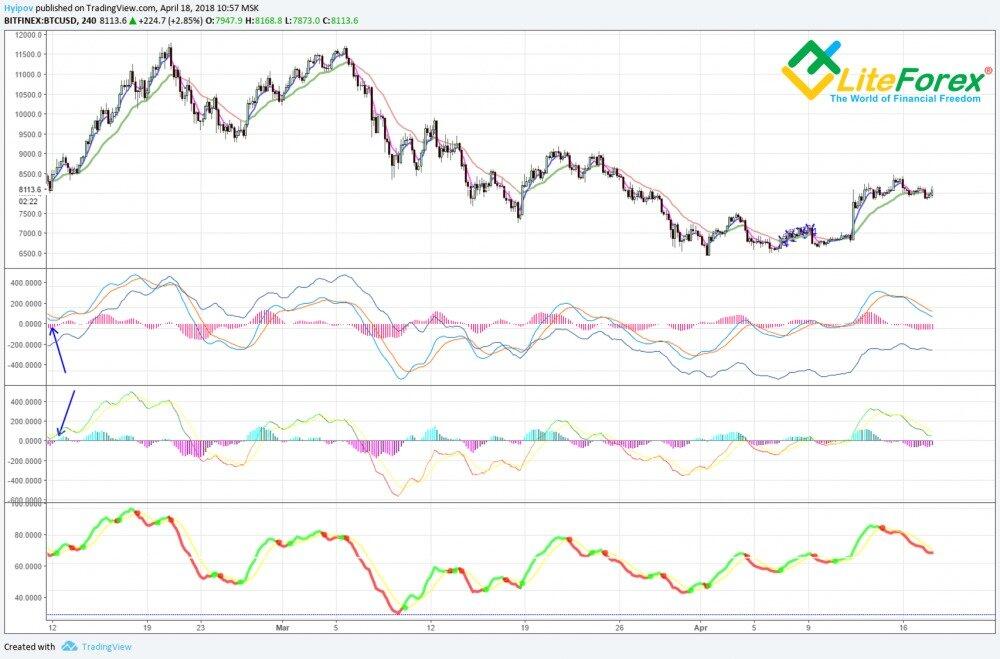
- Forget about zero level, dividing the oscillator into two parts (marked with blue arrows). It doesn’t matter in analyzing divergence; sometimes, it can be even confusing.
- Divergence against the trend (regular) and hidden divergence (along the trend) are equal in their power, all else being equal.
- The longer is timeframe, the stronger is divergence.
- The last divergence is the strongest
* The same is true for convergence. Convergence, according to classical technical analysis, occurs when the price reaches extremes, close to these, showed by the indicator.
A divergence (convergence) starts to form at the moment of:
1. For divergence against the trend – breakout of the previous price high.
2. For divergence against the trend – breakout of the previous price high.
3. For convergence along the trend – breakout of the previous price low.
4. For convergence along the trend – breakout of the previous indicator high.
Here, it is important that the phase of divergence emerging itself doesn’t signal a reversal, however, this signal suggests checking the shorter timeframes for complete divergence reversal signals.
To improve the sensitivity of SK-FX strategy, its author introduces the notions of general and local divergence (convergence). General divergence is the divergence at the edge of two wave formations. Local divergence is the divergence between the LAST waves in the wave formation. Therefore, local divergence indicates a change of wave formations.
SK-FX developer has spent a lot of time on studying divergence and convergence and has perfected this signal.
Summing up his studies of this aspect, we can define the oscillators signals that should be payed attention to:
- divergence (convergence) of the indicator, related to the price move;
- indicator reflection from the window borders;
- indicator jump along and against the trend;
- phase signal along and against the trend (I will describe in part “Phase signal”)
It is important that divergence (convergence) itself is a leading signal, i.e. it signals a future reversal, and so, a reversal at different price levels. As a rule, between the phases of the signal generation and its working out, there are form one to three bars.
In addition, one should be extremely careful, as the phase of divergence emerging doesn’t yet guarantee it to be completed. We should take into account that the price may catch up during the divergence emerging, thereby leveling the discrepancies.
At the same time, a complete divergence (convergence) signal is never a false one. It always works out in the wave formation; however, this signal can be wrongly interpreted.
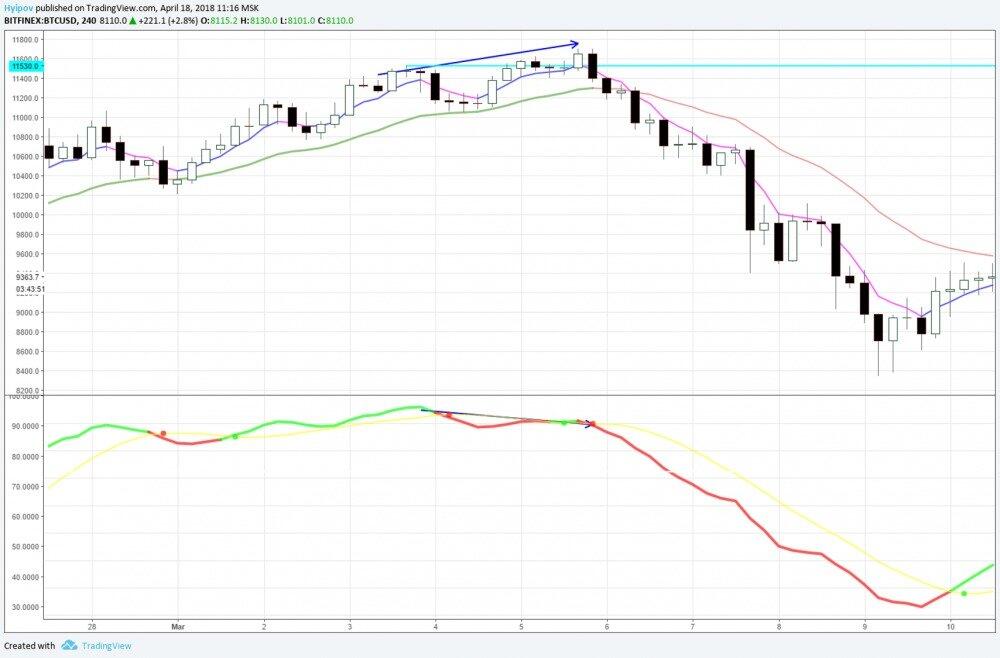
Now, let’s study the examples of general and local divergence.
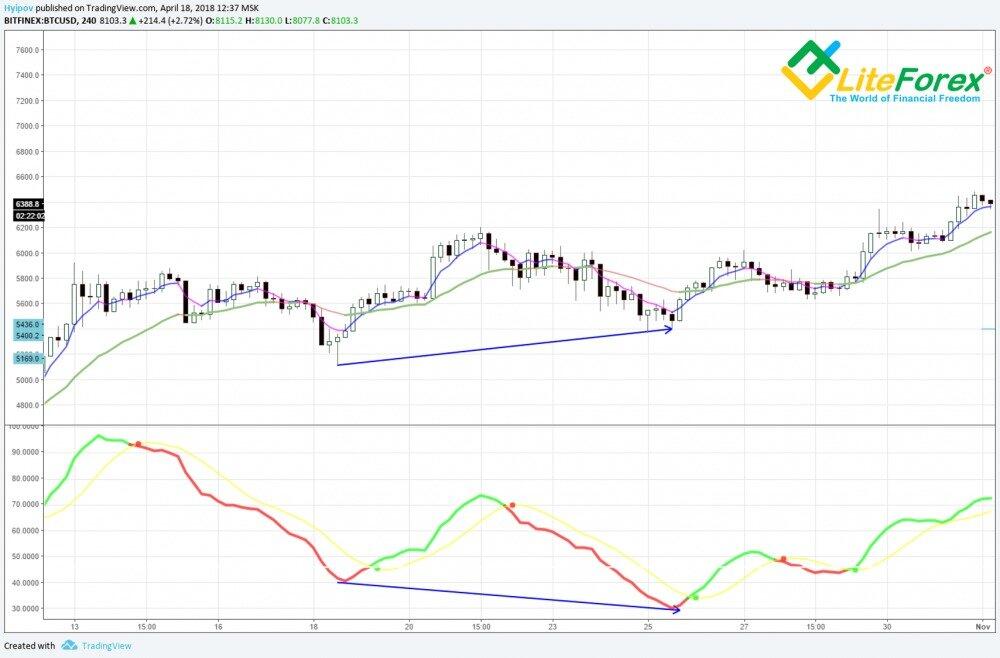
On the left of the chart, we see two divergences in the hourly timeframe. Divergence 1 is general, divergence 2 is local, i.e. results in the trend reversal. To prove it, we need to check the longer timeframe. On the right of the chart, we see that divergence 1 is not indicated, but divergence 2 is clearly seen. Another sign of local divergence is its location in the wave formation.
As said, local divergence is always between the last two waves in a wave formation.
Each of these signs is self-sufficient; however, their combination 100% guarantees the trend reversal.
Let’s sum up our lesson.
- Price jumps always rebound to the equilibrium point.
- Price jumps along a new trend are matched by divergence in the current timeframe or a longer one.
- Divergence signal is a leading one.
- All divergences are equal, all else being equal.
- Any divergence signals a reversal only when the divergence completes in a shorter timeframe.
- The importance of divergence signals is determined by the timeframe length, the signal location in the wave formation, the confirmation of the signal in the longer timeframe.
Everything, related to divergence, is equally true for convergence as well.
That’s the end of the lesson.
In the next article, we’ll go on studying SK-FX strategy:
- will learn about divergence (convergence);
- study phase and phantom signals;
- see how the signals work out in longer timeframes.
Looking forward to your likes, reposts and comments :)
I wish you good luck and good profits!
P.S. Did you like my article? Share it in social networks: it will be the best "thank you" :)
Useful links:
- I recommend trying to trade with a reliable broker here. The system allows you to trade by yourself or copy successful traders from all across the globe.
- Use my promo code BLOG to get a 50% deposit bonus on the LiteFinance platform. Simply enter this code in the appropriate field when funding your trading account.
- Telegram chat for traders: https://t.me/litefinancebrokerchat. We are sharing the signals and trading experience.
- Telegram channel with high-quality analytics, Forex reviews, training articles, and other useful things for traders https://t.me/litefinance
The content of this article reflects the author’s opinion and does not necessarily reflect the official position of LiteFinance broker. The material published on this page is provided for informational purposes only and should not be considered as the provision of investment advice for the purposes of Directive 2014/65/EU.
According to copyright law, this article is considered intellectual property, which includes a prohibition on copying and distributing it without consent.