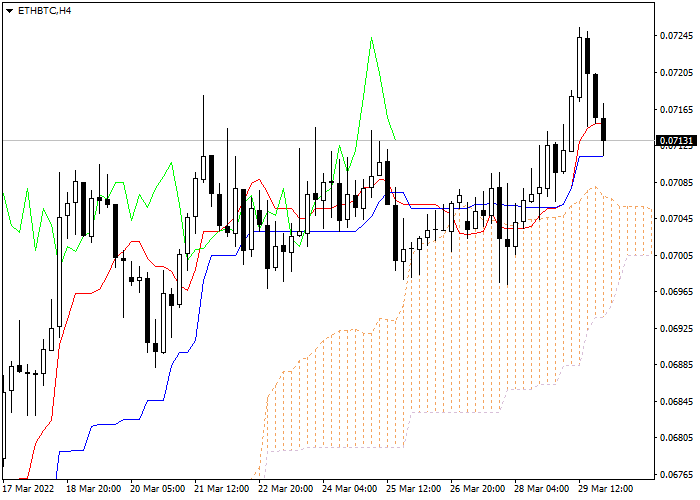
Let's look at the four-hour chart. Tenkan-sen line is above Kijun-sen, the lines are horizontal . Confirmative line Chikou Span is above the price chart, current cloud is ascending. The instrument is trading between Tenkan-sen and Kijun-sen lines. The closest support level is the upper border of the cloud (0.7088). One of the previous maximums of Chikou Span line is expected to be a resistance level (0.7335).
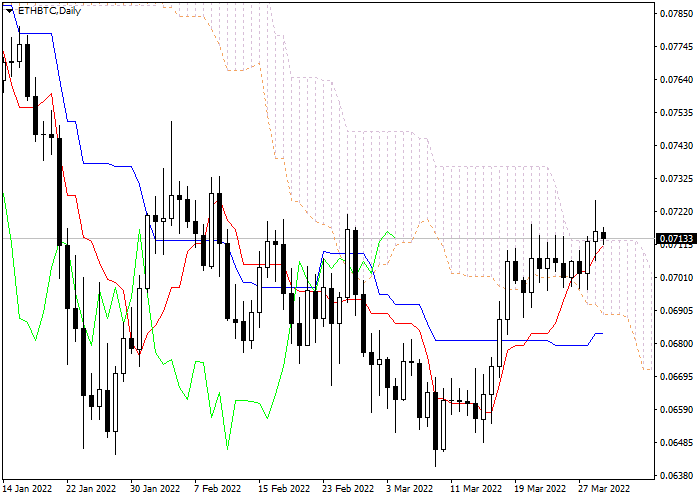
On the daily chart Tenkan-sen line is above Kijun-sen, the red line is directed upwards, while the blue one remains horizontal. Confirmative line Chikou Span is above the price chart, current cloud is ascending. The instrument has broken through the cloud and is still rising. The closest support level is the lower border of the cloud (0.07051). One of the previous maximums of Chikou Span line is expected to be a resistance level (0.07358).
It is recommended to open long positions at current price with Take Profit at the level of previous maximum of Chikou Span (0.7335) line and Stop Loss at the level of Kijun-sen line (0.7088).
سناریو
| تایم فریم | محدوده روز |
| توصیه ها | BUY |
| نقطه ورود | 0.0713 |
| Take Profit | 0.7335 |
| Stop Loss | 0.7088 |
| سطوح حمایتی | 0.07051, 0.7088, 0.7335, 0.07358 |
سناریو جایگزین
| توصیه ها | |
| نقطه ورود | |
| Take Profit | |
| Stop Loss | |
| سطوح حمایتی |

مطالب منتشر شده در این صفحه توسط لایت فایننس فقط برای اهداف اطلاعاتی ارائه شدهاند و نباید به عنوان مشاوره سرمایهگذاری یا مشاوره برای اهداف دستورالعمل 2014/65/EU تلقی شوند. افزون بر این، این مطالب بر اساس الزامات قانونی که به ترویج تحقیقات مستقل سرمایهگذاری مربوط میشود، تهیه نشدهاند و تحت هیچ نوع ممنوعیتی در مورد انتشار تحقیقات سرمایهگذاری قرار ندارند.