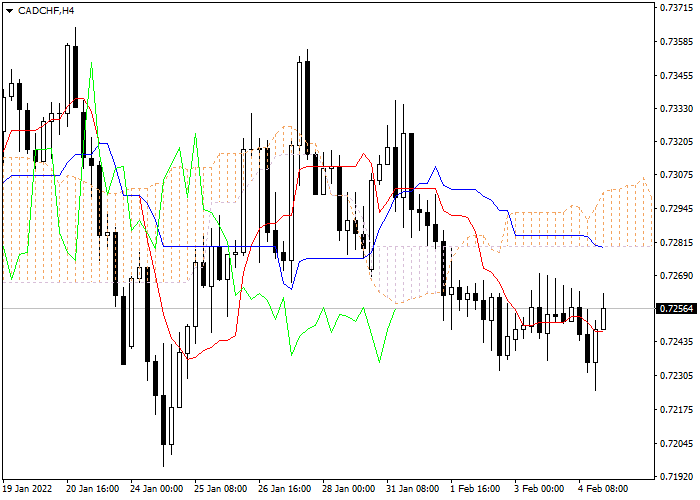
Let's look at the four-hour chart. Tenkan-sen line is below Kijun-sen, the lines are horizontal . Confirmative line Chikou Span is below the price chart, current cloud is descending. The instrument is trading below Tenkan-sen and Kijun-sen lines; the Bearish trend is still strong. One of the previous minimums of Chikou Span line is expected to be a support level (0.7044). The closest resistance level is the upper border of the cloud (0.7308).
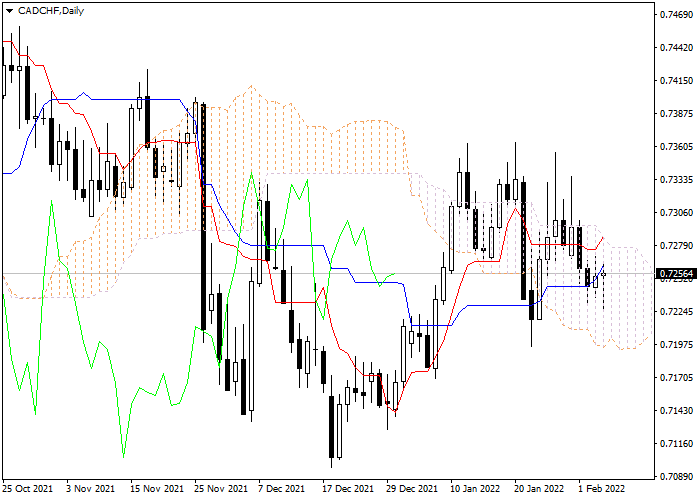
On the daily chart Tenkan-sen line is above Kijun-sen, the lines are horizontal . Confirmative line Chikou Span is below the price chart, current cloud is ascending. The instrument has entered the cloud. The closest support level is the lower border of the cloud (0.7194). The closest resistance level is the lower border of the cloud (0.7287).
On the four-hour chart the instrument is still rising. On the daily chart the instrument is trading within the cloud. It is recommended to open short positions at current price with the target at the level of previous minimum of Chikou Span line (0.7044) and Stop Loss at the lower border of the cloud (0.7308).
Canadian Dollar vs Swiss Franc
| ซื้อ | ขาย | สเปรด |
| 0.58196 | 0.581 | 96 |
สถานการณ์
| กรอบเวลา | ช่วงกลางวัน |
| คำแนะนำ | SELL |
| จุดที่เข้า | 0.7256 |
| Take Profit | 0.7044 |
| Stop Loss | 0.7308 |
| ระดับสำคัญ | 0.7044, 0.7194, 0.7287, 0.7308 |
สถานการณ์ทางเลือก
| คำแนะนำ | |
| จุดที่เข้า | |
| Take Profit | |
| Stop Loss | |
| ระดับสำคัญ |
สื่อที่เผยแพร่ในหน้านี้จัดทำขึ้นโดยบริษัท Claws&Horns ร่วมกับ LiteFinance และไม่ควรพิจารณาว่าเป็นคำแนะนำด้านการลงทุนเพื่อวัตถุประสงค์ของคำสั่ง 2014/65/EU นอกจากนี้ สื่อดังกล่าวไม่ได้จัดทำขึ้นตามข้อกำหนดทางกฎหมายที่ออกแบบมาเพื่อส่งเสริมความเป็นอิสระของการวิจัยด้านการลงทุน และไม่ถือเป็นข้อห้ามในการทำธุรกรรมก่อนการเผยแพร่ผลการวิจัยดังกล่าว