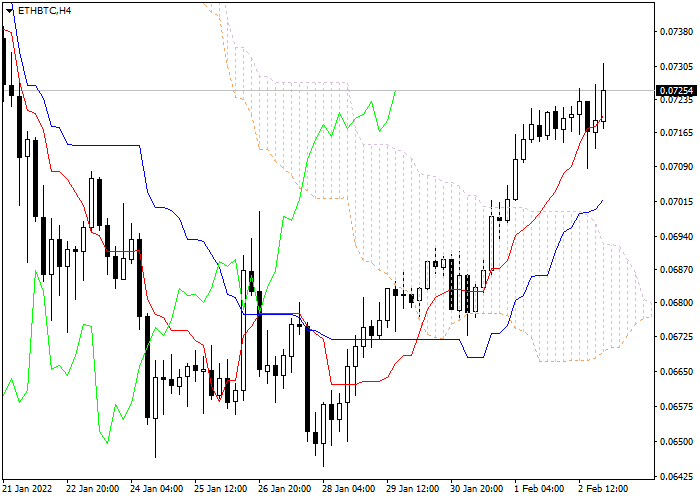
Let's look at the four-hour chart. Tenkan-sen line is above Kijun-sen, the lines are horizontal . Confirmative line Chikou Span is above the price chart, current cloud is ascending. The instrument is trading below Tenkan-sen and Kijun-sen lines; the Bearish trend is still strong. The closest support level is Kijun-sen line (0.0698). One of the previous maximums of Chikou Span line is expected to be a resistance level (0.0804).
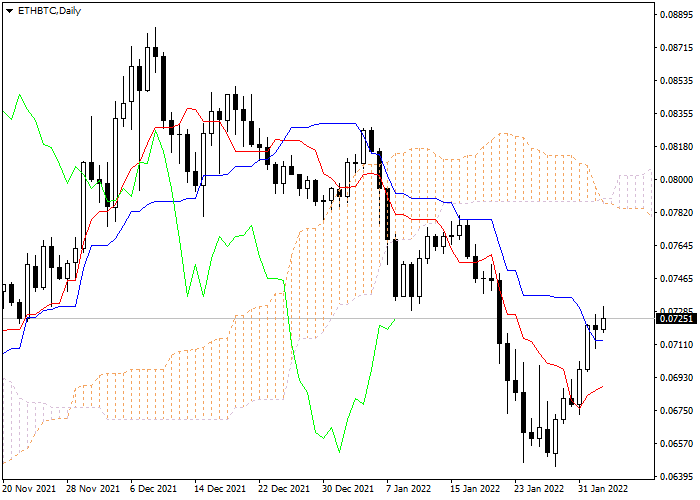
On the daily chart Tenkan-sen line is below Kijun-sen, the lines are horizontal . Confirmative line Chikou Span is below the price chart, current cloud is descending. The instrument has broken through Tenkan-sen and Kijun-sen lines. The closest support level is the lower border of the cloud (0.0767). The closest resistance level is Kijun-sen line (0.0674).
On the four-hour chart the instrument is still rising. On the daily chart the Bearish trend is still strong. It is recommended to open long positions at current price with Take Profit at the level of previous maximum of Chikou Span (0.0804) line and Stop Loss at the level of Kijun-sen line (0.0698).
方案
| 时间范围 | 日期范围 |
| 建议 | BUY |
| 进场点 | 0.0725 |
| Take Profit | 0.0804 |
| Stop Loss | 0.0698 |
| 重要价格水平 | 0.0674,0.0698, 0.0767, 0.0804 |
替代方案
| 建议 | |
| 进场点 | |
| Take Profit | |
| Stop Loss | |
| 重要价格水平 |

在本页上发布的材料是由 Claws&Horns 公司与 LiteFinance 联合制定的,且不应被视为根据 2014/65/EU 指令提供的投资建议;此外,它并不是根据旨在促进投资研究独立性的法律要求编写的,也不受任何禁止分发此类研究的规定约束。