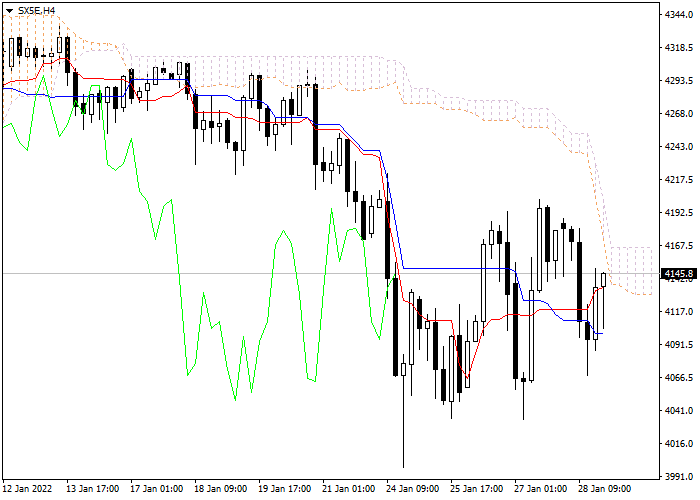
Let's look at the four-hour chart. Tenkan-sen line is above Kijun-sen, the lines are horizontal . Confirmative line Chikou Span is below the price chart, current cloud is descending. The instrument is trading around lower border of the cloud. One of the previous minimums of Chikou Span line is expected to be a support level (3907.2). The closest resistance level is the upper border of the cloud (4214.2).
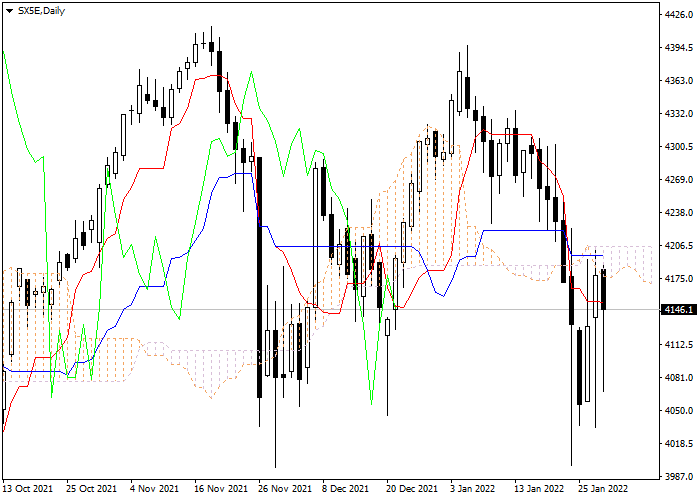
On the daily chart Tenkan-sen line is below Kijun-sen, the lines are horizontal . Confirmative line Chikou Span is below the price chart, current cloud is descending. The instrument is trading around lower border of the cloud. One of the previous minimums of Chikou Span line is expected to be a support level (3918.5). One of the previous maximums of Chikou Span line is expected to be a resistance level (4279.5).
On the both charts the instrument is still falling. It is recommended to open short positions at current price with Take Profit at the level of previous minimum of Chikou Span line (3907.2) and Stop Loss at the level of Kijun-sen line (4214.2).
EUROSTOXX50 index
| شراء | بيع | الفارق السعري |
| 5998.3 | 5986.5 | 118 |
سيناريو
| الاطار الزمنى | نطاق اليوم |
| توصيات | SELL |
| نقطة الدخول | 4143.8 |
| Take Profit | 3907.2 |
| Stop Loss | 4214.2 |
| المستويات الرئيسية | 3907.2, 3918.5, 4214.2, 4279.5 |
السيناريو البديل
| توصيات | |
| نقطة الدخول | |
| Take Profit | |
| Stop Loss | |
| المستويات الرئيسية |
تمّ إنتاج المواد المنشورة على هذه الصفحة من قِبَل شركة Claws&Horns بالاشتراك مع شركة LiteFinance ولا ينبغي التعامُل معها على أنّها توصية أو نصيحة استثمارية بموجب التوجيه رقم 2014/65/EU، وتجدر الإشارة إلى أنّه لم يتمّ إعدادها بما يتماشى مع المتطلّبات القانونية الهادفة إلى تعزيز استقلالية البحوث الاستثمارية. وعليه، فهي لا تخضع لأي قيود تتعلّق بكيفية التعامُل مع البحوث قبل نشرها.