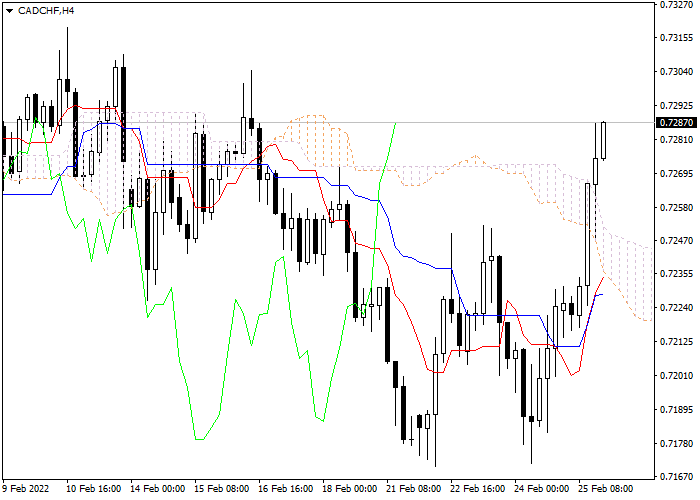
Let's look at the four-hour chart. Tenkan-sen line is above Kijun-sen, the red line is directed upwards, while the blue one remains horizontal. Confirmative line Chikou Span is above the price chart, current cloud is ascending. The instrument has broken through the cloud and is still rising. The closest support level is the upper border of the cloud (0.7220). One of the previous maximums of Chikou Span line is expected to be a resistance level (0.7480).
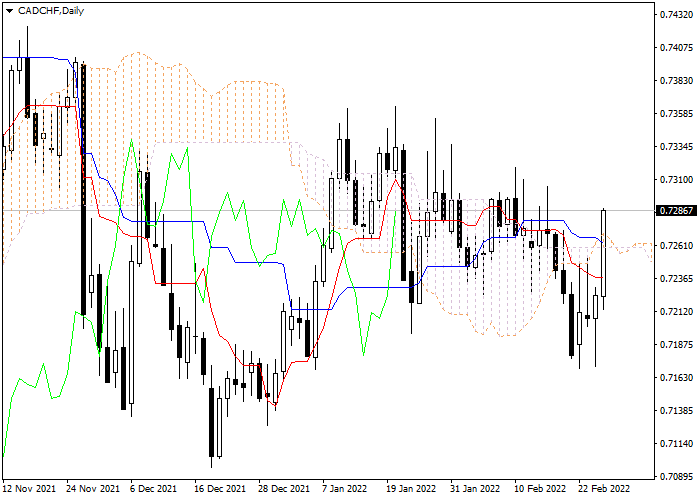
On the daily chart Tenkan-sen line is below Kijun-sen, the blue line is directed downwards, while the red one remains horizontal. Confirmative line Chikou Span is crossing the price chart from below, current cloud is ascending. The instrument has broken through the cloud and slowed down its growth. The closest support level is Tenkan-sen line (0.7235). One of the previous maximums of Chikou Span line is expected to be a resistance level (0.7374).
It is recommended to open long positions at current price with the target at the level of previous maximum of Chikou Span line (0.7480) and Stop Loss at the upper border of the cloud (0.7220).
Canadian Dollar vs Swiss Franc
| شراء | بيع | الفارق السعري |
| 0.58196 | 0.581 | 96 |
سيناريو
| الاطار الزمنى | نطاق اليوم |
| توصيات | BUY |
| نقطة الدخول | 0.7284 |
| Take Profit | 0.7480 |
| Stop Loss | 0.7220 |
| المستويات الرئيسية | 0.7220, 0.7235, 0.7480, 0.7374 |
السيناريو البديل
| توصيات | |
| نقطة الدخول | |
| Take Profit | |
| Stop Loss | |
| المستويات الرئيسية |
تمّ إنتاج المواد المنشورة على هذه الصفحة من قِبَل شركة Claws&Horns بالاشتراك مع شركة LiteFinance ولا ينبغي التعامُل معها على أنّها توصية أو نصيحة استثمارية بموجب التوجيه رقم 2014/65/EU، وتجدر الإشارة إلى أنّه لم يتمّ إعدادها بما يتماشى مع المتطلّبات القانونية الهادفة إلى تعزيز استقلالية البحوث الاستثمارية. وعليه، فهي لا تخضع لأي قيود تتعلّق بكيفية التعامُل مع البحوث قبل نشرها.