The Dow Jones Industrial Average (DJIA) index is a crucial indicator of the US economy and the global stock market. Evaluating and forecasting its performance is essential for investors, traders, and analysts, as it showcases the state of major US companies and influences strategic decisions.
This article provides a detailed analysis of current trends, a technical forecast for 2026, and a long-term trading plan. It emphasizes the fundamental and technical factors influencing the index, enabling traders to make informed predictions and create effective strategies.
The article covers the following subjects:
- Major Takeaways
- DJIA Real-Time Market Status
- DJIA Price Forecast for 2026 Based on Technical Analysis
- Analysts' DJIA Price Projections for 2027
- Analysts' DJIA Price Projections for 2028
- Analysts' DJIA Price Projections for 2029
- Analysts' DJIA Price Projections for 2030
- Analysts' DJIA Price Projections up to 2050
- DJIA (Dow Jones) Social Media Sentiment
- DJIA Price History
- DJIA Fundamental Analysis
- More Facts About DJIA
- How We Make Forecasts
- Conclusion: Is DJIA a Good Investment?
- DJIA Price Prediction FAQ
Major Takeaways
The current price of YM stands at $51 808.0 as of 27.09.2026.
The highest YM price of $54729.1 was reached on 05.08.2026, while the all-time low of $40.56 was set on 08.07.1932.
The DJIA value is influenced by US macroeconomic policies, including interest rate changes and tax reforms, as well as the condition of global markets.
Sector diversification helps mitigate the effects of crises in specific industries of the economy, ensuring the Dow Jones value remains relatively stable.
The DJIA is a key indicator of economic health, reflecting the corporate reports of the 30 largest US companies.
DJIA forecasts vary considerably. By the end of 2026, the index could be trading between $54,603 and $59,185, based on more moderate estimates. However, a significant rise toward $66,083 is also possible.
Most forecasts for 2027 are positive. WalletInvestor expects the index to reach $58,173 by year-end, while LongForecast projects a sharp rise to $83,698.
Forecasts for 2028–2030 vary significantly. By the end of 2030, WalletInvestor expects the index to reach around $71,187, while CoinPriceForecast projects a rise to $81,542. LongForecast anticipates a rally toward $101,609.
In the long term, the index is expected to continue rising. According to CoinPriceForecast, the DJIA could exceed $100,000 by 2033. The index could then reach $120,314 by the end of 2037.
DJIA Real-Time Market Status
The DJIA is trading at $51 808.0 as of 27.09.2026.
It is critical to track key indicators to analyze the DJIA index. Monitoring trading volume helps assess market activity. Meanwhile, the 3-month average volume allows you to assess long-term trends. Additionally, observing the change over a year reflects the price movement.
Indicator | Value |
Average trading volume | 491.6 million shares of DJIA constituent companies |
All-time high | $54729.1 |
Price change over the last 12 months | +19.70% |
Daily range | $53,622.46–54,049.14 |
Number of companies in the index | 30 |
DJIA Price Forecast for 2026 Based on Technical Analysis
The DJIA remains in a steady uptrend. The price is moving within an ascending channel and remains above the EMA 21, EMA 50, and EMA 100. The index is currently trading below the resistance at $54,887, with the nearest support around $51,430, close to the EMA 21.
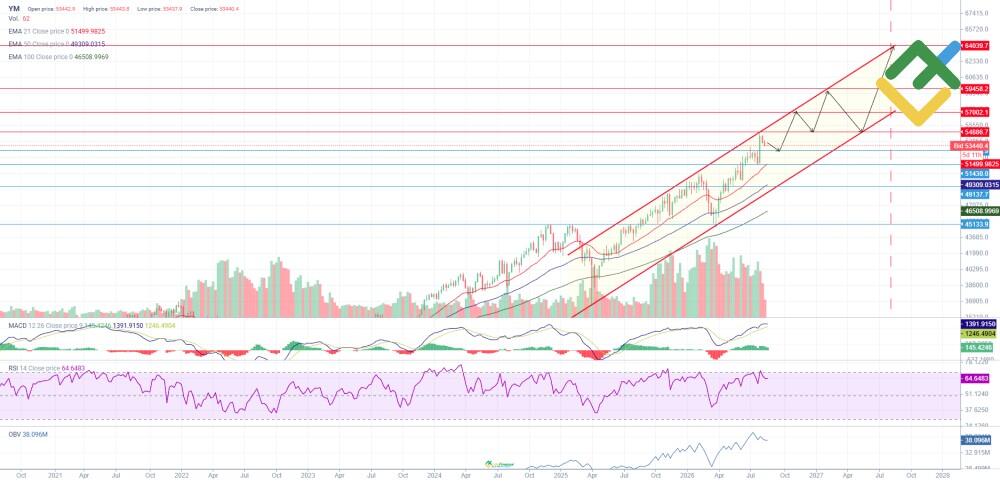
MACD remains in positive territory, suggesting that bullish momentum persists. The RSI is around 67, approaching the overbought zone, but there is no reversal signal yet. The OBV remains high, confirming strong demand. The price is currently in the upper part of the channel, while the latest candles indicate slowing growth.
Below is the DJIA's 12-month price forecast.
Month | Low, $ | High, $ |
September 2026 | 52,800 | 55,000 |
October 2026 | 54,000 | 57,002 |
November 2026 | 54,887 | 57,002 |
December 2026 | 54,887 | 57,500 |
January 2027 | 56,000 | 58,400 |
February 2027 | 57,500 | 59,458 |
March 2027 | 56,000 | 58,500 |
April 2027 | 54,887 | 57,000 |
May 2027 | 54,887 | 58,500 |
June 2027 | 58,000 | 61,000 |
July 2027 | 60,050 | 64,000 |
August 2027 | 62,000 | 64,000 |
Long-Term DJIA Trading Plan for 2026
A correction toward $52,800–53,000 is expected. Long positions can be opened in this area if confirmed by additional signals. The nearest upside target is $57,002. The rally may then continue toward $59,458.
A correction toward $54,887 is possible and could provide an opportunity to add to long positions. By year-end, the index may reach a high of $64,000. A positive MACD, an RSI recovery, and further growth in the OBV would support long entries.
Analysts' DJIA Price Projections for 2026
DJIA forecasts for the remainder of 2026 vary considerably. Analysts expect the index to post either moderate or significant gains. The DJIA may be influenced by Fed monetary policy, the state of the US economy, corporate earnings, and investor sentiment.
WalletInvestor
Price range: $51,867.40–55,383.92.
According to WalletInvestor, the DJIA will trade in a broad range through the end of 2026. In October, the index may decline to around $51,900. A recovery is then expected, with the index potentially reaching around $54,603 by year-end.
Month | Low, $ | Average Price, $ | High, $ |
September | 52,781.03 | 53,659.02 | 54,214.42 |
October | 51,867.40 | 53,116.58 | 53,906.62 |
November | 52,936.36 | 54,051.07 | 55,119.26 |
December | 54,454.00 | 54,869.45 | 55,349.68 |
LongForecast
Price range: $51,109–70,709.
According to LongForecast, the DJIA may rise significantly through the end of the year. In September, the index may trade between $51,109 and $62,734. The rally may continue in the autumn. In November, the index may close at around $62,167. By December, it may reach a high of $70,709.
Month | Low, $ | High, $ | Closing price, $ |
September | 51,109 | 62,734 | 58,630 |
October | 54,699 | 62,933 | 58,816 |
November | 57,815 | 66,519 | 62,167 |
December | 61,457 | 70,709 | 66,083 |
CoinPriceForecast
Price range: $52,319–59,185.
According to CoinPriceForecast, the DJIA is expected to continue rising in the second half of 2026. By December, the index may reach $59,185.
Year | Mid-Year, $ | End of Year, $ |
2026 | 52,319 | 59,185 |
Analysts' DJIA Price Projections for 2027
Analysts expect the DJIA to rise in 2027. Fed policy, the state of the US economy, the financial performance of major US companies, and market sentiment may influence the index.
Note: The price ranges reflect the asset's expected volatility throughout the year. Lows and highs may not be shown in the summary tables.
WalletInvestor
Price range: $54,336.88–61,790.35.
According to WalletInvestor, the index is expected to rise in the first half of the year. In the second quarter, the index may reach a high of $61,790.35. A correction is expected in the summer, followed by a resumption of the uptrend. In the fourth quarter, the average price is projected to be around $60,236.14.
Quarter | Low, $ | Average Price, $ | High, $ |
Q1 | 54,336.88 | 56,725.17 | 59,439.44 |
Q2 | 57,117.38 | 59,322.36 | 61,790.35 |
Q3 | 55,265.03 | 58,373.90 | 60,628.48 |
Q4 | 58,119.11 | 60,236.14 | 61,677.19 |
LongForecast
Price range: $62,214–89,557.
According to LongForecast, the DJIA is expected to remain primarily in an uptrend. The index may close at $68,171 in the first quarter and $71,063 in the second. Growth may accelerate in the second half of the year. By year-end, analysts expect the index to reach a high of $89,557.
Quarter | Low, $ | High, $ | Closing price, $ |
Q1 | 62,214 | 72,943 | 68,171 |
Q2 | 64,437 | 76,037 | 71,063 |
Q3 | 67,389 | 81,425 | 76,098 |
Q4 | 74,497 | 89,557 | 83,698 |
CoinPriceForecast
Price range: $66,497–68,079.
According to CoinPriceForecast, the DJIA is expected to continue rising in 2027. The index may reach $66,497 by mid-year and $68,079 by December. Most of the growth is expected in the first half of the year.
Year | Mid-Year, $ | End of Year, $ |
2027 | 66,497 | 68,079 |
Analysts' DJIA Price Projections for 2028
Analysts expect the DJIA to rise in 2028, although forecasts vary significantly. The index may be influenced by Fed monetary policy, US economic growth, and the financial performance of major US companies.
WalletInvestor
Price range: $54,047.51–65,012.34.
According to WalletInvestor, the DJIA is expected to trade in a broad range. In the third quarter, the index may reach an annual high of $65,012.34. A slight correction is possible toward the end of the year.
Quarter | Low, $ | Average Price, $ | High, $ |
Q1 | 54,047.51 | 56,211.32 | 58,486.41 |
Q2 | 55,926.58 | 57,661.41 | 59,360.76 |
Q3 | 58,567.18 | 62,024.72 | 65,012.34 |
Q4 | 59,544.78 | 61,644.53 | 64,568.83 |
LongForecast
Price range: $71,814–97,205.
According to LongForecast, the DJIA is expected to remain primarily in an uptrend. The index may close at $82,608 in the first quarter. By autumn, it may reach a high of $97,205. By December, the index may correct to $81,877.
Quarter | Low, $ | High, $ | Closing price, $ |
Q1 | 73,375 | 88,391 | 82,608 |
Q2 | 72,777 | 89,425 | 83,367 |
Q3 | 78,639 | 97,205 | 90,846 |
Q4 | 71,814 | 90,846 | 81,877 |
CoinPriceForecast
Price range: $70,387–71,672.
According to CoinPriceForecast, the DJIA is expected to rise gradually. The index may reach $70,387 by mid-2028 and $71,672 by year-end.
Year | Mid-Year, $ | End of Year, $ |
2028 | 70,387 | 71,672 |
Analysts' DJIA Price Projections for 2029
Analysts expect the DJIA to trend mostly upward. The index may be influenced by the US economy, Fed policy, corporate earnings, and investor sentiment.
WalletInvestor
Price range: $58,945.38–74,325.64.
According to WalletInvestor, the DJIA may trade between $58,945.38 and $65,625.18 in the first half of the year. The rally could gain momentum during the second half of the year. In the fourth quarter, the index may reach a high of $74,325.64.
Quarter | Low, $ | Average Price, $ | High, $ |
Q1 | 59,785.27 | 61,928.84 | 64,226.88 |
Q2 | 58,945.38 | 62,252.61 | 65,625.18 |
Q3 | 62,454.71 | 66,196.98 | 71,684.05 |
Q4 | 68,833.52 | 71,337.42 | 74,325.64 |
LongForecast
Price range: $76,957–106,414.
According to LongForecast, the DJIA is expected to continue rising. The index may close at $82,895 in the first quarter and rise to $85,211 in the second. The uptrend may strengthen in the second half of the year. By the fourth quarter, the index may reach a high of $106,414.
Quarter | Low, $ | High, $ | Closing price, $ |
Q1 | 76,957 | 93,127 | 82,895 |
Q2 | 78,422 | 91,704 | 85,211 |
Q3 | 81,161 | 99,489 | 92,980 |
Q4 | 84,711 | 106,414 | 99,452 |
CoinPriceForecast
Price range: $76,361–78,744.
According to CoinPriceForecast, the DJIA is expected to remain in a bullish trend. The index may reach $76,361 by mid-year and rise to $78,744 by December.
Year | Mid-Year, $ | End of Year, $ |
2029 | 76,361 | 78,744 |
Analysts' DJIA Price Projections for 2030
Analysts expect mixed performance from the DJIA. WalletInvestor projects the index to decline after an early-year rise. However, LongForecast and CoinPriceForecast expect the uptrend to continue.
WalletInvestor
Price range: $63,186.36–77,692.89.
According to WalletInvestor, the DJIA may average $74,180.06 in the first quarter. In the second quarter, the average price is expected to fall to $67,572.29. A recovery is possible in the second half of the year, with the index potentially stabilizing at $69,368.83 by year-end.
Quarter | Low, $ | Average Price, $ | High, $ |
Q1 | 71,419.24 | 74,180.06 | 77,692.89 |
Q2 | 63,186.36 | 67,572.29 | 73,134.47 |
Q3 | 63,431.67 | 67,677.28 | 70,177.48 |
Q4 | 66,289.64 | 69,368.83 | 71,855.03 |
LongForecast
Price range: $83,927–108,722.
According to LongForecast, the DJIA will continue to appreciate throughout 2030. The index may close at $90,986 in the first quarter and $96,379 in the second. In the third quarter, it may peak at $108,722.
Quarter | Low, $ | High, $ | Closing price, $ |
Q1 | 84,617 | 103,279 | 90,986 |
Q2 | 83,927 | 103,126 | 96,379 |
Q3 | 89,409 | 108,722 | 101,609 |
CoinPriceForecast
Price range: $79,269–81,542.
According to CoinPriceForecast, the DJIA is expected to remain in an uptrend. The index may reach $79,269 by mid-year and rise to $81,542 by year-end.
Year | Mid-Year, $ | End of Year, $ |
2030 | 79,269 | 81,542 |
Analysts' DJIA Price Projections up to 2050
Long-term DJIA forecasts are highly uncertain. The index may be influenced by US economic growth, Fed monetary policy, inflation, the financial performance of major US companies, and the global economy.
According to CoinPriceForecast, the uptrend is expected to continue. The index may reach $87,222 by the end of 2031, exceed $100,000 in 2033, and reach $120,314 by 2037.
Meyka provides a more conservative forecast. The DJIA may reach around $73,662.71 in 2031 and rise to $85,693.19 by 2033.
Year | Meyka, $ | CoinPriceForecast, $ |
2031 | 73,662.71 | 87,222 |
2033 | 85,693.19 | 100,050 |
2035 | – | 109,250 |
2037 | – | 120,314 |
DJIA (Dow Jones) Social Media Sentiment
Market sentiment reflects the overall attitude toward Dow Jones based on news, publications, and market commentary. Positive sentiment may support further gains, while negative expectations could push the index lower. Analyzing market sentiment can help assess the DJIA's short-term direction and provide additional insight when making trading decisions.
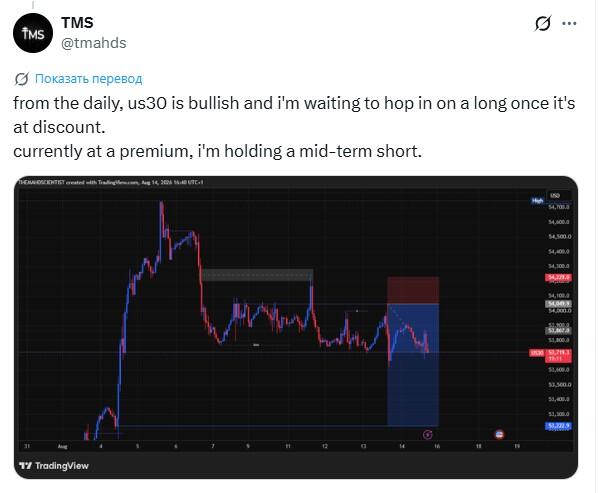
User @tmahds has a bullish daily outlook on US30 but considers current levels overvalued. Therefore, a medium-term correction may occur, providing an opportunity to open long positions at a more attractive price.
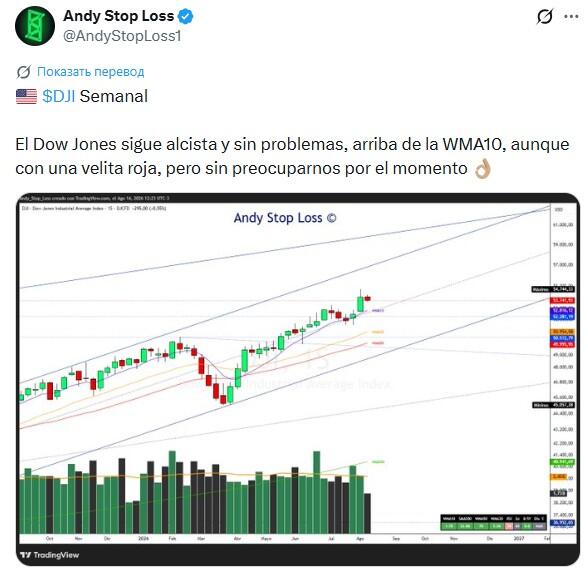
@AndyStopLoss1 is also optimistic about the Dow Jones outlook. On the weekly chart, the index remains above the WMA10, while the small red candle is not yet seen as a reversal signal. The uptrend remains intact.
Trader sentiment on social media remains predominantly bullish. However, some market participants expect a correction before the rally continues.
DJIA Price History
The Dow Jones reached the highest price of $54729.1 on 05.08.2026. The lowest price of the Dow Jones was recorded on 08.07.1932 when the asset declined to $40.56.
It is crucial to evaluate historical data to make our forecasts as accurate as possible. The chart below shows the DJIA price performance over the last ten years.
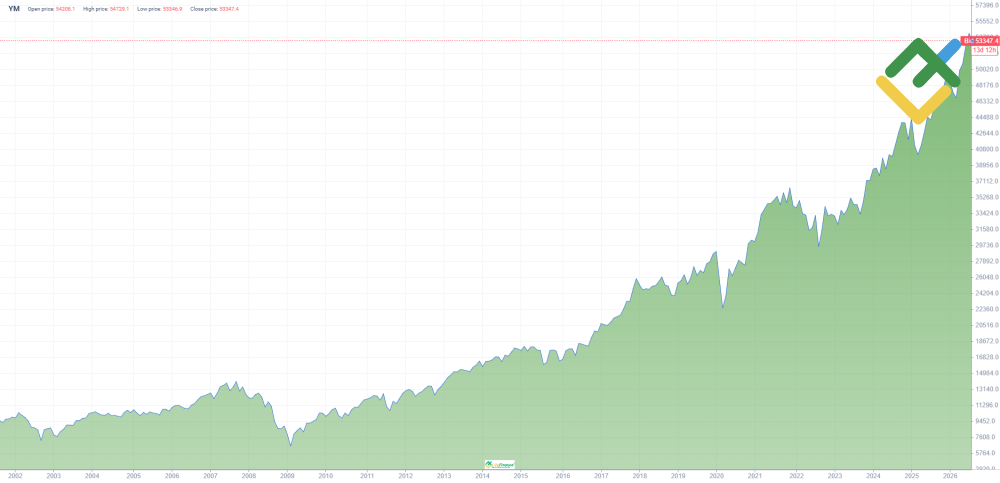
Until 2020, the DJIA index had been trading in a prolonged bull market that had lasted since 2016. The market was betting on steady US economic expansion, low interest rates, and stable corporate earnings growth.
In the spring of 2020, the market crashed due to the COVID-19 pandemic and the ensuing panic. Things started to get better after the Federal Reserve rolled out its support measures.
In early 2022, the index hit a new high amid economic recovery from the pandemic and strong corporate earnings growth. However, later on, the Fed began tightening monetary policy in response to high inflation, triggering a correction and a noticeable increase in volatility.
At the end of 2024, the index faced a correction after a period of robust gains, as investors revised their forecasts for interest rates and economic growth. Despite the decline, the trend remained bullish.
In 2025, the DJIA surged after a drawdown. The index was buoyed by expectations of a more dovish Fed policy and stable corporate earnings.
In April 2026, the DJIA recovered from its March decline, reaching approximately $49,652 by the end of the month. The rally continued in May, with the index reaching $51,094. After a slight decline in June, the index recovered above $52,000 and reached $53,289 in July. On August 5, the DJIA hit a new all-time high of $54,744.33.
DJIA Fundamental Analysis
The fundamental analysis offers valuable insights into the various factors that impact the Dow Jones value. This section highlights essential elements that influence the index's value, including economic shifts, changes in financial markets, and developments in global politics. Investors often rely on these indicators to make well-informed decisions.
What Factors Affect the DJIA Price?
The US federal funds rate affects the cost of capital and lending.
Macroeconomic indicators, such as GDP, inflation, and the unemployment rate.
Financial reports of the companies that comprise the index. Their earnings determine the changes in the DJIA.
Political stability and reforms, and foreign economic events.
Geopolitical events that may lead to short-term fluctuations.
US dollar exchange rate changes, affecting exports and capital inflows.
Technological innovation and company development.
Changes in tax and regulatory policy.
More Facts About DJIA
The Dow Jones Industrial Average (DJIA) is one of the world's oldest and most famous stock indices, established in 1896 by Charles Dow, the Wall Street Journal's editor. The index was created to track the stock performance of leading US industrial companies and show the general state of the economy.
Initially, the index included 12 companies, mostly from the industrial sector, including railway, gas, and oil companies. Today, the DJIA includes 30 large publicly traded companies spanning various sectors, from IT and finance to healthcare and consumer staples.
Analysts utilize the index to assess the state of the US stock market and forecast economic trends. Investors often include YM in their portfolios as a risk-hedging instrument.
Advantages and Disadvantages of Investing in the DJIA
Let's review the major advantages and disadvantages of the Dow Jones that can affect trading and investment decisions.
Advantages
High liquidity. The DJIA index comprises the shares of the largest US companies.
Reliability. The companies listed in the index boast a solid financial position, and the risks associated with long-term investments are low.
Diversification. The DJIA covers various sectors of the economy. Issues in one sector will not significantly affect the rate of the index.
Economic indicator. The DJIA reflects general economic trends, helping investors understand market conditions and prospects.
Affordability. You can invest in the DJIA through ETFs and index funds. Thus, the costs are minimal.
Predictability. Historically, the index has been rising in the long run, making it attractive for capital accumulation.
Resilience to crises. Despite short-term dips, the index usually recovers relatively quickly, which confirms its stability.
Disadvantages
Limited representation. Only 30 companies are included in the index, which does not always reflect the real situation in the market.
High volatility. Short-term price fluctuations can be significant, creating a risk for speculative investors.
Sensitivity to macroeconomics. The DJIA depends on the state of the US economy, including tax and lending policies.
Absence of small businesses. Only large corporations are included in the index.
Potential risks. Economic crises and force majeure events may result in significant losses.
Rare updates to the list of companies. Changes to the index are infrequent, which may weaken its position in the rapidly changing economy.
The DJIA is an attractive instrument for long-term investors due to its reliability, wide range of sectors, and historical stability. However, its limitations require careful analysis. Investors should carefully evaluate their goals and risks before making decisions.
How We Make Forecasts
The DJIA forecasting methodology is based on three time frames: short-, medium-, and long-term, each requiring a specific approach.
Short-term forecasts
Technical indicators such as moving averages and support/resistance levels are used to assess short-term movements. News and events affecting market sentiment are also taken into account.
Medium-term forecasts
Fundamental indicators like company reports, rate changes, and economic data form the basis for forecasting. The analysis focuses on industry trends, their effects on the DJIA companies, and their correlation with the macroeconomic situation.
Long-term forecasts
Long-term forecasts examine historical data and assess the global economic outlook. Structural changes such as technological progress, the transition to a green economy, and trade relations between countries are considered.
This approach provides a comprehensive understanding of the factors shaping the DJIA price and allows investors to consider short-term swings, medium-term changes, and long-term trends.
Conclusion: Is DJIA a Good Investment?
The DJIA is one of the key US stock market indices. It includes major companies from various sectors of the US economy, making the index potentially attractive to long-term investors.
Most analysts expect the Dow Jones to continue rising, although their forecasts vary. In the short term, corrections and periods of increased volatility are possible. The DJIA can be included in a long-term investment portfolio. However, investors should not put all their money into a single index. Diversification and periodic portfolio rebalancing can help reduce risk.
DJIA Price Prediction FAQ
The current price of the DJIA is $51 808.0 as of 27.09.2026.
According to expert forecasts, the DJIA is expected to trade between $54,600 and $66,100 by the end of 2026. In the long term, the index is projected to maintain a steady uptrend with periodic corrections.
Forecasts vary considerably. WalletInvestor sees the index rising to $55,383.92, CoinPriceForecast to $59,185, while LongForecast projects an increase to $70,709.
Forecasts for 2030 vary widely. WalletInvestor expects the index to reach $71,187 by December, CoinPriceForecast sees it rising to $81,542, while LongForecast projects around $101,609 by September.
The index is calculated as the average stock price of the 30 largest US companies, adjusted by the Dow divisor, which considers splits and changes in the index's constituents.
The Dow Jones may be suitable for long-term investing. The index is well diversified and has historically risen over time. However, periodic corrections are possible and may provide opportunities to build up long positions.
The DJIA may decline even if the long-term uptrend remains intact. After a strong rally, the index may enter a correction or consolidation phase. However, technical analysis does not currently indicate a significant decline.
The DJIA has gained about 12% compared to the previous year-end closing price. In August, the index reached a new all-time high of $54,744.33.
The DJIA is currently trading near all-time highs, so a correction is possible. Long-term investors may buy at current levels, but waiting for a correction could provide a more favorable entry point.
Price chart of YM in real time mode
The content of this article reflects the author’s opinion and does not necessarily reflect the official position of LiteFinance broker. The material published on this page is provided for informational purposes only and should not be considered as the provision of investment advice for the purposes of Directive 2014/65/EU.
According to copyright law, this article is considered intellectual property, which includes a prohibition on copying and distributing it without consent.