Litecoin (LTC) is one of the oldest and most stable cryptocurrencies, created as a faster alternative to Bitcoin. Due to its low fees and high transaction speed, LTC is widely used for payments and transfers.
Investors see the currency as "digital silver" since it can retain its value over the long term. This article examines the fundamental factors and provides a technical analysis, along with forecasts for LTC, to explore the token's prospects.
The article covers the following subjects:
- Major Takeaways
- Litecoin (LTC) Real-Time Market Status
- Weekly Elliott Wave Litecoin Analysis as of 14.09.2026
- Litecoin Price Forecast for 2026 Based on Technical Analysis
- Analysts' LTC Price Projections for 2027
- Analysts' LTC Price Projections for 2028
- Analysts' LTC Price Projections for 2029
- Analysts' LTC Price Projections for 2030
- Analysts' LTC Price Projections up to 2050
- LTC (Litecoin) Market Sentiment on Social Media
- LTC Price History
- LTC Price Fundamental Analysis
- More Facts About LTC
- How We Make Forecasts
- Conclusion: Is LTC a Good Investment?
- Litecoin Price Prediction FAQs
Major Takeaways
The Litecoin (LTC) price is trading at $71.31 as of 26.09.2026.
The highest Litecoin (LTC) price of $401.47 was reached on 09.05.2021, while the all-time low of $22.35 was recorded on 07.12.2018.
Litecoin was introduced in 2011 as an alternative to Bitcoin, aiming to improve transaction speed.
The maximum supply of LTC is capped at 84 million coins, making it a scarce asset. This limitation positively affects the token rate in the long term.
The block reward is halved approximately every four years, with the most recent reduction in August 2023.
LTC is supported by major cryptocurrency platforms and is utilized as a means of payment in various companies.
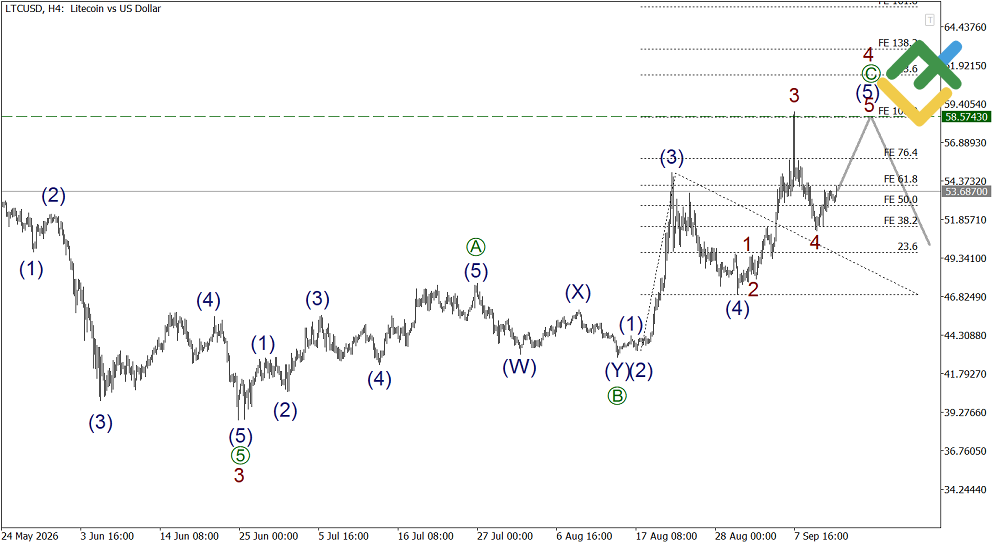
LTCUSD: Based on the Elliott wave analysis, the LTCUSD pair may increase in the final impulse wave this week. Consider long trades at the current level, placing a take-profit order at 58.57.
Litecoin (LTC) Real-Time Market Status
The current Litecoin (LTC) price is $71.31 as of 26.09.2026.
When analyzing Litecoin, it is essential to consider market capitalization and trading volume. The volume-to-market-cap ratio measures trader activity. The price change over the last year helps determine the long-term trend, while an all-time high serves as a crucial benchmark for investors.
Metric | Value |
Market cap | $3.36 billion |
24-hour trading volume | $259.38 million |
Volume-to-market-cap ratio | 0.0799 |
All-time high | $401.47 |
Circulating supply | 77.35 million LTC |
Maximum supply | 84 million LTC |
Weekly Elliott Wave Litecoin Analysis as of 14.09.2026
The LTCUSD is forming a global double zigzag (W)-(X)-(Y). Wave (X) is unfolding as a triple zigzag, with sub-waves W-X-Y-XX ended. Motive wave Z is likely in progress as a double zigzag [W]-[X]-[Y], with wave [W] developing as a standard zigzag. Wave [W] requires wave (C) to finish. Notably, sub-wave 4 of (C) is underway.
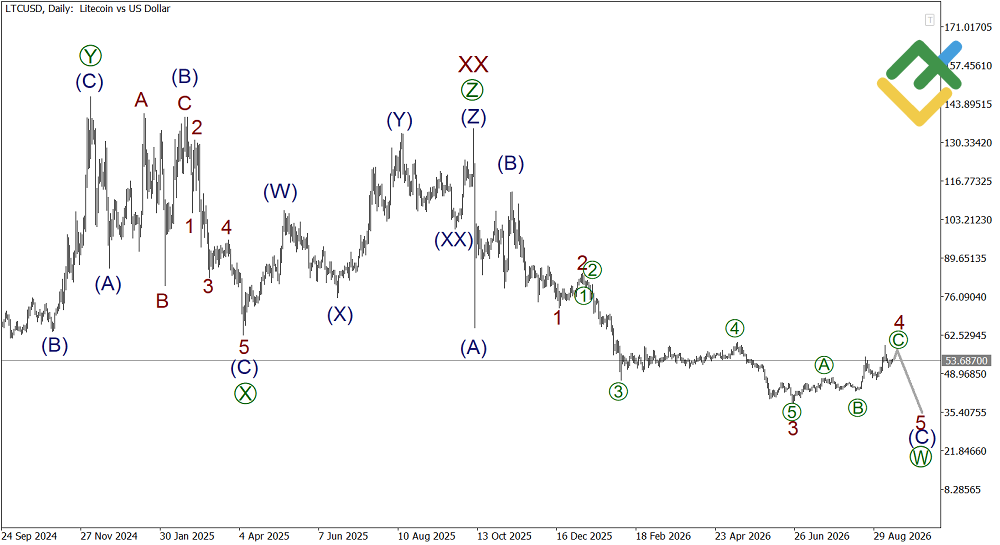
Impulse [A] and correction [B] of 4 have developed as a double zigzag. The price is rising in wave [C]. Four sub-waves have been completed. As a result, the LTC price may surge to 58.57 in sub-wave (5). At this mark, impulse (5) will equal 100% of wave (3), according to the Fibonacci levels.
Weekly LTCUSD Trading Plan:
Buy 53.68, TP 58.57
LTCUSD Elliott wave analysis is presented by an independent analyst, Roman Onegin.
Litecoin Price Forecast for 2026 Based on Technical Analysis
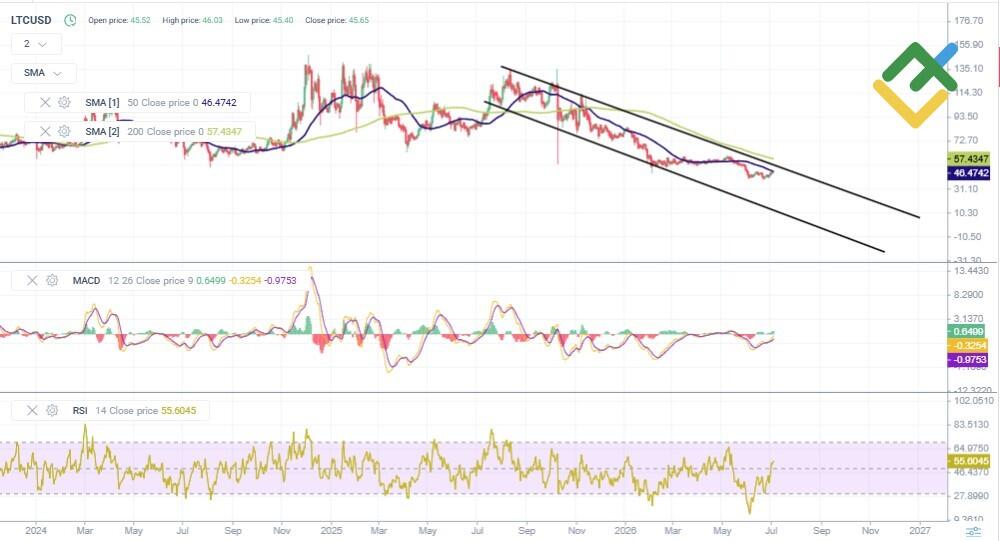
LTC/USD continues to trade within a downward channel, reflecting long-term selling pressure. The price is currently attempting to recover from its recent low, but the 50-period Simple Moving Average (SMA50) remains below the 200-period Simple Moving Average (SMA200), confirming that the medium-term trend is still bearish.
The MACD indicator is turning upward, indicating strengthening short-term buying momentum. Meanwhile, the RSI is holding near 56, suggesting that the price is continuing to recover from previously oversold conditions.
The nearest resistance lies in the $50.00–$52.00 area, while support is located at $44.00–$45.00. The base scenario assumes that the price will continue trading within the channel, with possible pullbacks toward the lower boundary and short-term attempts to break above resistance. If the price closes above the upper boundary of the channel, a stronger recovery could follow.
Below are the projected Litecoin (LTCUSD) price levels for the next 12 months.
Month | Low, $ | Average Price, $ | High, $ |
July 2026 | 44.00 | 46.00 | 50.00 |
August 2026 | 45.00 | 47.00 | 51.00 |
September 2026 | 44.50 | 46.50 | 50.50 |
October 2026 | 44.00 | 46.00 | 49.50 |
November 2026 | 44.50 | 46.50 | 50.00 |
December 2026 | 45.00 | 47.00 | 51.00 |
January 2027 | 44.50 | 46.50 | 50.50 |
February 2027 | 44.00 | 46.00 | 49.50 |
March 2027 | 44.50 | 46.50 | 50.00 |
April 2027 | 45.00 | 47.00 | 51.00 |
May 2027 | 44.50 | 46.50 | 50.50 |
June 2027 | 44.00 | 46.00 | 50.00 |
Long-Term Trading Plan for LTCUSD for 2026
The long-term trading strategy for LTC/USD is based on trading within the current downward channel and reacting to short-term price movements. Long positions may be considered as the price approaches the lower boundary of the channel. It may be advisable to take partial profits near the intermediate resistance zone at $50.00–$52.00 and gradually increase position size as bullish reversal signals are confirmed. Short positions may be considered if the price reaches the upper boundary of the channel or shows signs of weakness during pullbacks.
Using stop-loss orders and managing position size remain essential for controlling risk during periods of heightened market volatility.
Traders should also be prepared for a breakout from the channel. A close above the upper boundary could signal a stronger recovery, while a break below the lower boundary would strengthen the bearish outlook. This approach combines trading on pullbacks with disciplined risk management and gradually increasing positions as the trend develops, without reacting to every short-term price movement.
Analysts' LTC Price Projections for 2026
Analysts remain divided on Litecoin's outlook for 2026. While some platforms expect the price to decline, others forecast moderate growth. The price is likely to be influenced by ongoing network developments and overall volatility in the cryptocurrency market.
CoinCodex
Price range (USD): 33.87–45.49.
According to CoinCodex, LTC is expected to trend lower throughout the year, with occasional short-term rebounds. The average price is projected to be around $44.04 in July and then gradually decline to $37.31 by November. A modest recovery to approximately $38.73 is expected in December. LTC could reach its annual high of $45.49 in September.
Month | Low, $ | Average Price, $ | High, $ |
July | 43.21 | 44.04 | 45.25 |
August | 43.40 | 44.59 | 45.33 |
September | 40.53 | 42.43 | 45.49 |
October | 33.87 | 37.58 | 40.69 |
November | 36.38 | 37.31 | 38.14 |
December | 36.95 | 38.73 | 40.71 |
DigitalCoinPrice
Price range (USD): 46.84–56.11.
According to DigitalCoinPrice, LTC is expected to remain highly volatile in the second half of 2026. The average price is projected to reach $45.82 in July before rising sharply to around $49.64 in August. October is expected to be the most volatile month, with the price trading within a wide range of $46.96–$56.11. By the end of the year, LTC is forecast to stabilize at around $50.00.
Month | Low, $ | Average Price, $ | High, $ |
July | 45.80 | 45.82 | 45.84 |
August | 46.96 | 49.64 | 52.31 |
September | 47.37 | 47.37 | 47.37 |
October | 46.96 | 51.53 | 56.11 |
November | 50.12 | 50.55 | 50.98 |
December | 46.84 | 48.75 | 50.66 |
Changelly
Price range (USD): 42.16–57.72.
Changelly analysts expect LTC to strengthen gradually toward the end of 2026. This outlook is supported by a steady month-by-month increase in the average price. According to the platform's forecast, the average price is projected to rise from $43.17 in July to $51.99 in December. Short-term corrections remain possible, but the overall trend points to continued growth, supported by market demand and ongoing network development.
Month | Low, $ | Average Price, $ | High, $ |
July | 42.16 | 43.17 | 44.17 |
August | 43.38 | 43.59 | 43.79 |
September | 46.60 | 48.19 | 49.77 |
October | 48.20 | 50.33 | 52.46 |
November | 43.65 | 48.20 | 52.75 |
December | 46.26 | 51.99 | 57.72 |
Analysts' LTC Price Projections for 2027
Analysts have mixed expectations for LTC/USD in 2027. While some platforms forecast higher prices, others expect the cryptocurrency to decline or move sideways. Litecoin's performance is likely to depend on demand for altcoins, network activity, and overall sentiment in the cryptocurrency market.
Note: The price ranges reflect the asset's expected volatility throughout the year. Lows and highs may not be shown in the summary tables.
CoinCodex
Price range (USD): 38.97–47.42.
According to CoinCodex, LTC/USD is expected to trade between $38.97 and $47.42 in 2027. The average price is projected to reach $43.72 in the first quarter and then gradually decline to $42.42 in the third quarter. A recovery toward $45.69 is expected by the end of the year.
Quarter | Low, $ | Average Price, $ | High, $ |
Q1 | 40.52 | 43.72 | 47.17 |
Q2 | 40.37 | 42.48 | 46.38 |
Q3 | 38.97 | 42.42 | 46.42 |
Q4 | 42.05 | 45.69 | 47.42 |
DigitalCoinPrice
Price range (USD): 51.00–70.44.
According to DigitalCoinPrice, LTC/USD is expected to continue rising in 2027. The average price is projected to reach $55.43 in the first quarter and increase to $66.26 in the third quarter. Despite a brief correction, the annual high is expected to be reached by the end of the year at $70.44.
Quarter | Low, $ | Average Price, $ | High, $ |
Q1 | 51.00 | 55.43 | 62.35 |
Q2 | 61.61 | 65.30 | 67.92 |
Q3 | 62.82 | 66.26 | 68.76 |
Q4 | 62.25 | 65.92 | 70.44 |
Changelly
Price range (USD): 38.23–46.61.
Changelly analysts expect LTC/USD to show mixed performance throughout 2027. According to the forecast, the quarterly lows may decline steadily, pointing to continued downward pressure. Even so, the price could still reach a high of $46.61 by the end of the year.
Quarter | Low, $ | Average Price, $ | High, $ |
Q1 | 42.09 | 43.90 | 44.52 |
Q2 | 40.81 | 43.55 | 45.22 |
Q3 | 39.52 | 43.20 | 45.92 |
Q4 | 38.23 | 42.85 | 46.61 |
Analysts' LTC Price Projections for 2028
Most forecasts point to a decline in LTC/USD throughout 2028, although some analysts expect the price to recover later in the year. Litecoin's performance is likely to be influenced by market liquidity, investor interest in established altcoins, and shifts in overall risk appetite.
CoinCodex
Price range (USD): 26.13–46.72.
According to CoinCodex, LTC/USD is expected to trend lower throughout 2028. The average price is projected to reach $41.93 in the first quarter before declining to $37.85 in the third quarter. The weakest period is expected in the fourth quarter, when the price could fall to a low of $26.13.
Quarter | Low, $ | Average Price, $ | High, $ |
Q1 | 37.72 | 41.93 | 46.72 |
Q2 | 36.95 | 38.61 | 41.14 |
Q3 | 33.54 | 37.85 | 40.52 |
Q4 | 26.13 | 29.87 | 34.05 |
DigitalCoinPrice
Price range (USD): 43.21–63.59.
According to DigitalCoinPrice, LTC/USD is expected to weaken after a strong start to 2028. The average price is projected to reach $57.37 in the first quarter and then decline to $47.02 in the second quarter. The lowest level is expected in the third quarter, when the price could fall to $43.21. A partial recovery is forecast by the end of the year.
Quarter | Low, $ | Average Price, $ | High, $ |
Q1 | 53.82 | 57.37 | 63.59 |
Q2 | 44.30 | 47.02 | 50.65 |
Q3 | 43.21 | 46.54 | 48.74 |
Q4 | 46.77 | 49.80 | 53.34 |
Changelly
Price range (USD): 25.56–46.51.
Changelly analysts forecast a steady decline in LTC/USD throughout 2028. The average price is projected to reach $41.71 in the first quarter before falling to $38.51 in the third quarter. The lowest level is expected in the fourth quarter, when the price could decline to $25.56.
Quarter | Low, $ | Average Price, $ | High, $ |
Q1 | 35.06 | 41.71 | 46.51 |
Q2 | 31.90 | 40.11 | 46.34 |
Q3 | 28.73 | 38.51 | 46.17 |
Q4 | 25.56 | 36.91 | 45.99 |
Analysts' LTC Price Projections for 2029
Analysts have mixed expectations for LTC/USD in 2029. While some forecasts point to a recovery, others maintain a more cautious outlook. Litecoin's performance is likely to be influenced by demand for altcoins, market liquidity, and investor sentiment following the latest cryptocurrency market cycle.
CoinCodex
Price range (USD): 25.52–29.11.
According to CoinCodex, LTC/USD is expected to recover gradually throughout 2029. The average price is projected to reach $26.96 in the first quarter and then gradually rise to $28.04 in the fourth quarter. The annual high is projected at $29.11 in the fourth quarter.
Quarter | Low, $ | Average Price, $ | High, $ |
Q1 | 25.52 | 26.96 | 27.85 |
Q2 | 26.73 | 27.37 | 28.73 |
Q3 | 26.09 | 27.14 | 27.94 |
Q4 | 27.00 | 28.04 | 29.11 |
DigitalCoinPrice
Price range (USD): 42.29–54.79.
According to DigitalCoinPrice, LTC/USD is expected to go through a downward phase in 2029 before beginning to recover. After reaching a high of $54.79 in the first quarter, the price is projected to decline gradually. The lowest price is expected in the third quarter at $43.41. By the end of the year, LTC could partially recover to $45.11–$49.47.
Quarter | Low, $ | Average Price, $ | High, $ |
Q1 | 49.95 | 53.07 | 54.79 |
Q2 | 44.50 | 48.55 | 53.25 |
Q3 | 42.29 | 43.41 | 44.30 |
Q4 | 45.11 | 47.38 | 49.47 |
Changelly
Price range (USD): 24.96–44.43.
Changelly analysts forecast a bearish trend for LTC/USD throughout 2029. In the first quarter, the price is expected to trade within a broad range of $25.41–$44.43. Afterward, downward pressure may increase. The lowest price, $24.96, is projected for the fourth quarter.
Quarter | Low, $ | Average Price, $ | High, $ |
Q1 | 25.41 | 34.78 | 44.43 |
Q2 | 25.26 | 32.38 | 40.08 |
Q3 | 25.11 | 29.99 | 35.74 |
Q4 | 24.96 | 27.59 | 31.39 |
Analysts' LTC Price Projections for 2030
Analysts remain divided on the outlook for LTC/USD in 2030. While some forecasts point to higher prices, others continue to expect further declines. Litecoin's performance is likely to depend on long-term demand, overall cryptocurrency market conditions, and investor interest in payment-focused cryptocurrencies.
CoinCodex
Price range (USD): 20.85–28.29.
According to CoinCodex, LTC/USD is expected to decline before beginning to recover in 2030. The price is projected to fall to around $21.90 in the first half of the year before rising again. LTC could reach the upper end of the forecast range at $28.29 in the fourth quarter.
Quarter | Low, $ | Average Price, $ | High, $ |
Q1 | 21.25 | 24.84 | 26.93 |
Q2 | 20.85 | 21.90 | 22.91 |
Q3 | 22.28 | 23.15 | 24.75 |
Q4 | 24.45 | 26.17 | 28.29 |
DigitalCoinPrice
Price range (USD): 47.63–64.80.
According to DigitalCoinPrice, LTC/USD is expected to remain in an uptrend throughout 2030. The price is projected to trade around $50.89 in the first quarter, with growth expected to accelerate in the second half of the year. The annual high is forecast for the fourth quarter at $64.80.
Quarter | Low, $ | Average Price, $ | High, $ |
Q1 | 47.63 | 50.89 | 53.32 |
Q2 | 52.07 | 53.02 | 54.05 |
Q3 | 54.26 | 58.99 | 63.17 |
Q4 | 60.66 | 63.10 | 64.80 |
Changelly
Price range (USD): 20.34–28.44.
According to Changelly analysts, LTC/USD is expected to remain in a downtrend throughout 2030. The average price is projected to reach $26.25 in the first quarter, then come under stronger downward pressure and continue to decline. The lowest price, $20.34, is forecast for the fourth quarter.
Quarter | Low, $ | Average Price, $ | High, $ |
Q1 | 23.80 | 26.25 | 28.44 |
Q2 | 22.65 | 25.43 | 28.26 |
Q3 | 21.50 | 24.61 | 28.08 |
Q4 | 20.34 | 23.79 | 27.90 |
Analysts' LTC Price Projections up to 2050
Long-term LTC/USD forecasts remain mixed, as the market's future performance will depend on the pace of cryptocurrency adoption, ongoing developments to the Litecoin network, and broader trends in the digital asset market. Despite differing outlooks, most analysts believe Litecoin retains long-term growth potential.
CoinCodex takes a moderately bullish view. According to its forecasts, LTC/USD could reach $74.44 by 2040 and $228.48 by 2050, which indicates gradual long-term appreciation.
DigitalCoinPrice is more optimistic. The platform projects that LTC/USD could rise to $127.87 by 2033, $200.07 by 2040, and $372.13 by 2050.
Changelly offers the most conservative long-term outlook among the platforms reviewed. Its analysts expect LTC/USD to reach $32.00 by 2033, $73.85 by 2040, and $230.29 by 2050.
Year | CoinCodex, $ | DigitalCoinPrice, $ | Changelly, $ |
2033 | – | 127.87 | 32.00 |
2040 | 74.44 | 200.07 | 73.85 |
2050 | 228.48 | 372.13 | 230.29 |
LTC (Litecoin) Market Sentiment on Social Media
Social media sentiment often influences short-term LTC/USD price movements by shaping trader expectations and intensifying market reactions around key support and resistance levels. As the price approaches these technical areas, market sentiment can accelerate price action and increase volatility.
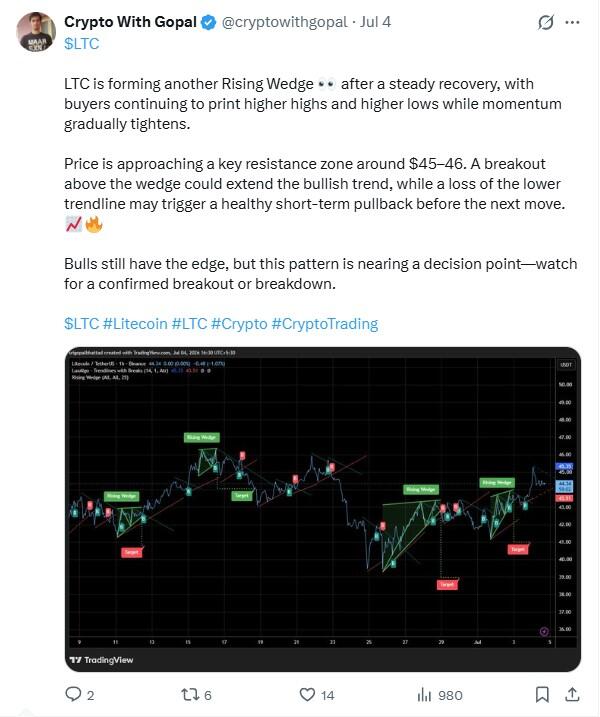
For example, X (formerly Twitter) user @cryptowithgopal points to the formation of a Rising Wedge pattern and identifies resistance in the $45.00–$46.00 area. According to the analyst, a breakout above this level could resume the uptrend, while a break below the wedge's lower trendline could lead to a short-term pullback.
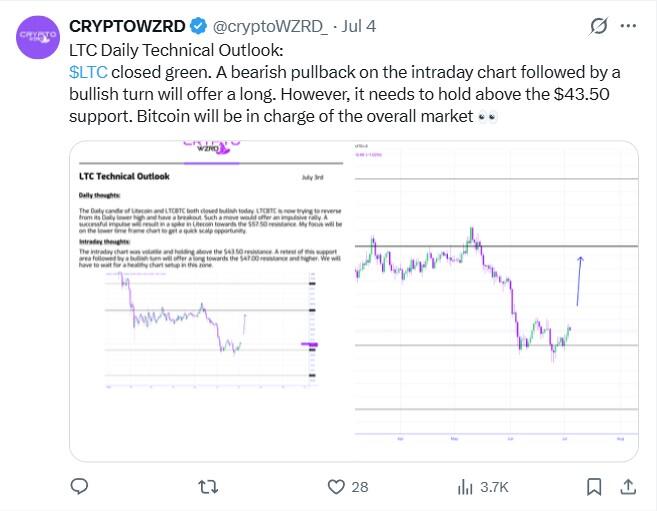
@cryptoWZRD also maintains a bullish outlook as long as support around $43.50 holds, suggesting that long positions could be considered if the price begins to recover over the coming days.
Overall, social media sentiment remains predominantly bullish. Market participants expect the recovery to continue despite the possibility of short-term pullbacks. They are closely monitoring key price levels and watching for signs of a bullish reversal.
LTC Price History
Litecoin reached the highest price of $401.47 on 09.05.2021.
The lowest price of Litecoin (LTC) was recorded on 07.12.2018 when the token declined to $22.35.
The chart below shows the LTCUSD pair performance over the last ten years. Besides, to make our forecasts as accurate as possible, it is essential to evaluate historical data.
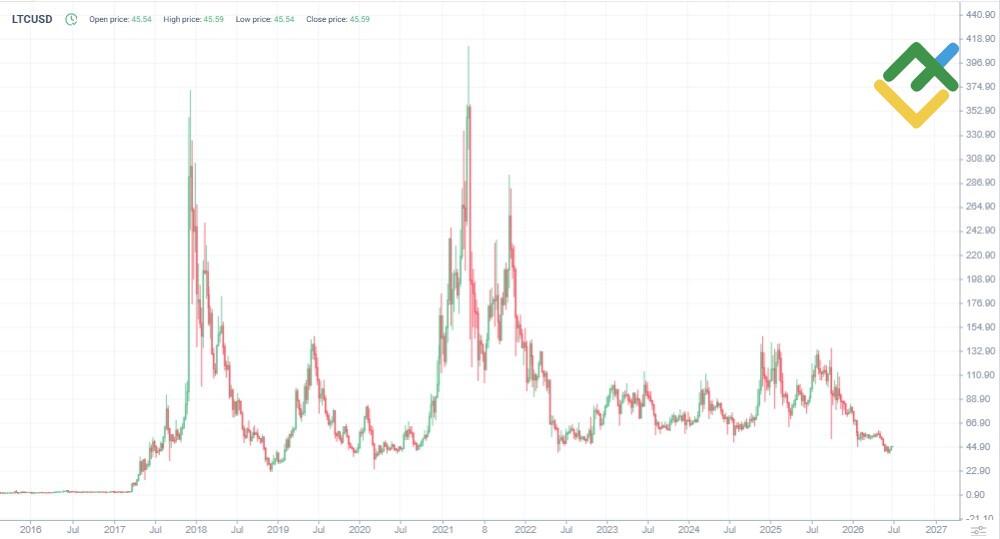
Since its launch in 2011, Litecoin has experienced several major ups and downs.
2013. Litecoin surged to $48.00 as early interest in cryptocurrencies grew.
2017. The price jumped to $375.00 during the cryptocurrency bull market, driven by the ICO boom and growing investor interest.
2018. LTC entered a bear market, falling to $25.00 amid a broad sell-off across the cryptocurrency market.
2019. The price recovered to $140.00 as investors anticipated the Litecoin halving.
2021. Litecoin reached its all-time high of $412.00 during the crypto bull market, supported by strong demand for digital assets.
2022. The price dropped to $45.00 following the liquidity crisis and the collapse of the Terra (LUNA) ecosystem.
2023. LTC recovered to $110.00 after another halving and improving market conditions.
2025. Litecoin fell by 27% after the Trump administration introduced new tariffs, triggering a broad sell-off in risk assets. During the second half of the year, LTC lost momentum after falling below its 50-day and 200-day Simple Moving Averages (SMAs). As investors took profits on long positions, the price declined toward the $70.00–$80.00 support area.
2026. At the beginning of the year, Litecoin was trading at around $76.86. By early February, the price had fallen to $45.09. From mid-February to early April, LTC traded within the $50.18–$59.25 range amid continued uncertainty in the cryptocurrency market. By early July, the price remained in a downward channel between $52.75 and $39.29.
LTC Price Fundamental Analysis
Fundamental analysis helps assess the long-term prospects of Litecoin (LTC), taking into account market, technological, and economic factors.
What Factors Affect the LTC Price?
General crypto market state. The rise or fall of Bitcoin affects altcoins like LTC.
Media sentiment. Positive or negative news shapes investor attitudes.
Geopolitics. Sanctions, economic crises, and regulatory measures may affect demand.
Integrations. LTC integrations with payment systems and companies increase the value of the asset.
Halvings. Lowering the reward for mining reduces the supply of coins.
User activity. The increase in transactions and unique addresses indicates the demand for the network.
Trading volumes. High liquidity confirms the interest in LTC.
Macroeconomic factors. Inflation, interest rates, and central bank policies can affect the cryptocurrency market.
More Facts About LTC
Litecoin is one of the earliest altcoins, launched in 2011 by former Google engineer Charlie Lee. Designed to be an enhanced version of Bitcoin, LTC provides quicker transaction speeds and lower fees.
Litecoin includes the following features:
The block generation time is 2.5 minutes, four times faster than Bitcoin.
The maximum supply is 84 million coins, four times more than Bitcoin.
The hashing algorithm used is Scrypt, optimized for standard processors and graphics cards.
Litecoin is widely utilized for fast and inexpensive payments. With its high transaction speed and low fees, LTC is popular in online commerce, payment services, and international transfers. Additionally, it is often used to test new solutions within the blockchain industry.
Advantages and Disadvantages of Investing in LTC
Litecoin is one of the most popular cryptocurrencies to invest in, thanks to its stable network, high transaction speed, and low fees. However, like any digital asset, LTC carries both potential benefits and risks.
Advantages
Fast transactions. Blocks are created in just 2.5 minutes, making transfers faster than Bitcoin.
Low fees make LTC convenient for micropayments and international transfers.
Wide adoption. The token is integrated into many exchanges, wallets, and payment services.
Decentralization. The network operates without centralized management, which increases its resilience.
Stability and proven technology. Litecoin has been operating since 2011 without major disruptions.
High liquidity. LTC is actively traded on most crypto exchanges.
Disadvantages
Competition with Bitcoin and other altcoins. Litecoin is inferior to BTC in popularity and to Ethereum in functionality.
Limited usage. The token is mainly used for payments and does not support complex smart contracts.
Market cycles impact. LTC is subject to high volatility, like other cryptocurrencies.
Lacking mass use in the commercial sector. Not all companies accept LTC as a means of payment.
Regulatory risks. Possible restrictions by governments may affect the future of LTC.
How We Make Forecasts
Our forecasts are based on a comprehensive analysis covering short-, medium-, and long-term outlooks. We factor in technical, fundamental, and market factors to form a balanced prediction.
Short-term forecasts:
Technical analysis: support and resistance levels, the RSI, MACD indicators, volumes, and volatility.
Sentiment analysis: monitoring of social networks, LTC mentions in mass media, and media sentiment.
News and events: the impact of network updates and crypto market movements.
Medium-term forecasts:
Fundamental analysis: network activity, payment integrations.
Market conditions: demand for LTC, crypto market performance.
Historical patterns: analysis of price behavior in similar cycles.
Long-term forecasts:
Studying long-term trends.
Global adoption: the growing popularity of LTC in the commercial sector.
Macroeconomics: the impact of the global economy on the crypto market.
Conclusion: Is LTC a Good Investment?
Litecoin remains one of the most stable and time-tested altcoins with a clear market position. For a long-term portfolio, it can serve as a good diversification instrument with moderate growth potential, especially as cryptocurrencies become widely adopted as a means of payment.
However, LTC is exposed to high volatility and systemic market risks. Investing in it requires careful analysis and an understanding of its technological principles. Compared to more experimental projects, Litecoin offers relatively stable performance.
Litecoin Price Prediction FAQs
The current LTC price is $71.31 as of 26.09.2026.
According to current forecasts, Litecoin could trade between $38.23 and $70.44 in 2027. Some analysts expect strong growth, while others foresee sideways trading or moderate declines during certain quarters.
Forecasts for 2028 suggest that Litecoin could trade in the $25.56–$63.59 range. Most analysts expect the price to weaken during the first half of the year, although some scenarios point to market stabilization and a gradual recovery by year-end.
In 2030, Litecoin is expected to trade between $20.34 and $64.80. Long-term forecasts remain mixed: some analysts expect the downtrend to continue, while others anticipate a strong recovery and higher prices in the second half of the year.
According to long-term projections, Litecoin could trade between $73.85 and $200.07 by 2040. Most forecasts point to further growth, supported by the expansion of the cryptocurrency market, increasing investor interest, and wider adoption of digital assets.
Litecoin remains in demand due to low fees and fast transaction processing. However, its long-term future hinges on network development, competition from other cryptocurrencies, support from institutional investors, and the general popularity of cryptocurrencies.
Yes, if user and institutional investor interest remain strong and the regulatory environment remains favorable, Litecoin could experience a new wave of growth and strengthen its position.
At present, this scenario appears unlikely. While long-term forecasts suggest that Litecoin still has growth potential, even the most optimistic projections remain well below the $1,000 level. As a result, reaching this level is not considered the base-case scenario.
Litecoin is attractive due to its stability, technical characteristics, and support from major investors. Its key advantages include low transaction fees, high processing speed, and network reliability. Nevertheless, the appeal of investing in LTC depends on long-term demand, regulatory developments, competition, and the overall condition of the cryptocurrency market.
Price chart of LTCUSD in real time mode

The content of this article reflects the author’s opinion and does not necessarily reflect the official position of LiteFinance broker. The material published on this page is provided for informational purposes only and should not be considered as the provision of investment advice for the purposes of Directive 2014/65/EU.
According to copyright law, this article is considered intellectual property, which includes a prohibition on copying and distributing it without consent.