
Today, I will explain how to use the Ichimoku Kinko Hyo indicator, or Ichimoku cloud (Ichi Cloud) for short, as your technical analysis method. I will cover in detail how the Ichimoku cloud system MT4 works and what the Ichimoku cloud trading system. I will also write about the best Ichimoku cloud trading strategy settings. You will learn how to read Ichimoku signals and how to trade Ichimoku cloud. And finally, I will explain the Japanese candlestick signals in the Forex Ichimoku trading system.
The article covers the following subjects:
- Major Takeaways
- What is Ichimoku Kinko Hyo: Definition and History
- Ichimoku Cloud Calculation & Formula
- Ichimoku Indicator Elements
- How to use Ichimoku Cloud in Forex trading
- Parameters and values: Ichimoku Kinko Hyo best settings
- How Ichimoku Cloud Works in Forex Trading: Signals & Strategies
- Japanese candlesticks in the Forex Ichimoku trading system
- Ichimoku trading strategy
- Conclusion and a trader opinion of Ichimoku Kinko Hyo
- How do we trade cryptocurrency with Ichimoku indicator?
- Ichimoku Cloud FAQ
Major Takeaways
Main Thesis | Insights and Key Points |
Definition | The Ichimoku cloud is a comprehensive technical analysis tool, designed primarily for medium and long-term trading, offering insights into future price actions in the Forex market. |
How Ichimoku Cloud Works | The Ichimoku cloud provides signals for potential price movements. By analyzing the cloud's color and position relative to price, traders can deduce buy or sell signals. |
How to use | The Ichimoku cloud system on MT4 aids traders in Forex technical analysis. Using the Ichimoku cloud, traders can quickly and accurately identify strong market trends. |
Parameters and values | The Ichimoku cloud's best settings are tailored for medium-term and long-term trading. It's essential to adjust default settings for optimal results, especially on shorter timeframes. |
Ichimoku trading strategy | The Ichimoku cloud strategy combines various technical tools, allowing traders to gauge future price momentum and determine potential support and resistance levels. |
What is Ichimoku Kinko Hyo: Definition and History

The Ichimoku Kinko Hyo, or Ichimoku for short, is a standard trend indicator included in the list of built-in indicators of the MetaTrader and other trading platforms.
Forex Ichimoku cloud trading system combines three technical tools in a single Ichimoku cloud strategy to trade Forex.
Ichimoku cloud is used to gauge the future price momentum and to determine the future cloud support and resistance levels to make profitable trades.
According to ichimoku history, the term Ichimoku Kinko Hyo is Asian, namely, Japanese. Ichimoku translates to “a glance”, Kinko means “equilibrium”, while Hyo is Japanese for “chart”. Altogether, Ichimoku Kinko Hyo translates to “a glance at a chart in equilibrium”.
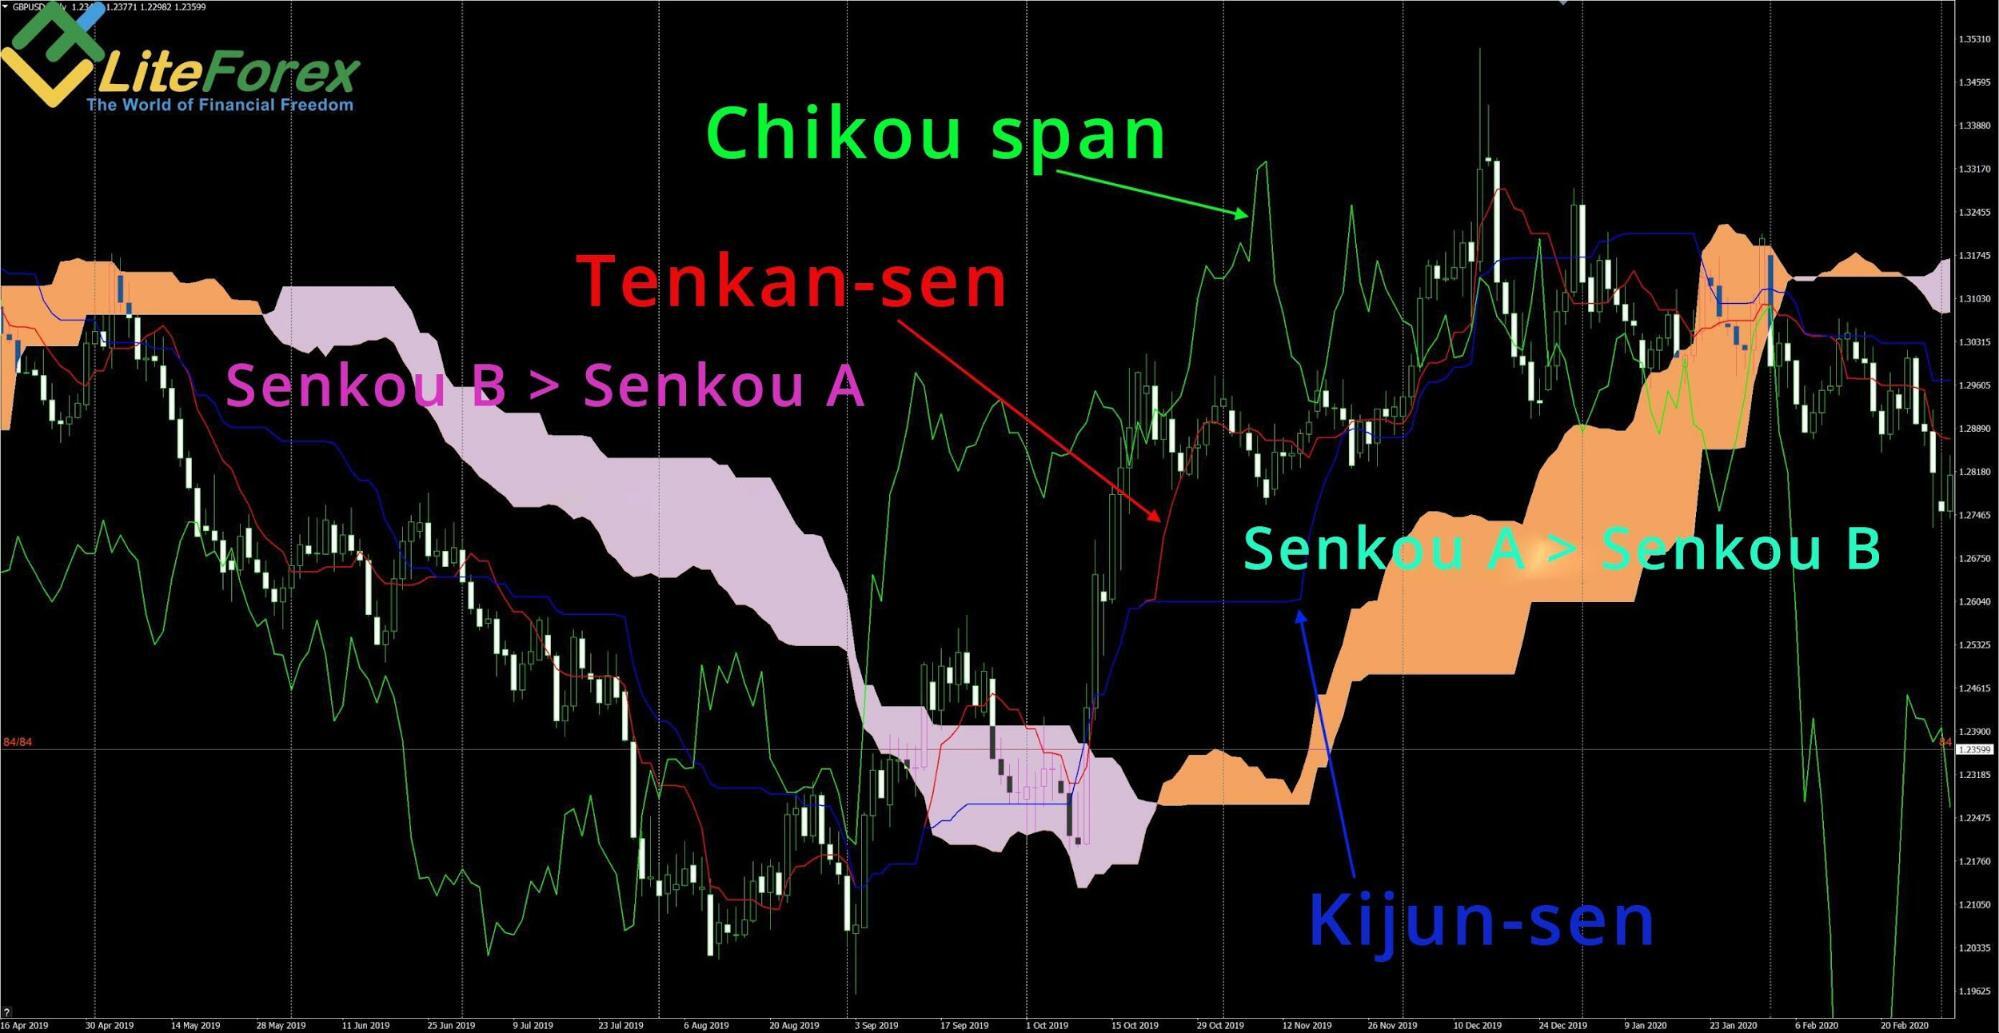
This all-in-one technical indicator Ichimoku cloud kumo is composed of five lines, which are called tenkan-sen (conversion line), kijun-sen (base line), senkou span A, senkou leading span B and chikou span.
Ichimoku is a Japanese Forex technical analysis tool, which allows traders to analyze charts faster, more accurately and identify strong trends.
Using the Ichimoku cloud system download is quite common in the Forex market, especially at the Asian trade sessions.
The Ichimoku developer, Goichi Hosoda, designed the tool to analyze the Japanese stock market. Hosoda utilized daily and weekly charts in the analysis. His disciples have been following this rule for the Ichimoku trading so far. The Ichi cloud is much less effective in shorter timeframes, because all indicator instruments and their periods were initially tied to the number of working days in a month. If you plan to use the Ichimoku cloud strategy on smaller timeframes, you will need to change its default settings and experiment with their different values for optimal results. We will talk about the Ichimoku cloud's best settings later, but now we will draw the following conclusion: the Ichimoku system is designed for medium-term and long-term trading, i.e. for analyzing daily and weekly charts.You don’t have to download Ichimoku cloud indicator MT4, as it is included into the platform indicators list.
History of Ichimoku Kinko Hyo indicator
The Ichimoku cloud technical indicator was developed by Goichi Hosoda, a Japanese journalist, in the late 1930s. The analyst published his article in the trading journals, he was used to be known as Ichimoku Sanjin.
The technical analysis method was named after his pseudonym. The original aim was to predict the trend of the Japanese major stock index Nikkei. The primary task of the Ichimoku cloud indicator is the identification of a trend that is represented as the signal line, and the secondary task is to show the support and resistance levels.
Although Ichimoku developed the tool before World War Two, he released his findings to the general public much later, in 1968. He spent 30 years perfecting the technique.
Ichimoku Cloud Calculation & Formula

The Ichimoku cloud indicator is composed of five lines, each of them is calculated according to their own formula. The timeframe determines the Ichimoku chart settings.
Kijun sen is the average value of the highest high and the lowest low for a specific time period. The default value in the ichimoku formula is 26.
Where:
Max(High, M) — the highest high for a period
Min(Low, M) — lowest low for a period
M — period.
Tenkan sen is calculated similarly, only the period is shorter (the default is 9)
Where:
(Max(High, N) — the highest high for a period
Min(Low, N) — lowest low for a period
N — is the period
Chikou Span is the current closing price projected back by the period set (default is 26)
Senkou Span A is the averaged value of Tenkan-sen (conversion line) and Kijun-sen (base line), projected ahead by the set period (26 by default).
Senkou leading Span B calculates the average of the highest high and the lowest low over the period set (default is 52), plotted 26 periods ahead.
Where:
Max(Z) — the high for the chosen period.
Min(Z) — the low for the chosen period.
Z — period.
The suggested default values for the Ichimoku system settings are offered by the indicator developer, they are designed for the stock market. So, the ichimoku cloud indicator best time frame starts from D1 and higher. You can experiment with the periods, adjusting them to the type of market you are going to analyze.
Ichimoku Indicator Elements
The Ichimoku indicator is composed of several elements: three lines and two Ichimoku clouds of different colors.
Two Ichimoku indicators are separate tools serving as moving averages. However, they are not moving averages in fact. The Ichimoku cloud indicator lines have some peculiar features, which I will cover below.
The third line is a kind of oscillator to filter trading signals.
The clouds can be rising upwards or downwards, the color indicates the trend prevailing in the market.
The below screenshot displays how the Ichimoku equilibrium chart looks using the default settings.
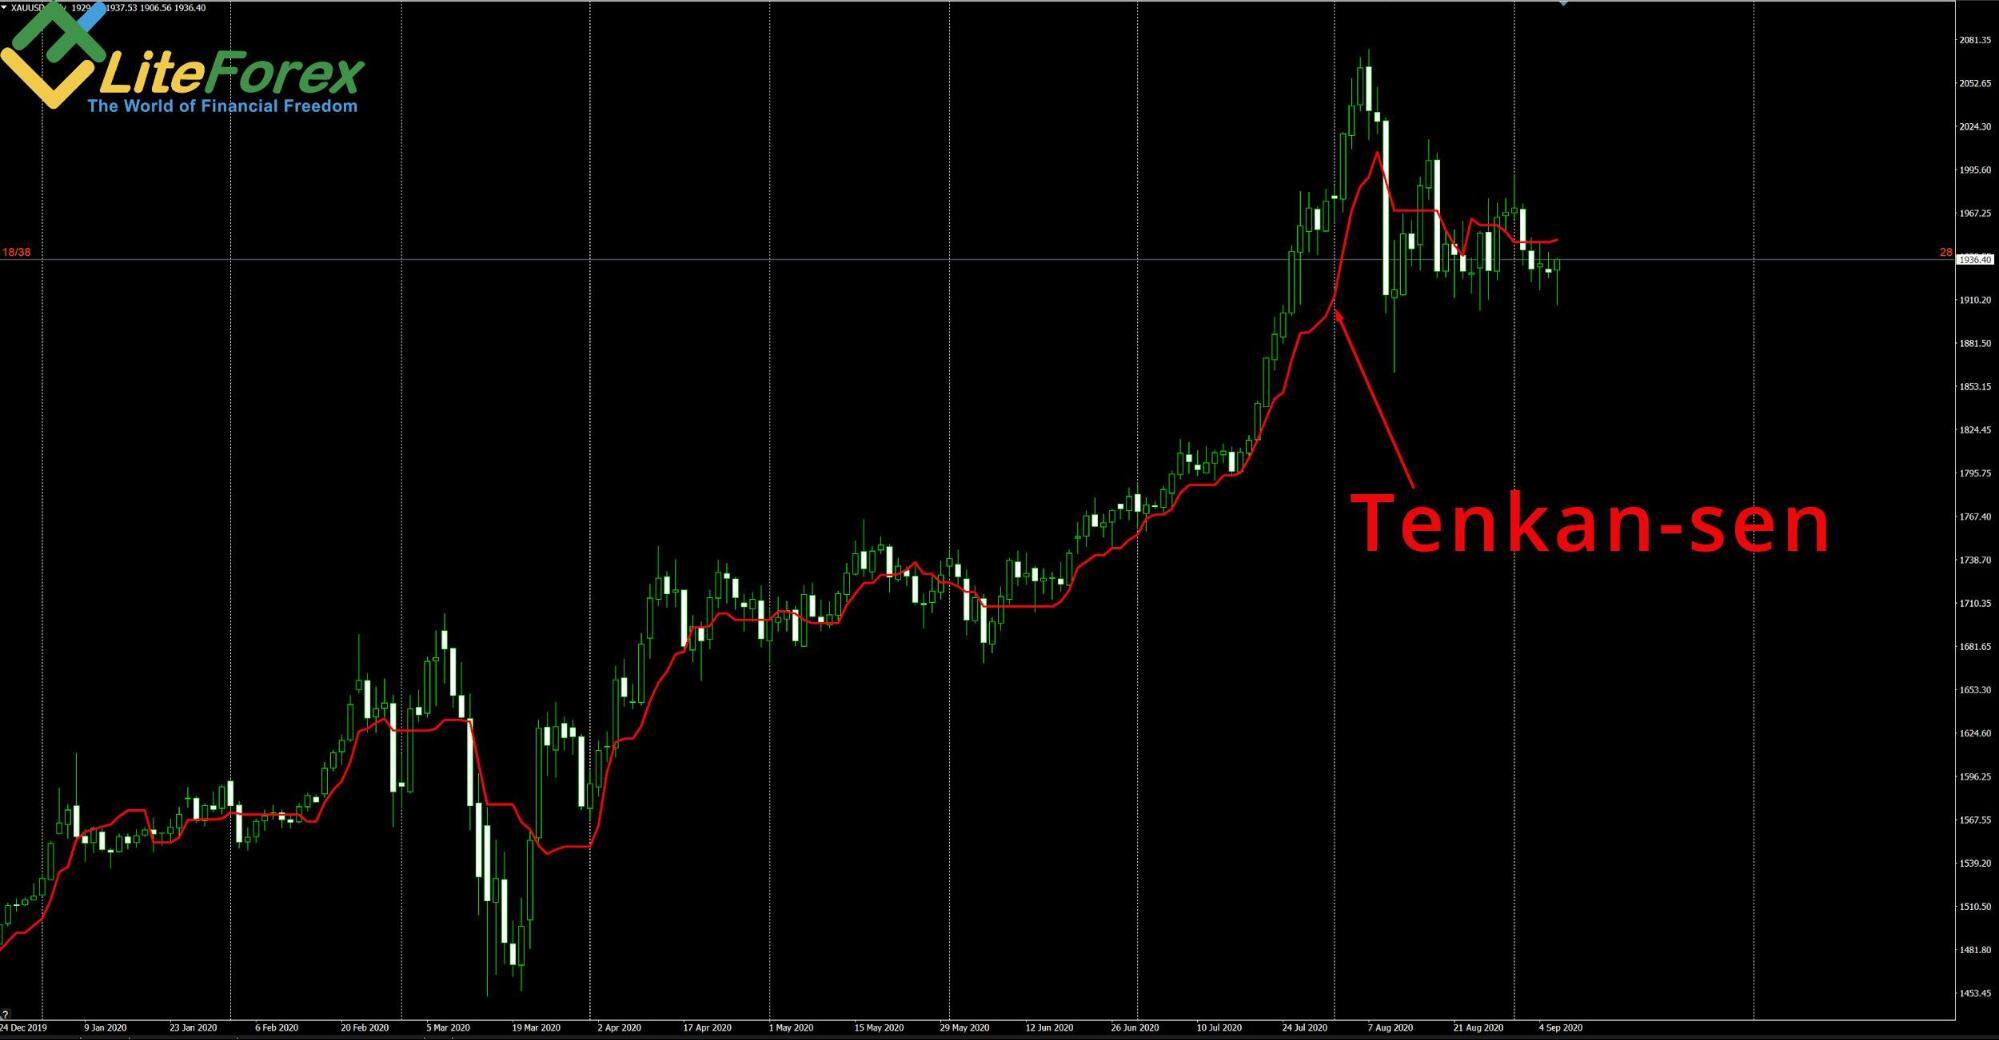
Tenkan Sen (Turning line)
Tenkan sen (the red line) averages the highest high and the lowest low for the first time period. The default value 9.
The Tenkan sen indicates the short-term trend and its changes. It also serves as support or resistance level, depending on which side the closing price approaches it from.
Traders use the Tenkan sen, or so called conversion line, signals to enter short-term trades at the very beginning of the trend reversal or immediately after the end of the correction to add up to the positions entered in the trend.
That is how conversion line looks separately from other Ichimoku tools:
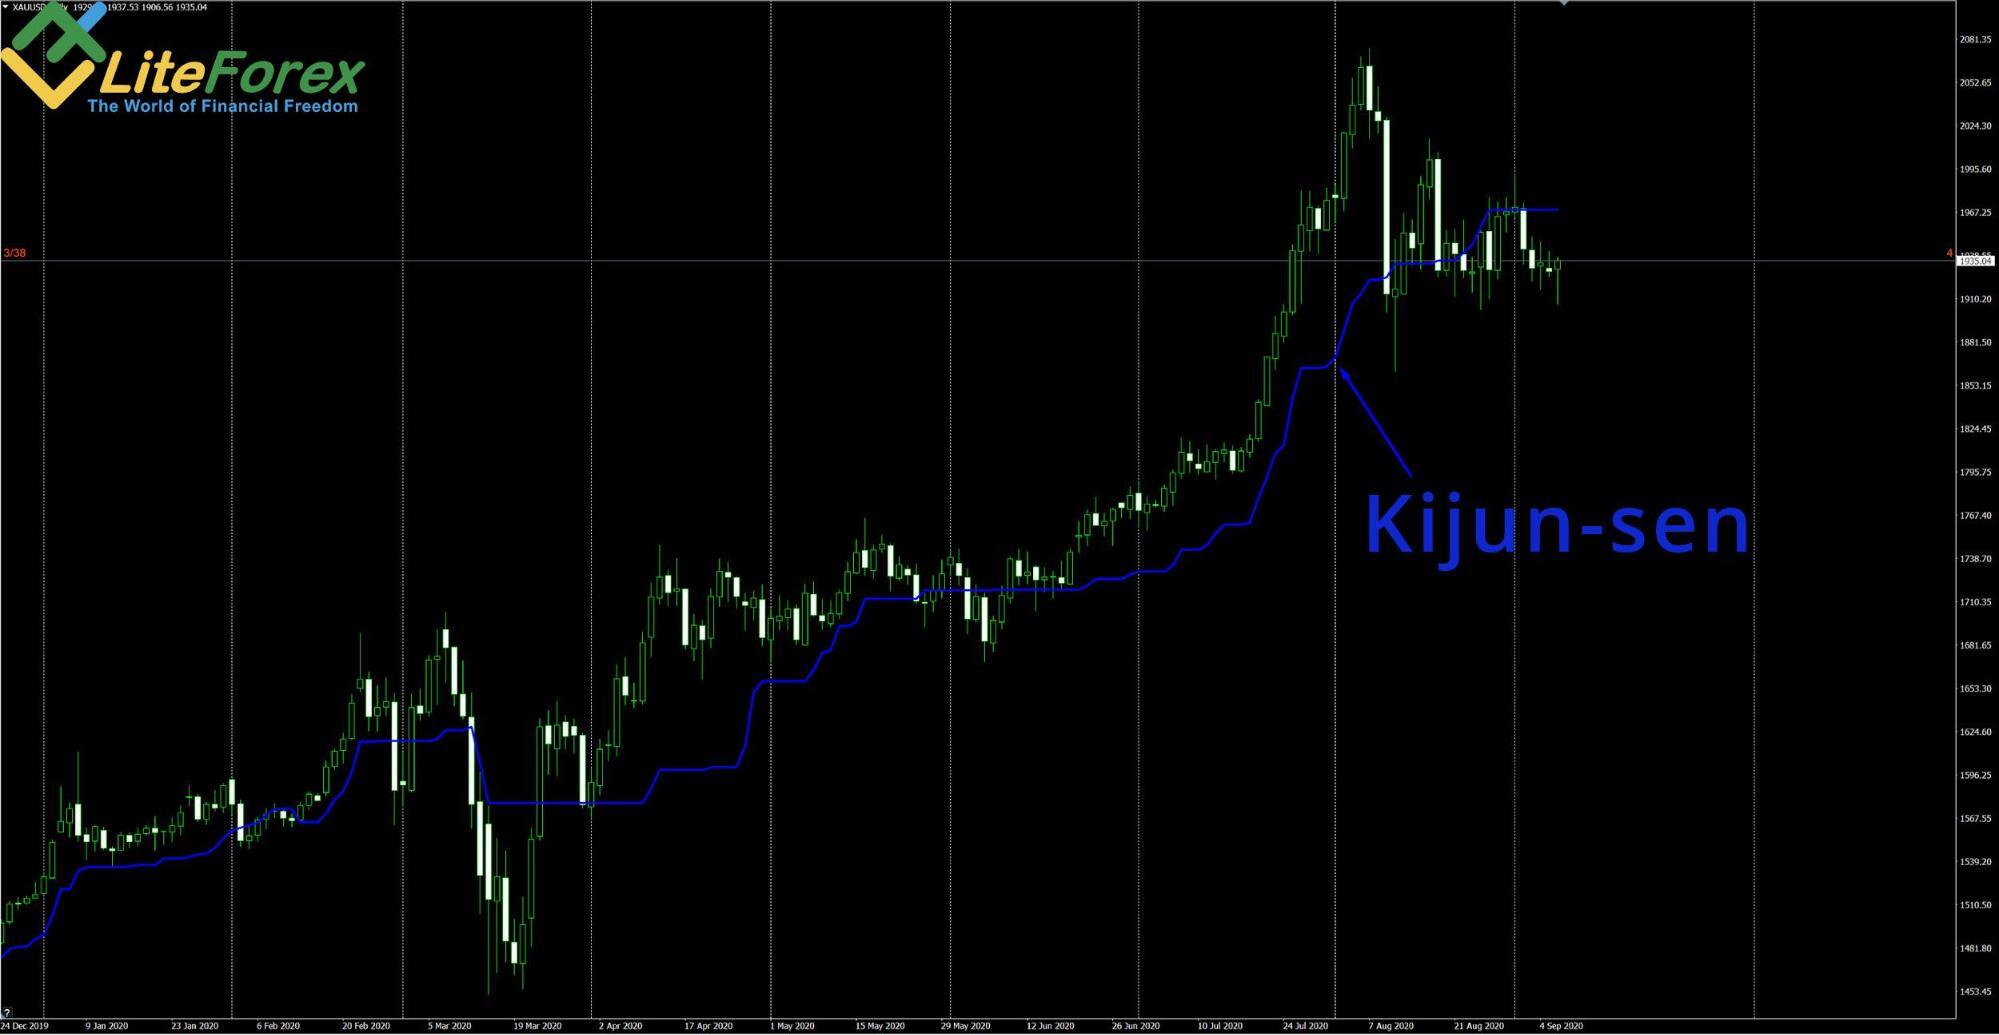
Kijun Sen (Standard line)
Kijun Sen or base line (the blue line) averages the values of the highest high and the lowest low for the second time period. The default value is 26.
The Kijun Sen indicates a more global trend, the medium-term trend. The Kijun Sen period is longer than that of Tenkan, so the price action breaks out this level much more seldom. The trend changes also more seldom.
The Kijun sen signals are stronger. Traders see this line as an independent support or resistance line. The signal is also delivered when Tenkan sen (conversion line) and Kijun sen (base line) meet.
That is how Kijun sen looks separately from other Ichimoku tools:
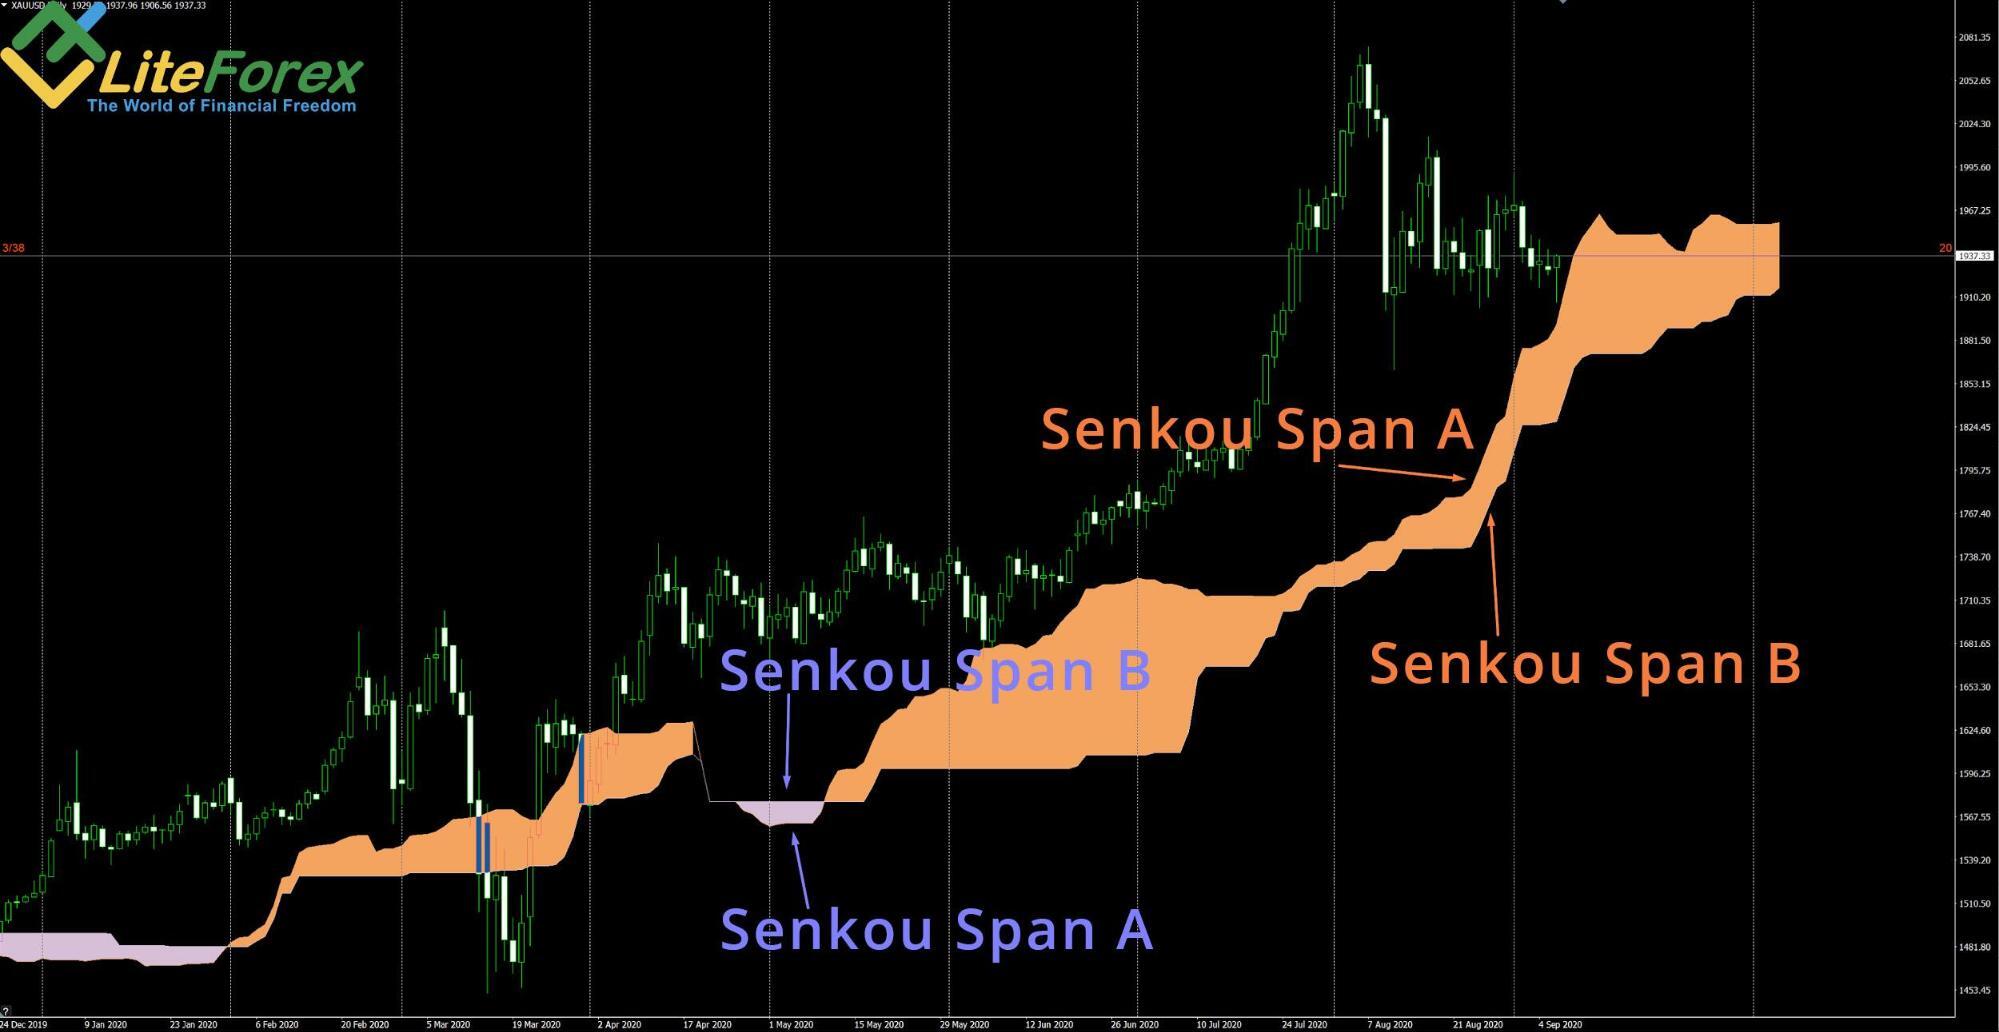
Senkou Span A (First leading line) and Senkou Span B (Second leading line)
Leading span A and Leading span B form the edges of the cloud. The A line averages the values of the conversion line and Kijun, it is plotted 26 periods ahead. The B line calculates the average of the highest high and the lowest low over the past 52 time periods. It is also plotted 26 periods ahead.
These two lines can also serve as independent support and resistance lines, on the one look equilibrium chart. However, the major function of these lines is to form the Ichimoku cloud indicator.
Depending on which line is higher (Ichimoku Span A or leading Span B), the Ichimoku cloud indicator assumes one color or another, and suggests the likely future price action.
In the Ichimoku cloud indicator settings, you can set your own period for the leading span B line.
This is how the Senkou Span A and Senkou leading Span B lines look separately from the other Ichimoku tools:
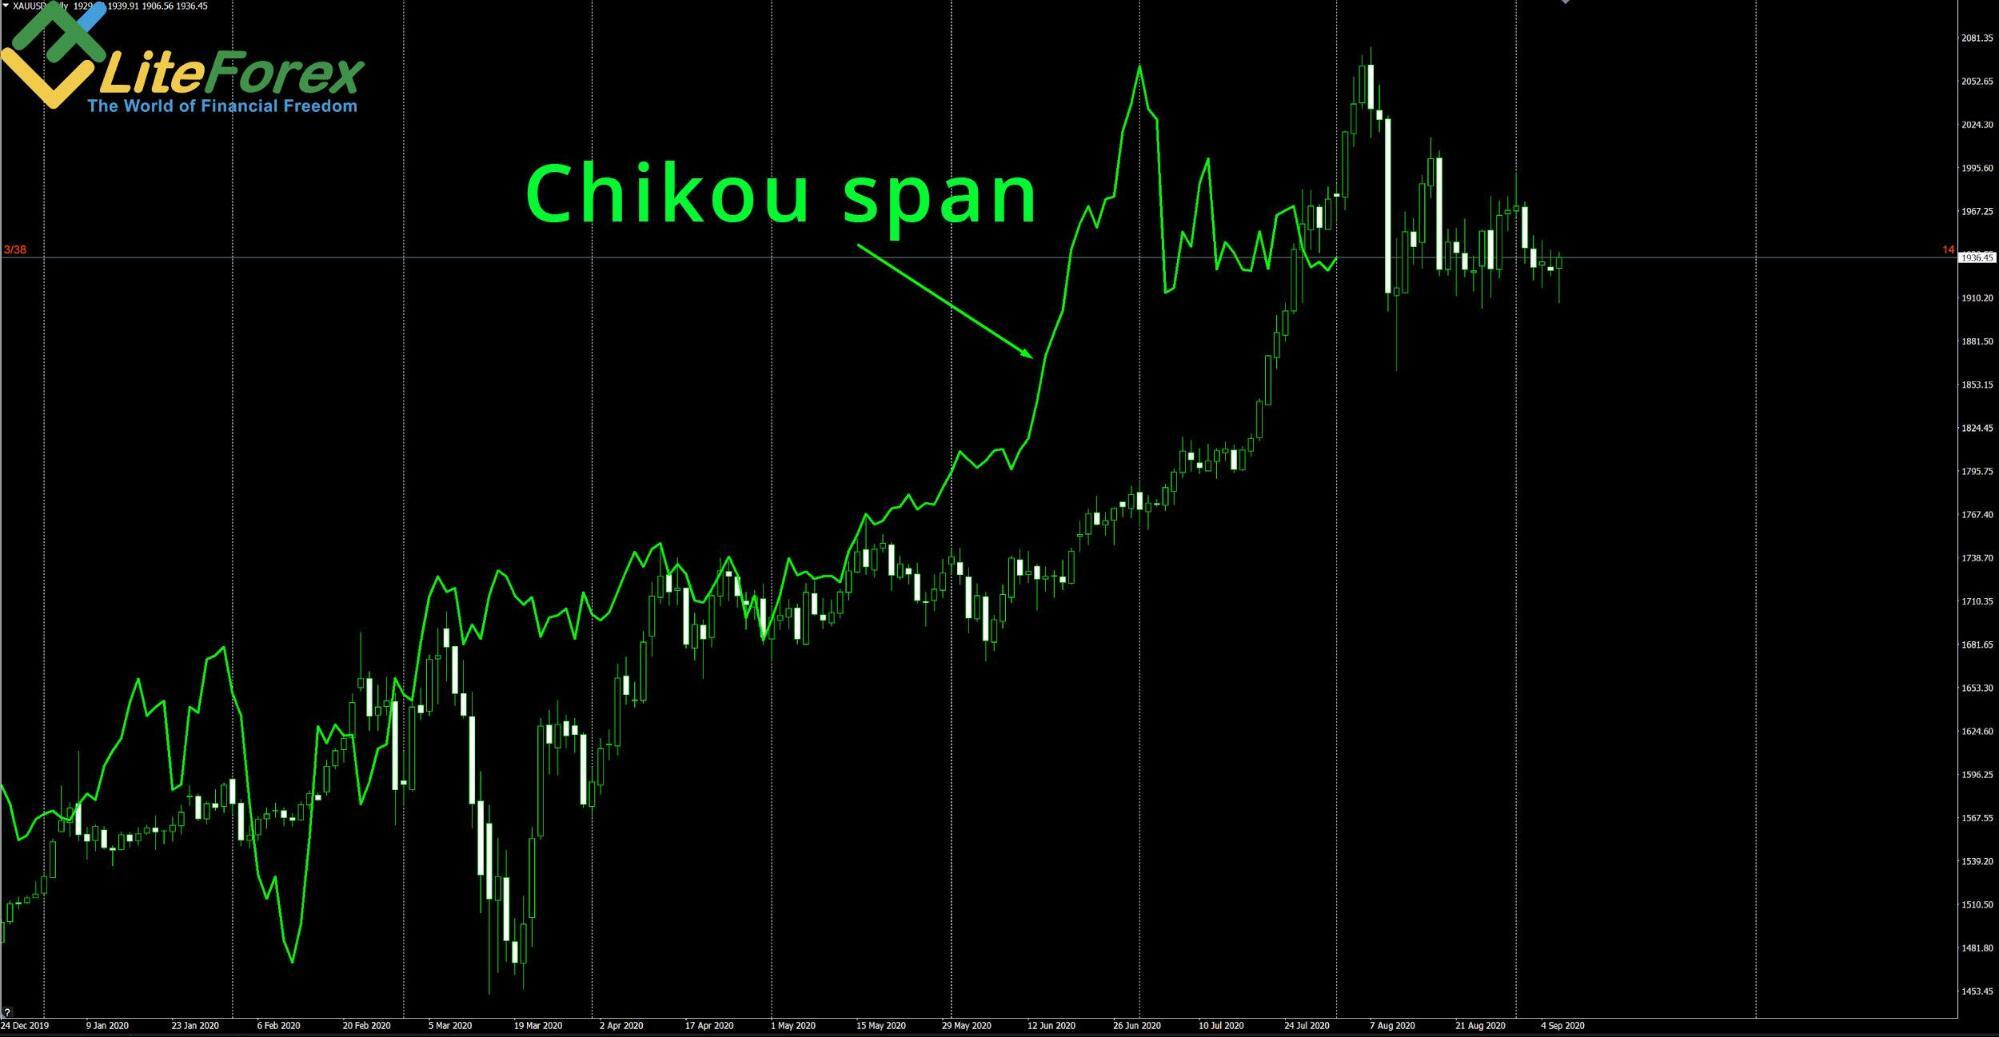
Chikou Span (Lagging line)
Chikou Span (the green price moves line). It is the so-called lagging span Ichimoku. It calculates today's current closing price projected back 26 days on the chart.
This line serves as an oscillator. It indicates the price deviation from the previous values. Differently put, traders look at price deviations from this line to understand when the trend will exhaust and a correction might start. Accordingly, they decide on whether they should exit the trades and could trade against the trend. I will cover the Chikou span signals in detail later.
This is how the Chikou span line looks separately from the other Ichimoku tools:
Kumo
In addition to the base support and resistance lines, there are some other prominent elements of the indicator, filled zones like kumo cloud. They are the so-called Ichimoku clouds. The kumo cloud is the area between the leading span A and B lines.
If Senkou A is below Senkou B, the zone is purple, which indicates a downtrend and a strong sell signal.
If Senkou A is above Senkou B, the zone is orange, a strong buy signal is send and the trend goes up.
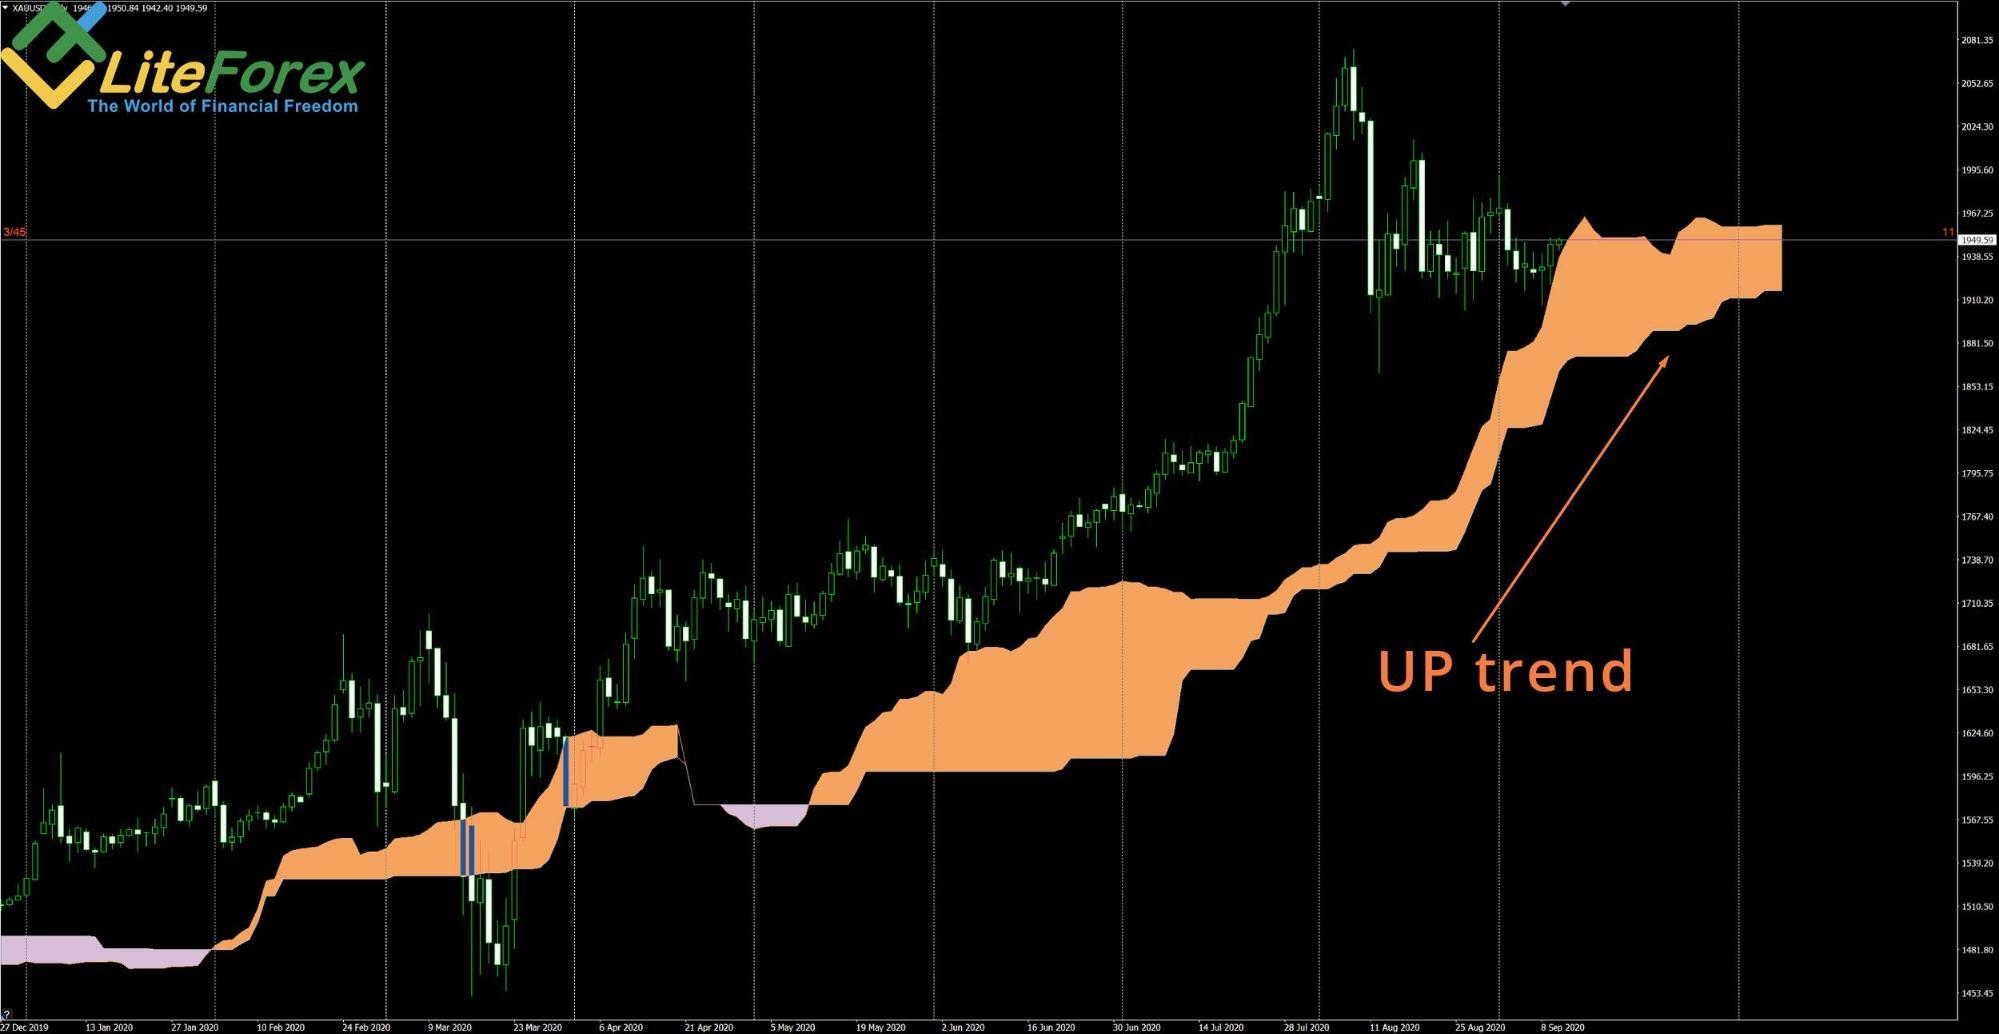
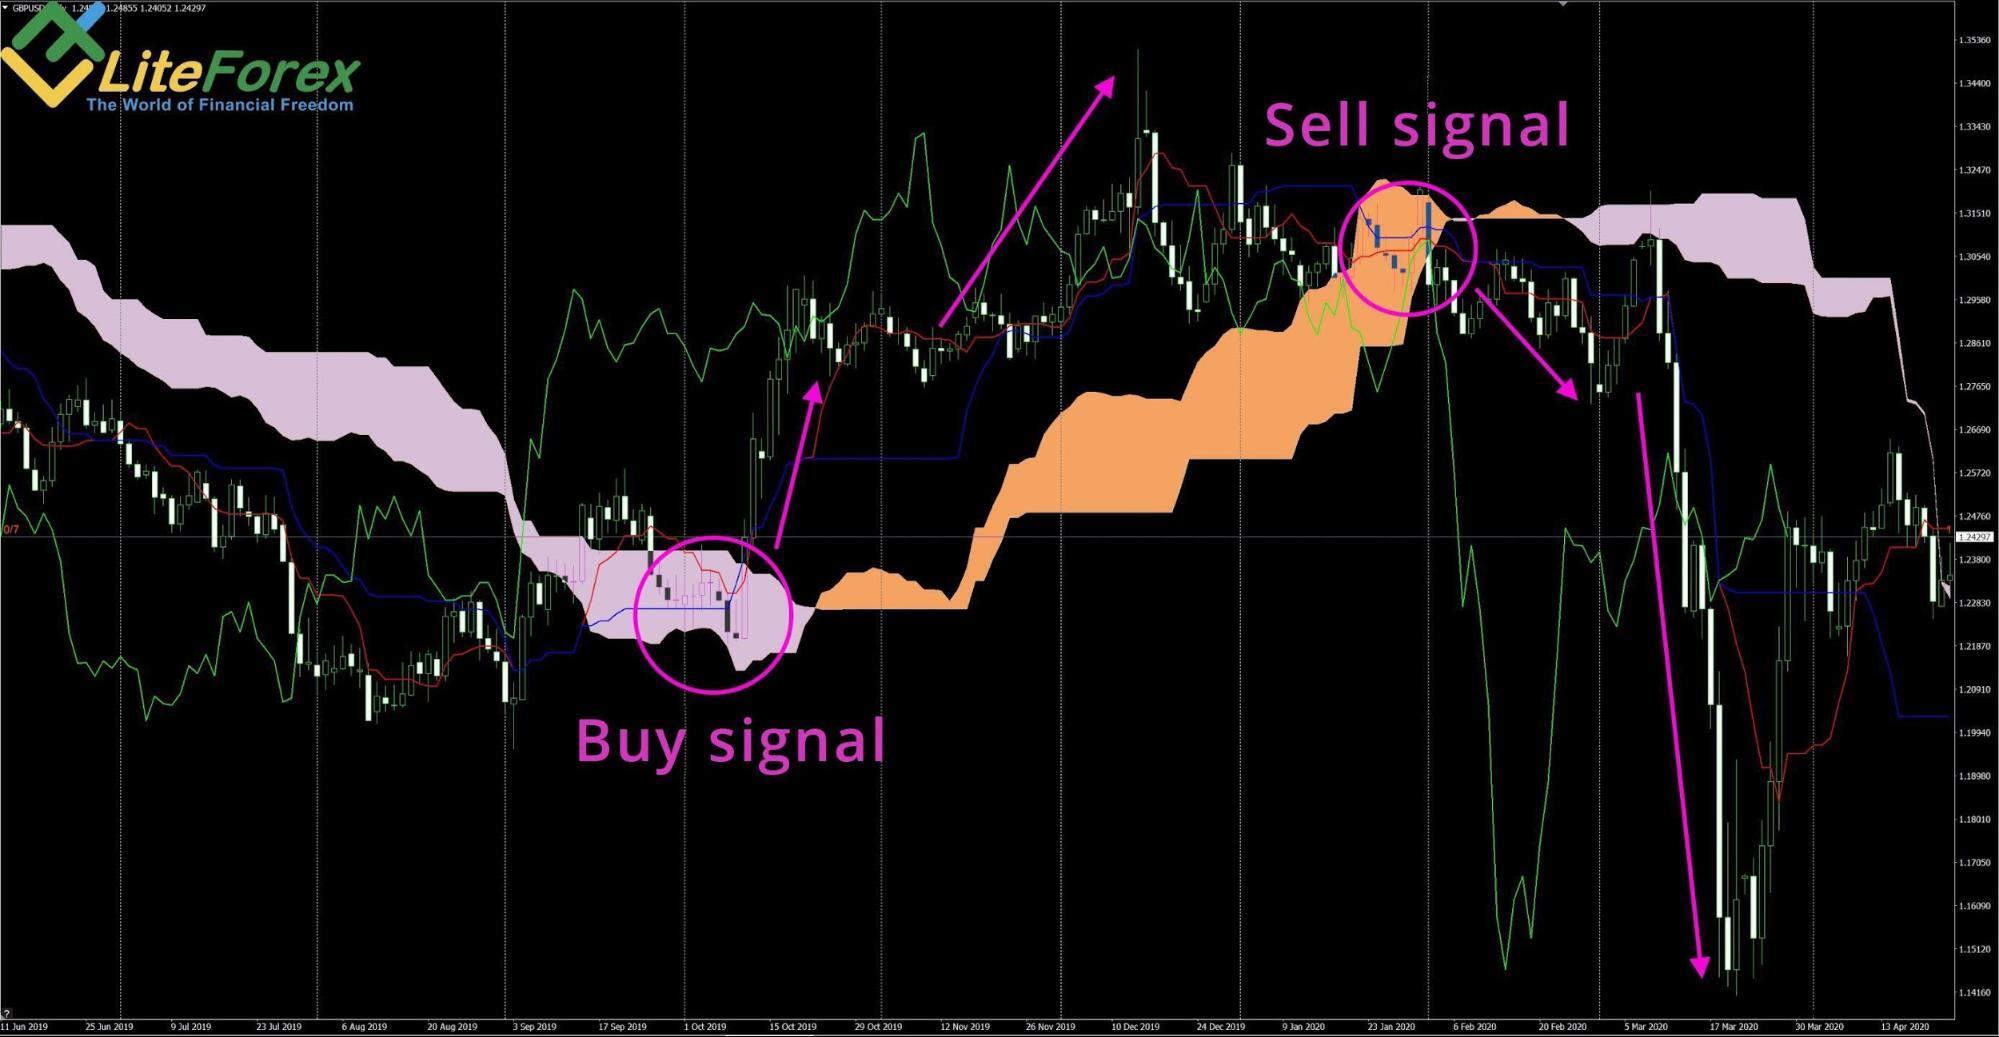
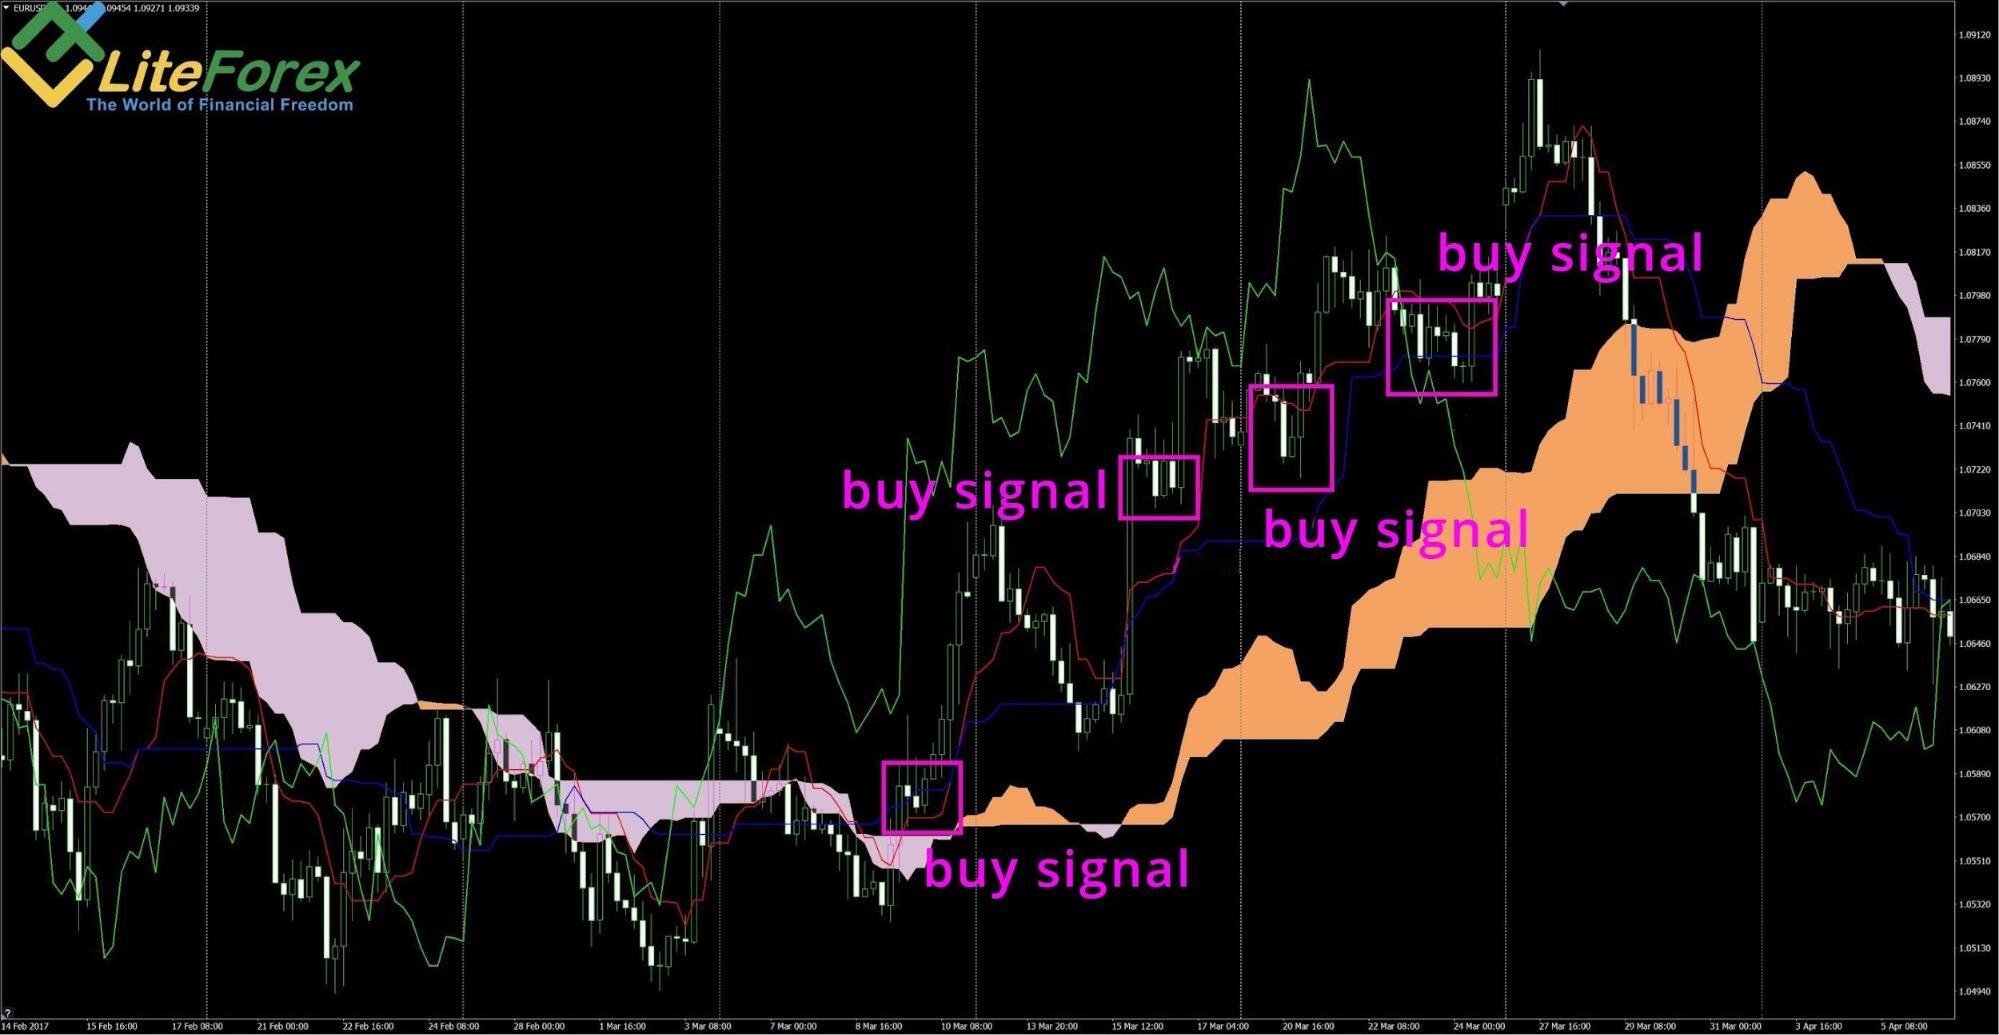
An Ichimoku cloud chart can predict long-term price trends and trading signals. If the price is currently above the kumo cloud, and the cloud is orange, it is relevant to a buy signal. If the price is below the cloud, and the cloud is, accordingly, purple, then it is relevant to a sell signal.
The filled areas represent support levels and resistance zones for a long-term trend.
For example, there in the chart below the signal price rises that indicates is a clear gold price uptrend with a strong buy signal:
A clear gold downtrend with a strong sell signal:
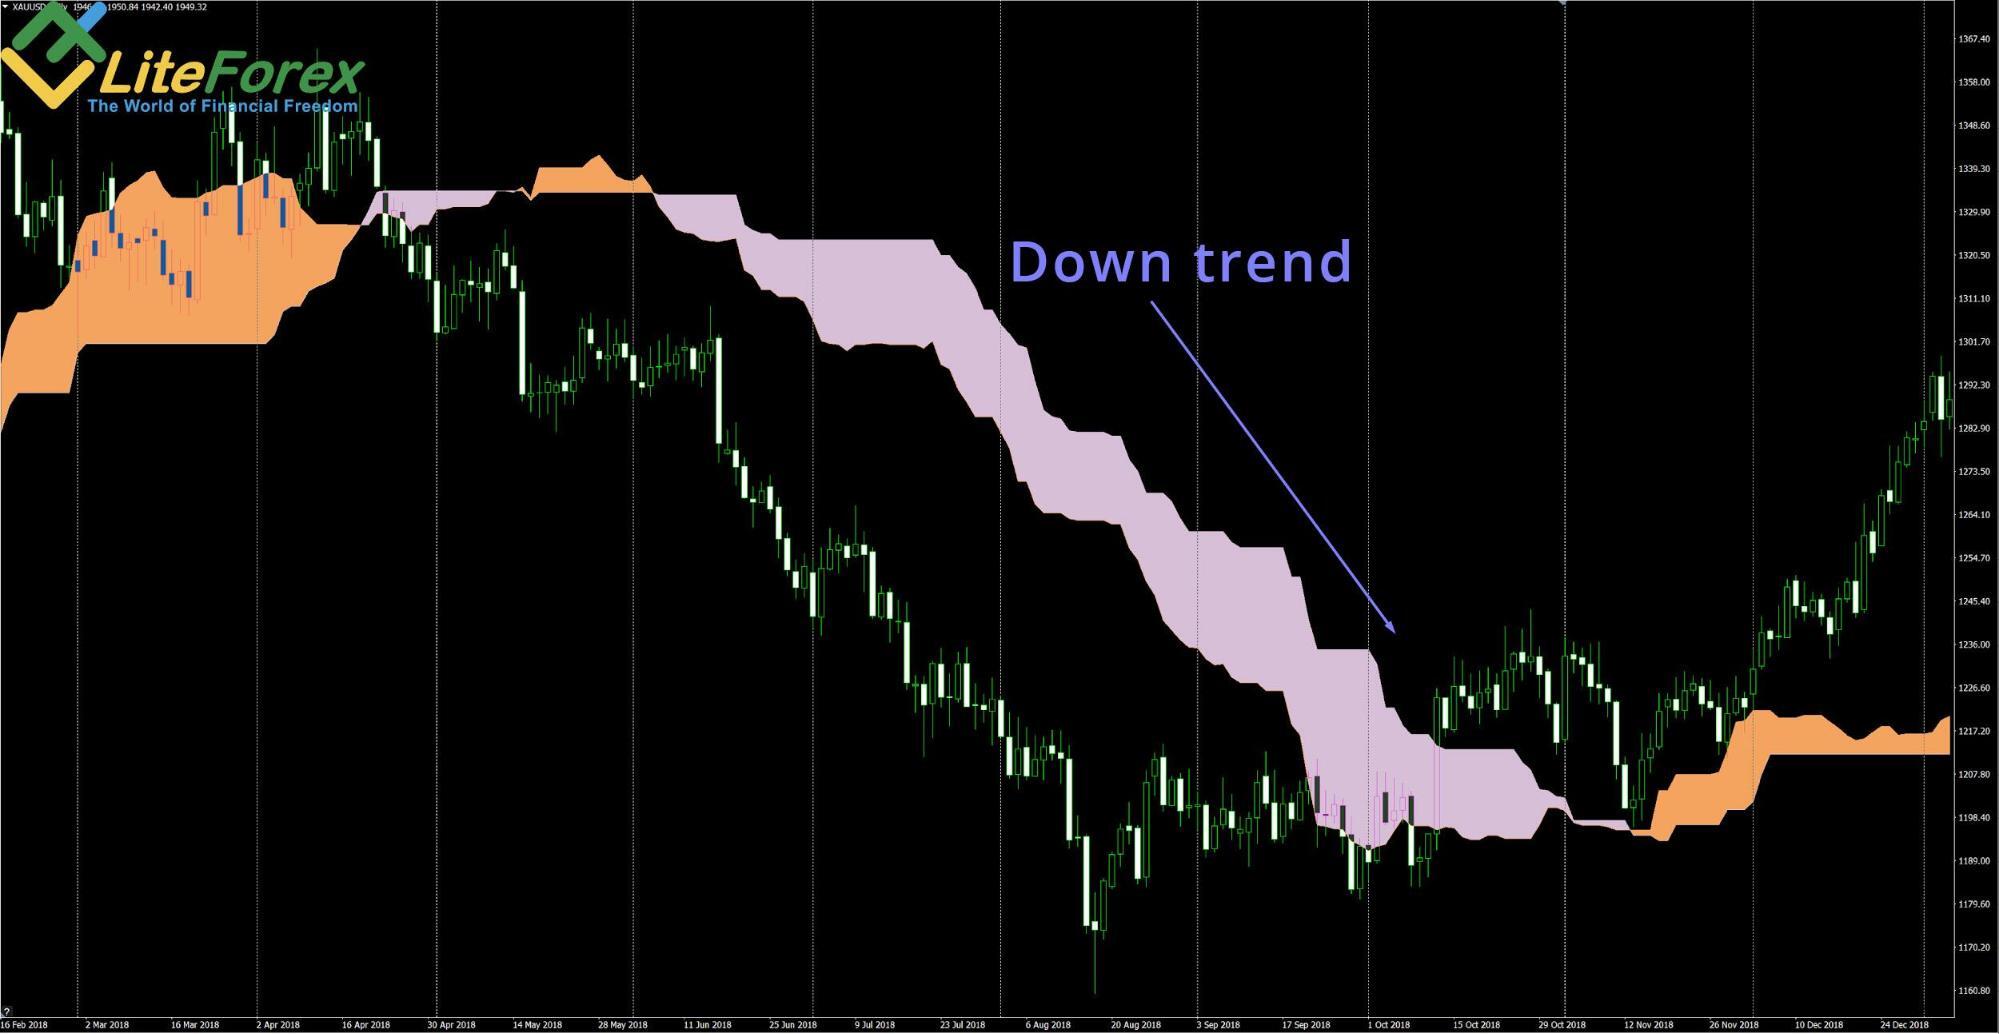
When the kumo cloud changes the color, the trader should expect a new long-term trend.
How to use Ichimoku Cloud in Forex trading
We have studied technical aspects of the lines’ calculation. Now, let us see what these lines are used for and what they mean.
In general, the Ichimoku cloud indicator is designed to spot future price movement and momentum in order to help you make buy and sell decisions more easily. You can have a brief look at the chart and see the future price action and the price location relative to the support and resistance levels, and then, you can look for a corresponding pattern to enter a buy or sell trade.
An important note. The tool was designed to analyze quite long timeframes, daily and weekly charts of the Nikkei. Later, this algorithm was applied to the Forex chart analysis.
Besides, financial markets are more volatile than 90 years ago. The Ichimoku Cloud indicator still quite accurately anticipates middle- and long-term trends, but it can also be employed in shorter Forex trading timeframes, starting from H1.
I do not recommend using timeframes shorter than an hourly chart. Perfect timeframes to trade with the Ichimoku cloud indicator are H1-D1.
You can trade any currency pairs choosing to use Ichimoku cloud.
How to identify the trend using Ichimoku Cloud?
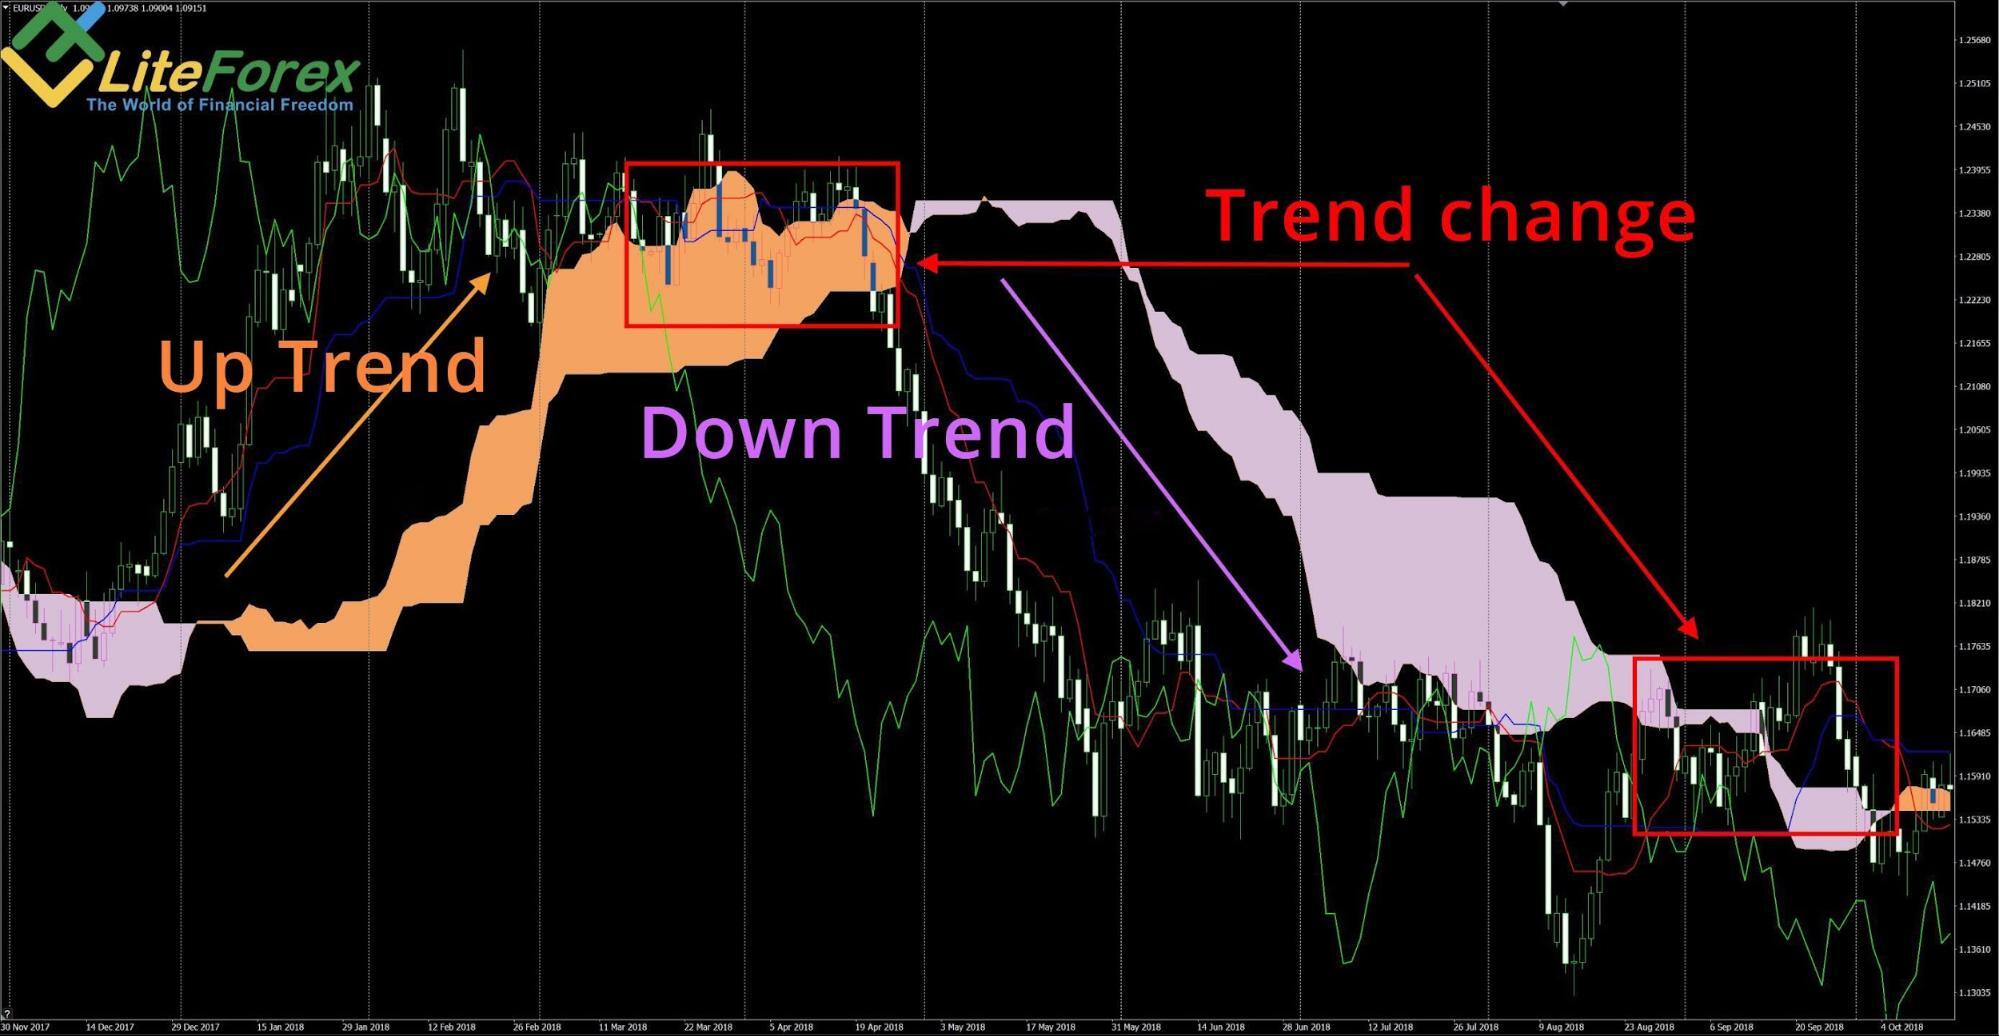
The long-term trend is defined using the filled zones, Ichimoku clouds. If the price is trading below the cloud, the trend is down producing a bearish signal. If the price ticker in the chart is trading above the cloud with a strong buy signal, the trend is rising upwards.
The color of the cloud is also important. A purple cloud means that the price could fall soon. An orange cloud is an indication of a strong buy signal and also a signal price rises soon.
A perfect case for entering buy trades is when the price action is trading above the orange cloud.
When the price is trading inside a cloud it means there is no clear trend.
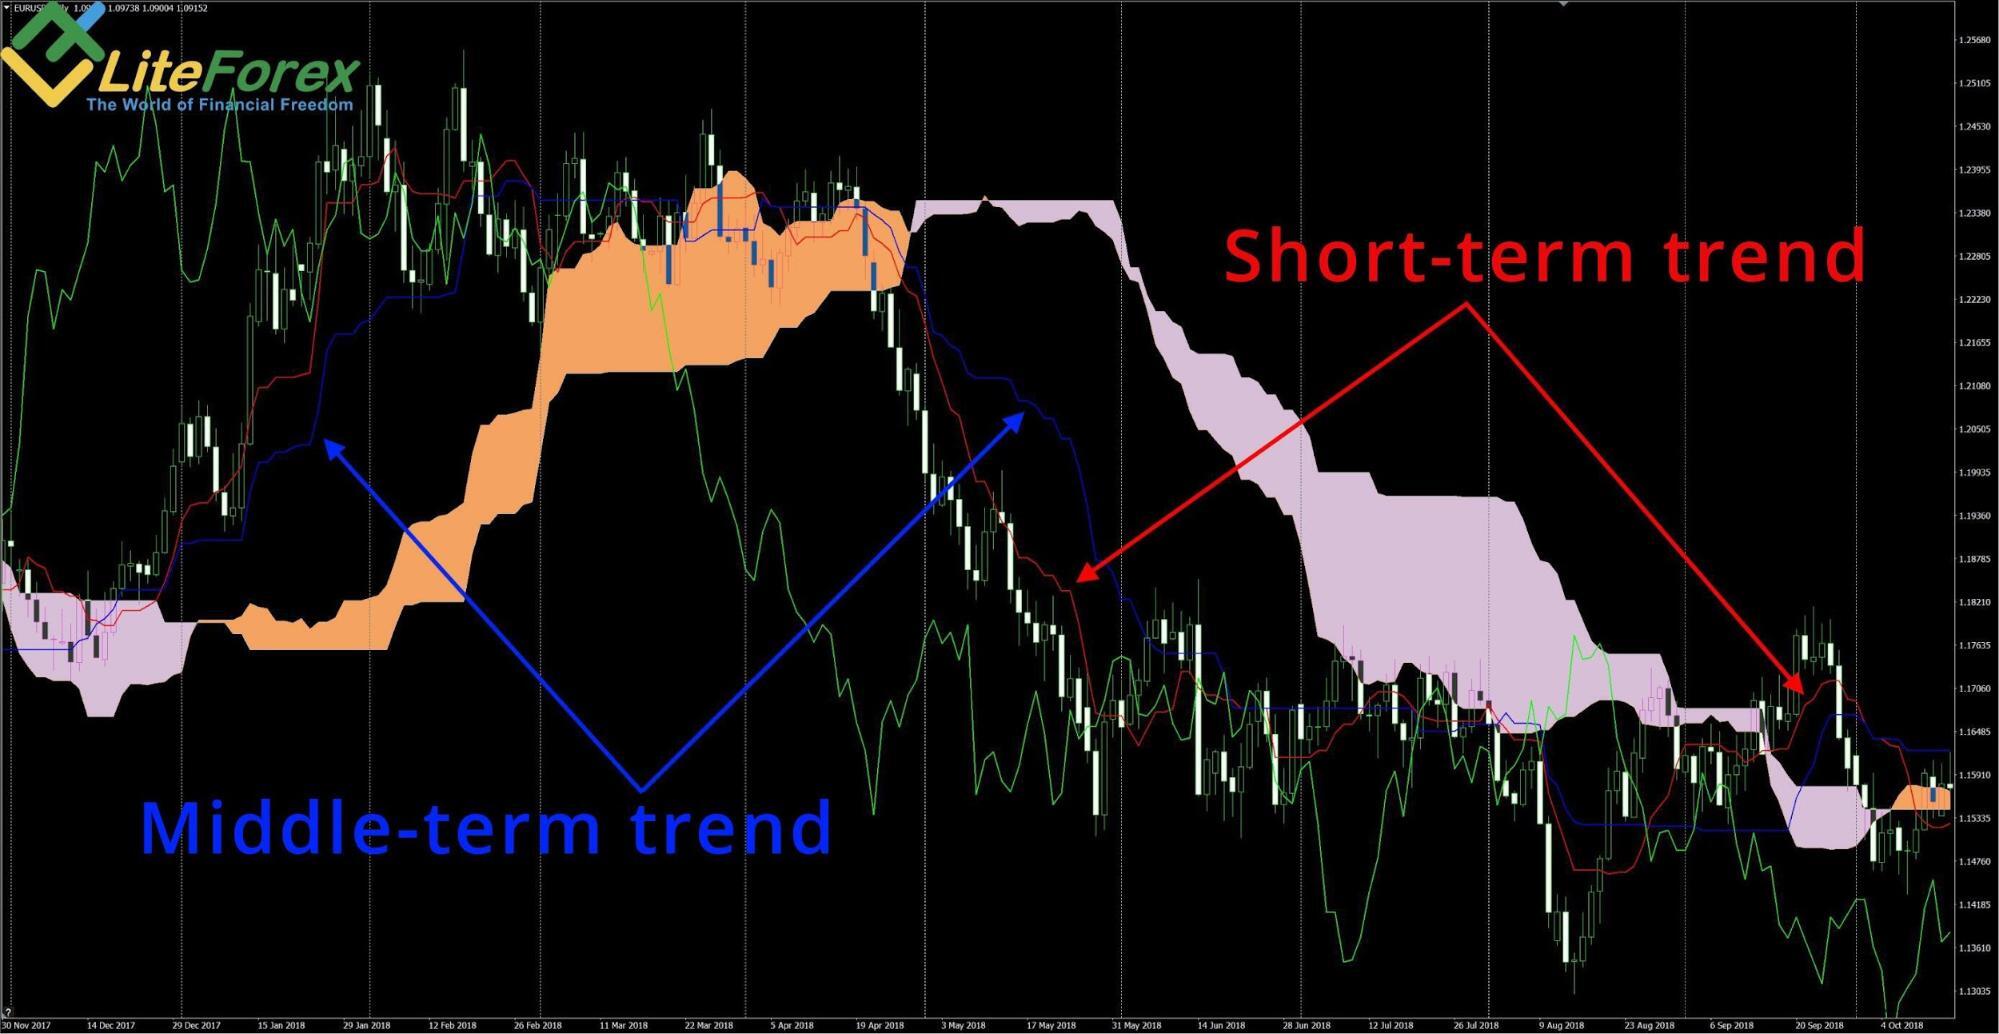
The medium-term trend is defined by the Kijun line, and the short-term trend is indicated by the conversion line. These lines are basically common moving averages, but the calculation is different. They are the average of high and low over a particular time. There is an opinion among the speculators trading with the Ichimoku cloud that the conversion line and base line are more accurate than common EMAs.
You should also assess the direction of these lines and the angle. The more acute is the angle, the stronger is the trend.
When conversion line and base line are horizontal, there is the accumulation zone in the market.
As the Ichimoku technical tool is a leading indicator, it can be used to anticipate the market situation in the medium-term and long-term outlook. The clouds projected into the future give clues on possible movements of the trend.
The below screenshots present the examples of such projections:
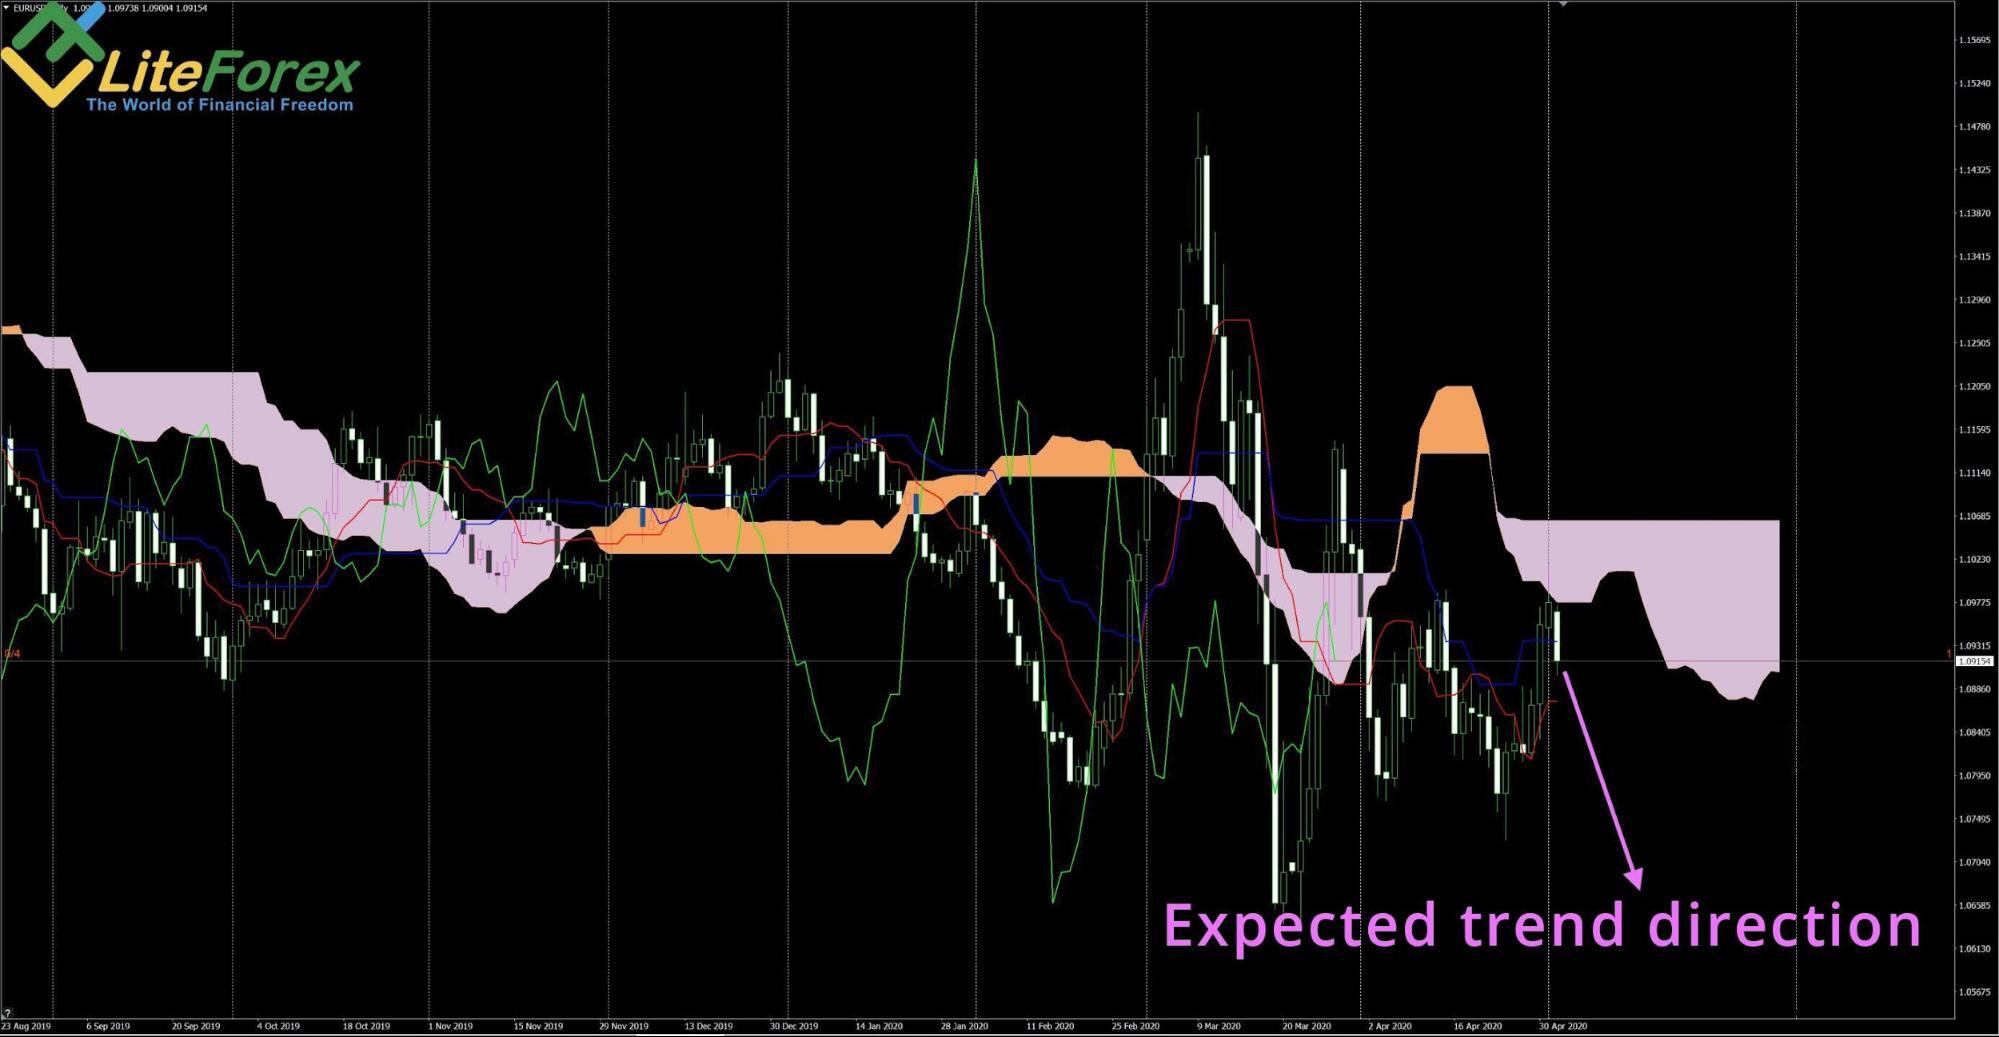
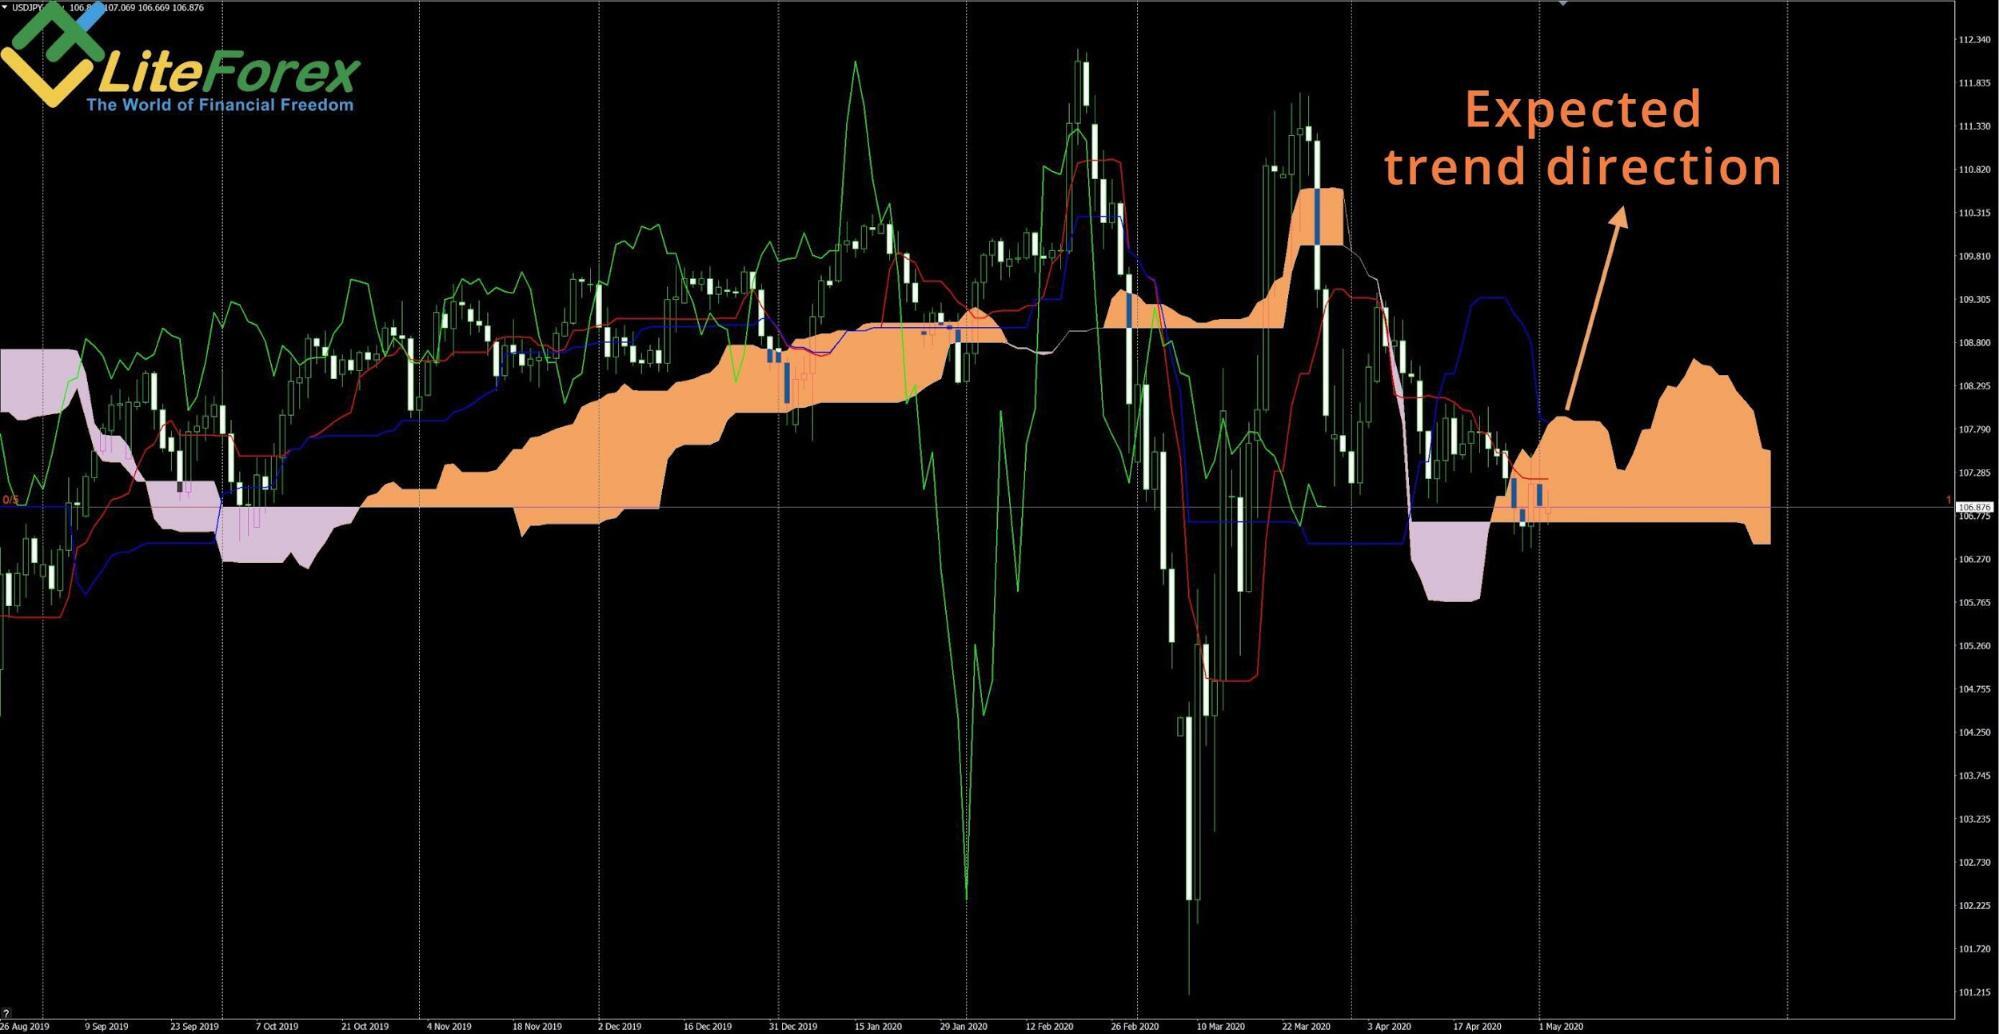
The role of dynamic levels of Ichimoku Kinko Hyo
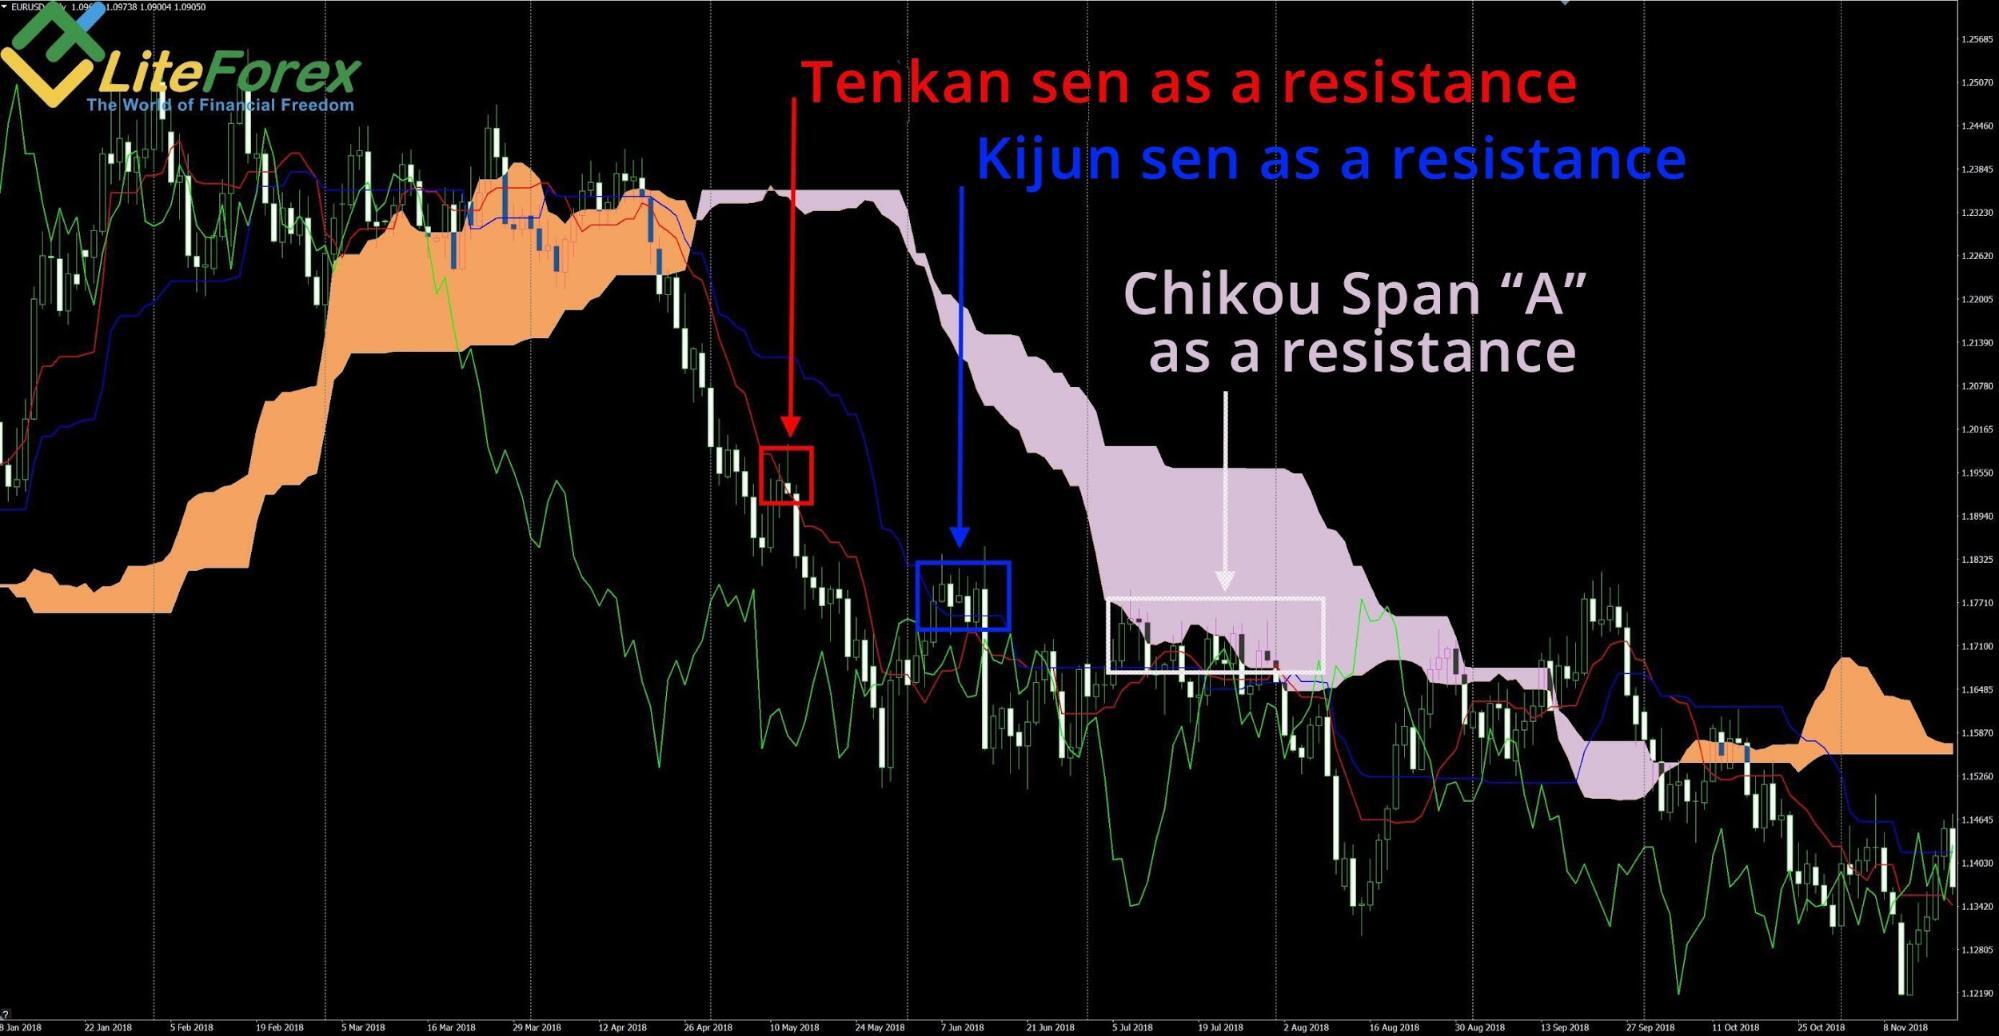
All Ichimoku lines, except the Chikou span, may serve as important support and resistance levels. They provide Ichimoku cloud info. It is suggested that the conversion line is rather weak, while the Kijun line is a much more important level.
Senkou leading span A and Senkou leading span B are key levels, which are the strongest price action signals. The cloud itself is also a level.
Let us see how it works on an example:
Flat zones — Ichimoku clouds
Flat zones are Ichimoku clouds, within which you can also trade. As you know, when an instrument is trading flat, one should enter trades at the borders of the trading range. If the price action goes into the filled zone, the Senkou A and Senkou B become reference levels, where one could enter trades with targets at the opposite level.
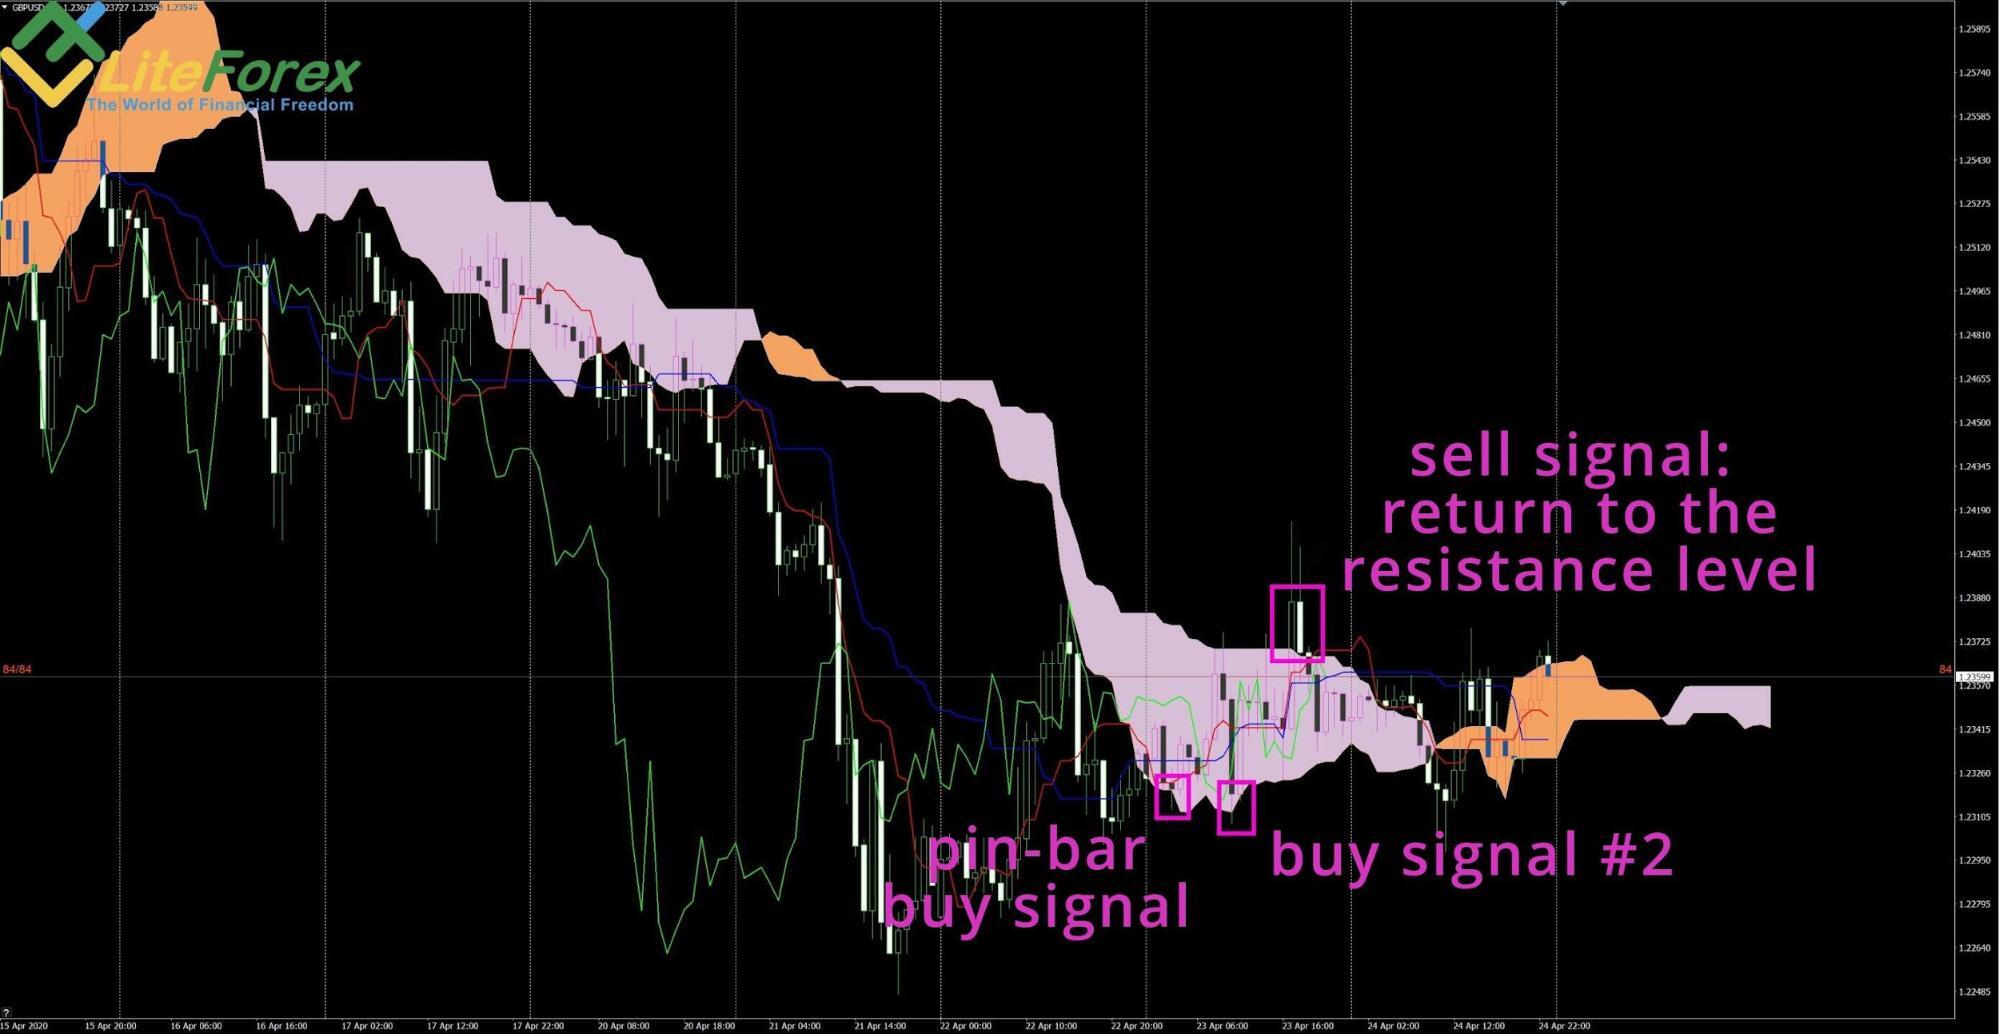
The above figure displays the GBPUSD H1 chart. You can see that, on April 23, 2022, the price broke through the Senkou A line and entered the cloud.
Next, via the retest of the broken-out Senkou A, the price action reached Senkou B and even went beyond the cloud zone. At the next bar, however, the price rolled back to the trading range, drawing a false cloud breakout pattern. The false breakout of the Senkou B was a strong sell signal to enter a trade with the target at the opposing strong level.
Note that the price has twice tested the Senkou A line from above after it broke the line out. A buy pattern was formed at the Asian session and, later, at the European session. At the U.S. session, the market sent a bearish trend signal in order to sell the GBPUSD.
The role of the Chikou span oscillator
Basically, the Chikou line is a momentum indicator. Like any oscillator, it is designed to indicate the price deviation from the average value. Significant deviations create the overbought/oversold zones, which indicates a potential correction or a trend reversal.
Parameters and values: Ichimoku Kinko Hyo best settings
Let us enter the Ichimoku indicator parameters. We see three variables:
Tenkan period (default value = 9);
Kijun period (default value = 26);
- Senkou leading Span B period ( default value = 52).
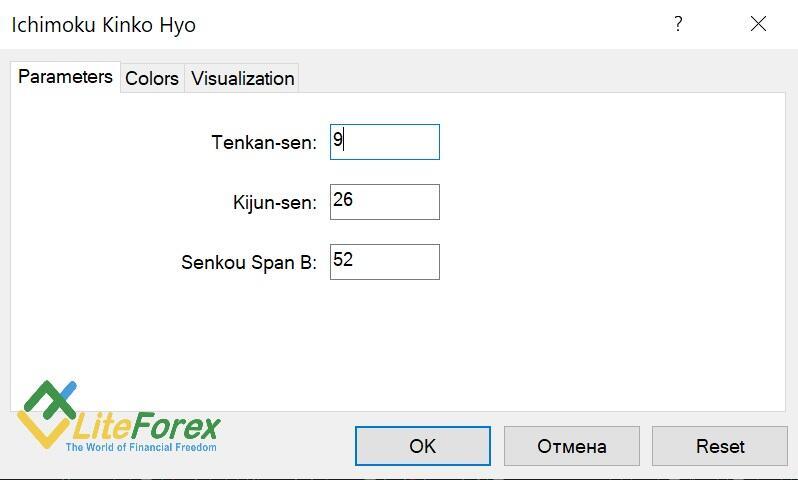
The default settings when choosing to use Ichimoku cloud are quite effective, so I do not recommend beginners to change them. When you study the working principle of the Ichimoku tool, you can experiment with its parameters.
Originally, Goichi Hosoda, when developing the indicator, referred to the Japanese stock market and Japanese working days, which were six days a week at that time. So, he took a period of 1.5 weeks for the conversion line. The 26 period originally meant the number of working days in a month, and 52 is the number of weeks in a year.
You can set the indicator parameters according to the current conditions:
- Tenkan = 5;
- Kijun = 20;
- Senkou leading Span B = 52.
As a result, you will have the data changing more dynamically, but this is not always better. Anyway, you should test the changed parameters and compare them with the default values. Only after that, you can decide.
How Ichimoku Cloud Works in Forex Trading: Signals & Strategies
Let us cover the Ichimoku Forex trading strategies.
The Ichimoku indicator allows a trader to take a comprehensive approach to market trend analysis and boost his trading style. It indicates the current short-term trend, the medium-term trend, and the long-term global trend.
So, using the Ichimoku cloud, you can build a Forex trading strategy that will successfully work in any timeframe. Besides, you can easily ichimoku indicator free download.
If you want to trade Forex with the Ichimoku cloud system, you should have in mind that there are plenty of Ichimoku trading signals. I will cover the top Ichimoku trading strategies and how to interpret ichimoku cloud trading signals. I will also demonstrate how to use the Ichimoku cloud as a trading strategy.
Patterns of Tenkan and Kijun lines
Traders usually consider signals created by the Tenkan (conversion line) and Kijun line (base line) in two cases:
- When the lines cross;
- When the lines are facing in the same direction.
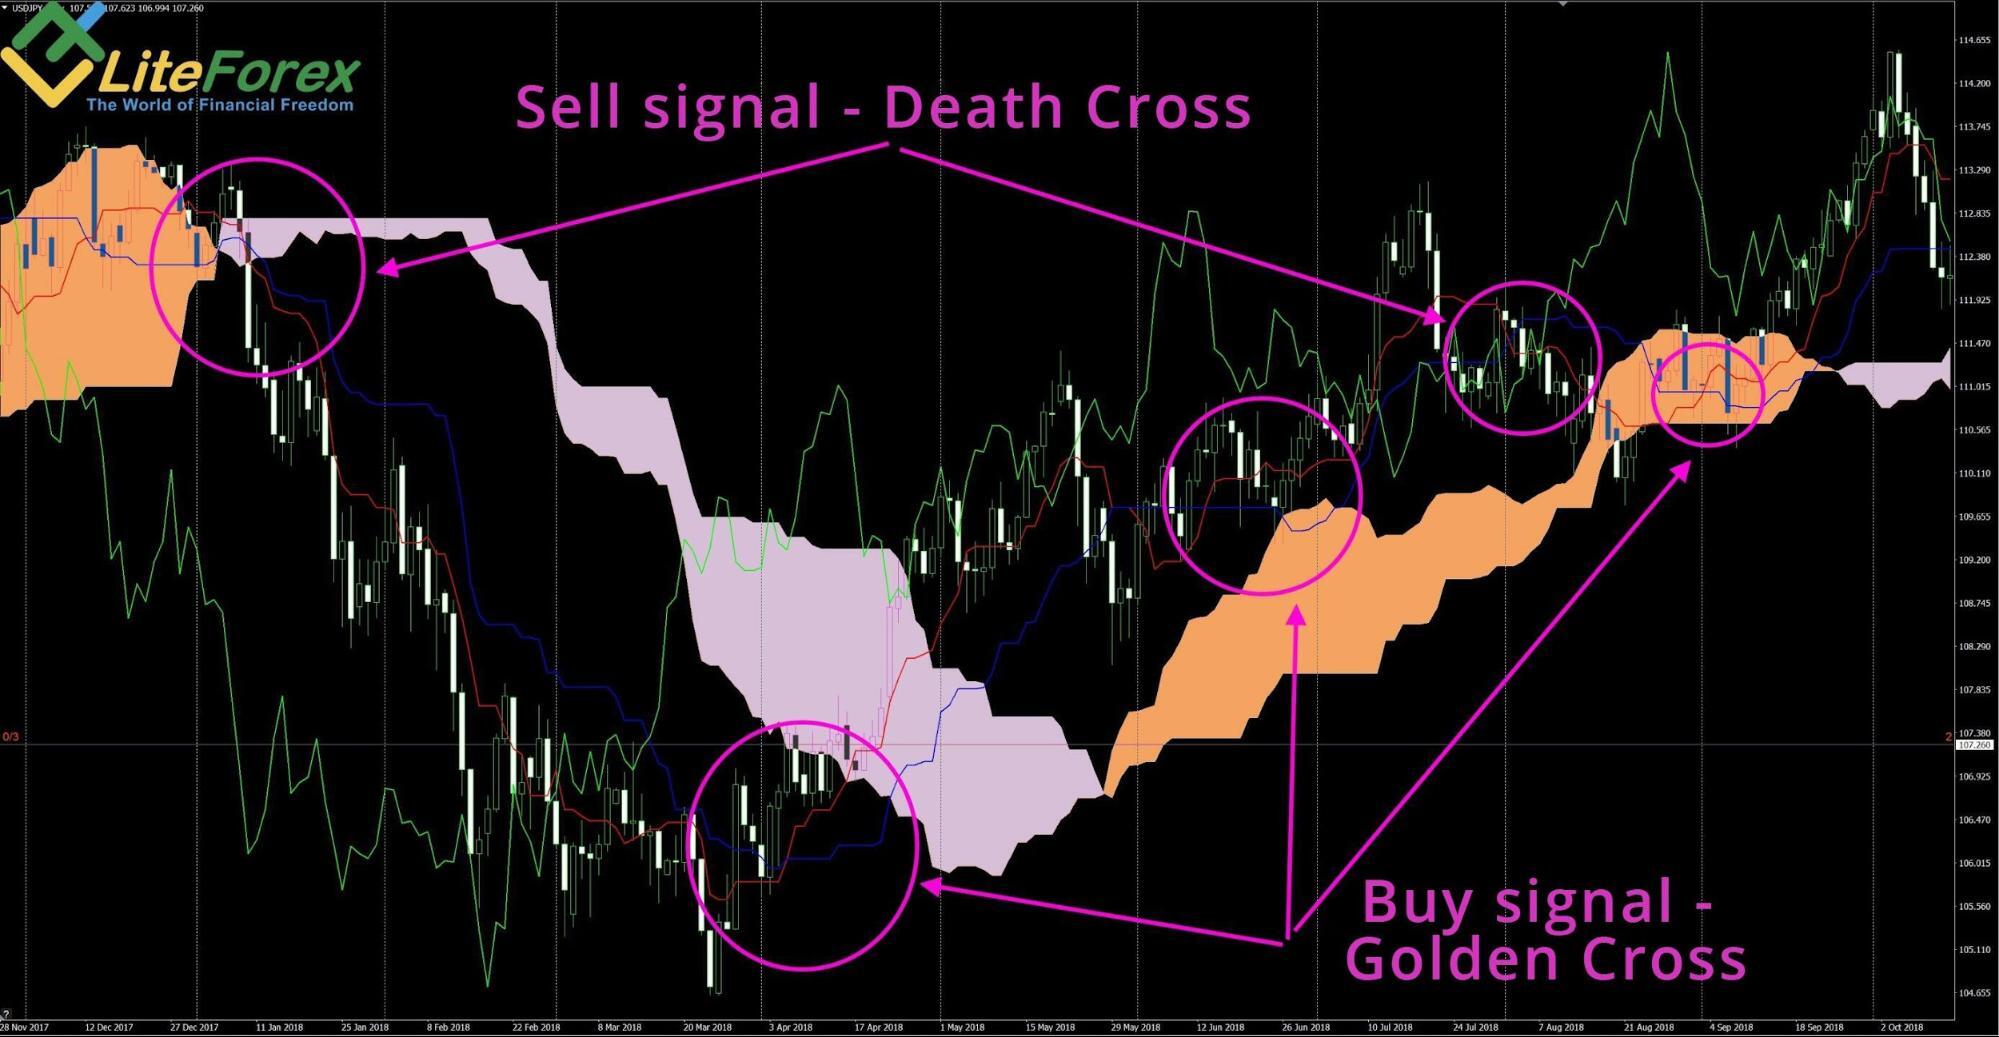
Tenkan Sen / Kijun Sen Cross
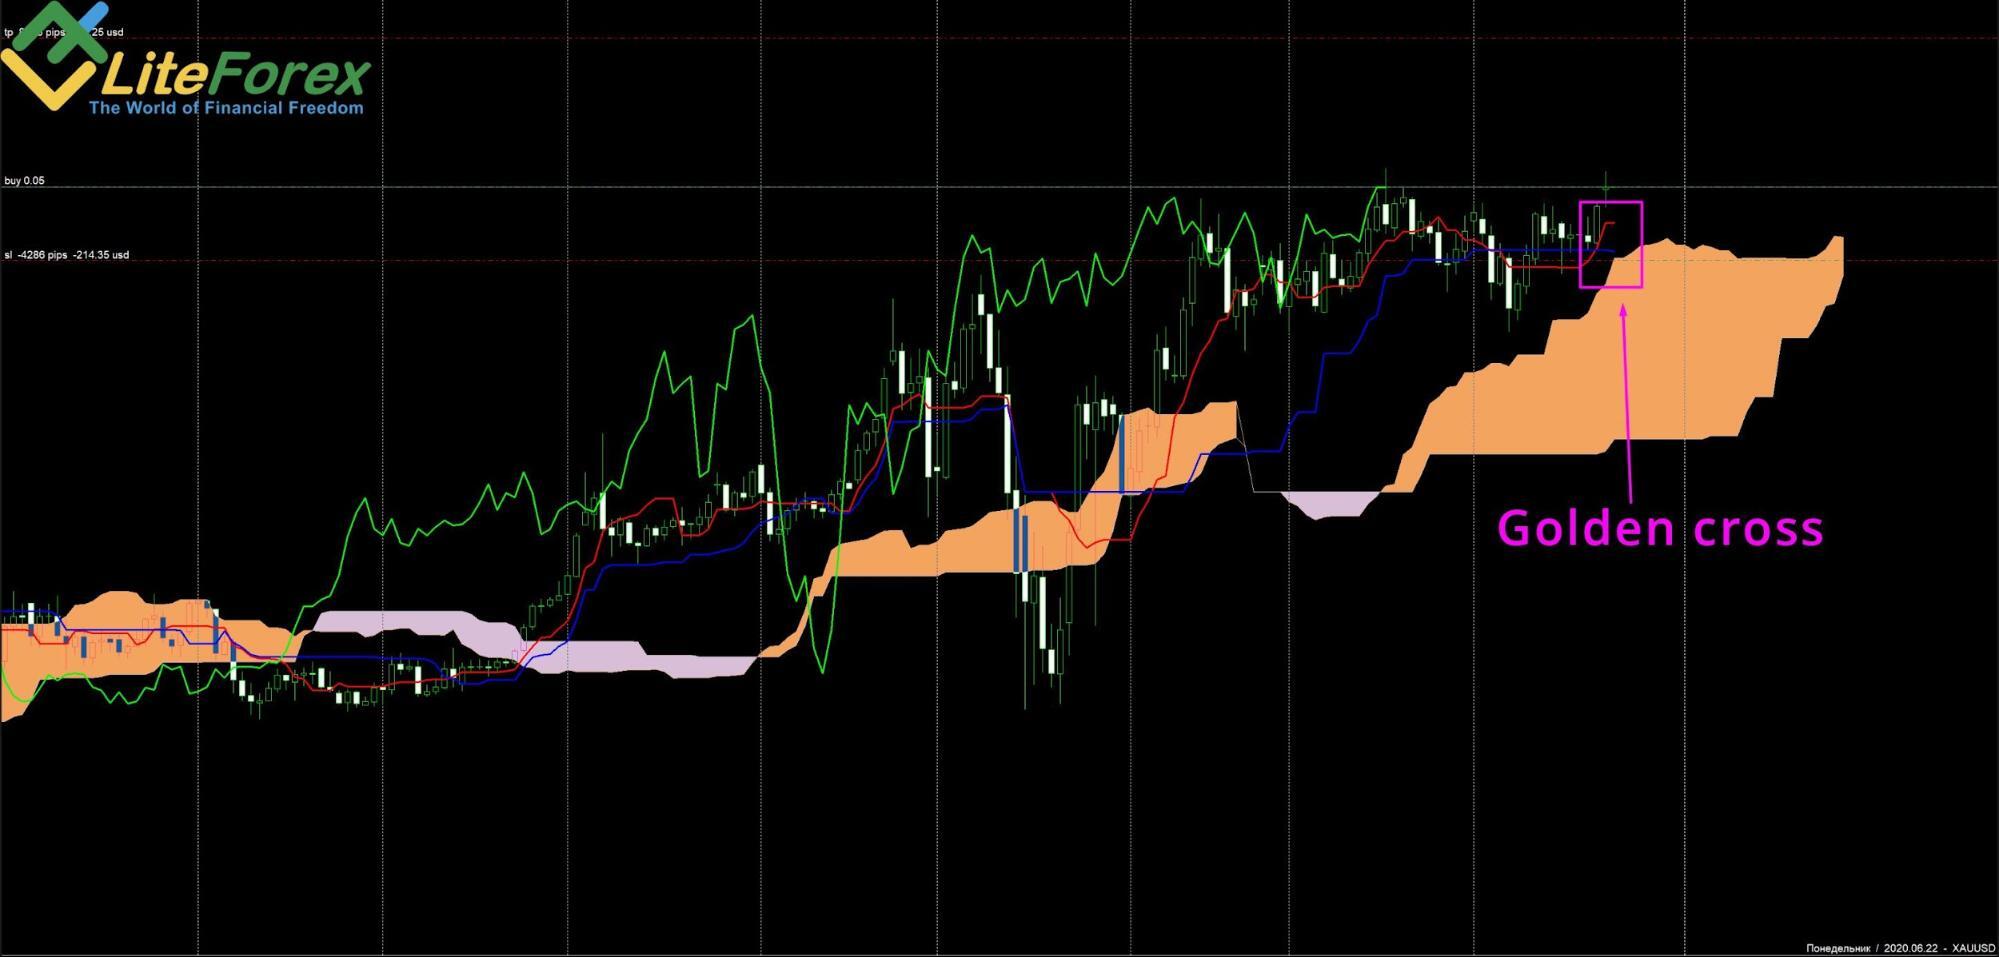
When the conversion line crosses the Kijun upside, there is a Golden Cross pattern. This is a buy pattern.
When the Tenkan line crosses the Kijun downside, there is a Dead Cross pattern. This is a sell pattern and a strong bearish signal.
Based on the market situation, the above patterns may signal the trend continuation or correction. They should be taken into account, but they are not the strongest signals, so, I recommend trading according to the patterns that are consistent with the general trend. To trade in the correction, i.e. counter the trend, there should additional confirming signals.
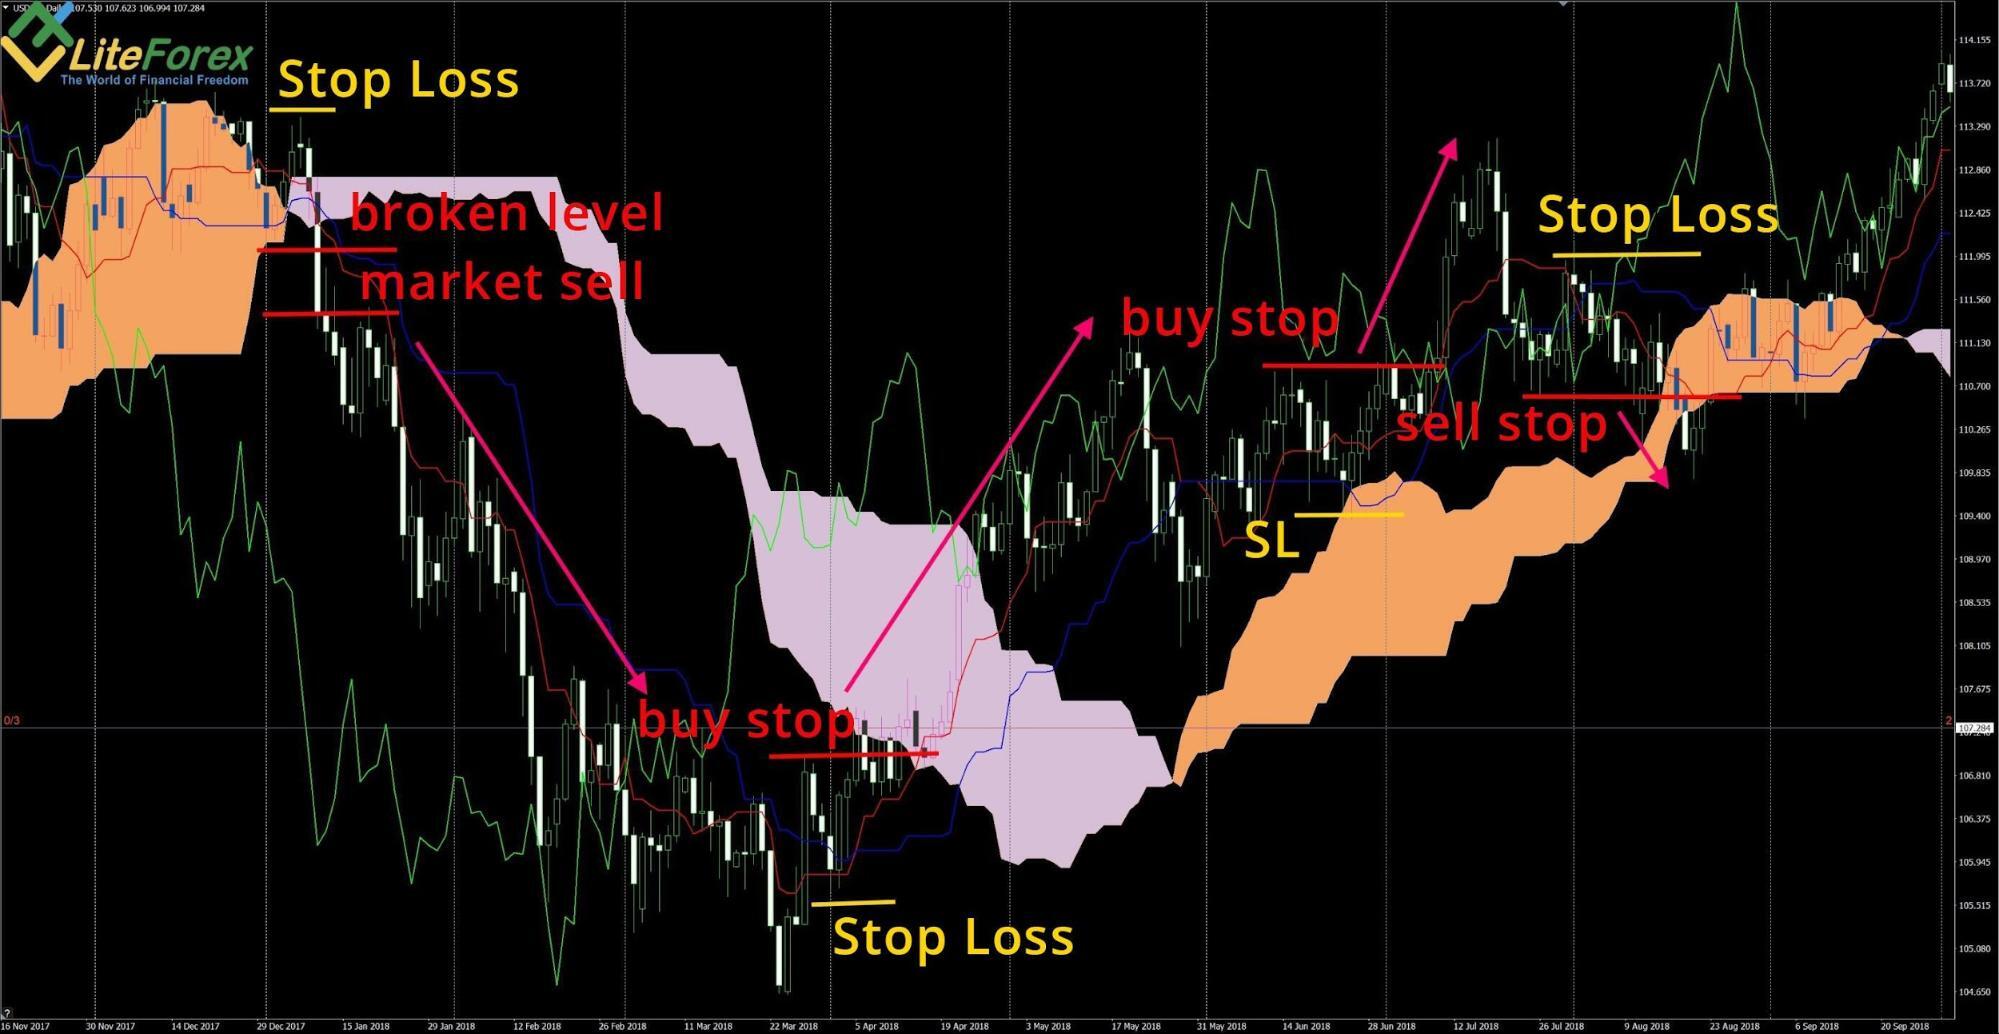
How to trade the Tenkan and Kijun crossing? You can enter a trade once the signal bar closes in the free Ichimoku charts. A stop loss is set beyond the next local high or low. Another option is to enter a trade at the breakthrough of the local high or low in the direction suggested by the signal (i.e. if it is a buy pattern, you enter when the price action breaks through the local high).
There is no universal entry rule. You should make a decision according to the particular market situation and your personal trading style.
Kijun and Tenkan alignment pattern
Kijun and Tenkan's alignment in the same direction means that the local and middle-term trends are the same, which suggests entering a trade. You should also analyze the long-term trend when you want to enter a trade based on the alignment of the Ichimoku Kijun and Tenkan lines. The long-term trend must confirm the idea to buy or sell a trading instrument.
You can enter a trade immediately after a trending movement starts when the lines have located in the same direction. You can also enter a trade in the middle of the trend, but, in this case, you’d better expect a correction or the test of the blue or the red line or the zone that is created between these lines.
Senkou Span A/Senkou Span B patterns
Signals sent by the Senkou Span lines and the cloud they create. The Senkou span or leading span A and B lines could be the support and resistance levels, depending on the trend. The leading span A is a less important level, the leading span B is thought to be stronger, it marks the border of the long-term trend.
The cloud’s color changes when from the faster cloud boundary of leading span A crosses the slower cloud boundary of the leading span B, and so, there are early signals of the trend reversal. Therefore, entering a trade after these lines cross will be at the inceptive stage of a new trend. Here is an example of the Ichimoku trading signals that occurred when the cloud’s color changes:
I recommend entering a trade after the Ichimoku cloud has changed the color. A Stop Loss, in a perfect situation, is put at some distance from the cloud. Note that the new cloud forms 26 periods ahead, so pay attention to the moment when the buy or sell signals of the the pound were formed in the above screenshot.
Senkou Span Cross
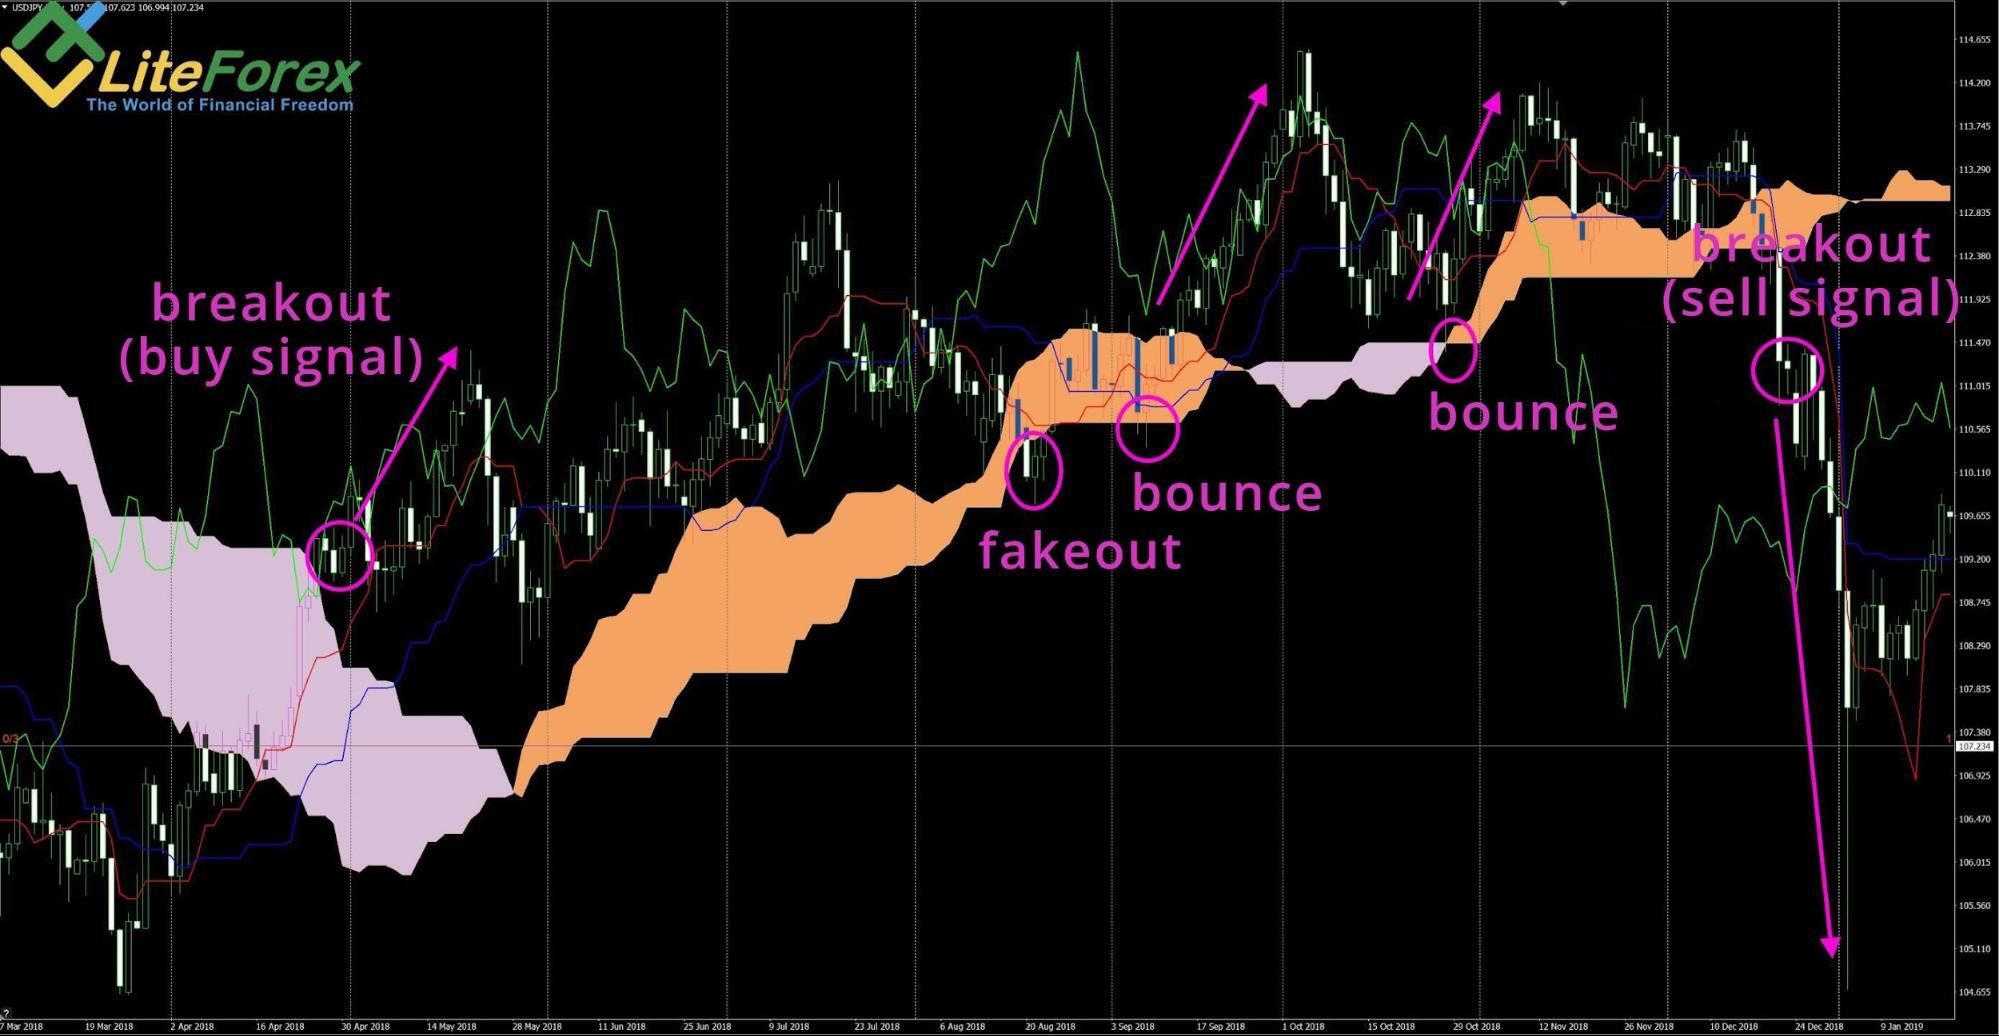
There is another signal, a leading one, when the price action breaks out the Senkou leading Span B. Differently put, it is an ichimoku uptrend cloud crossover indicating a strong bullish trend. The line itself is a dynamic level and marks the trend border. Therefore, if the outer border is not broken, the trend is likely to continue. If the price action breaks through the filled zone, the trend should reverse soon and the bullish signal will finish.
Let us study the examples of the rebound and the breakout of the leading span B line. I recommend you to pay attention to the breakouts and the price further movement:
Kumo Breakout
When the price action is trading within the filled area, the kumo cloud, it means there is forming an accumulation zone or flat. When the price is trading flat, one should enter trades at the borders of the range, and this trading strategy is not as simple as trading with the trend.
To have a more or less wide trading range, you need to expect cloud expansion and spot ichimoku cloud buy singlas. It is not always relevant to enter trades when the price action is within the Ichimoku cloud.
Trading in the range suggests entering trades in the direction of the leading span B when the price breaks out of the leading span A. When the price reaches Senkou leading Span B you should be trading in the direction of the first line and so on.
I do not recommend one to use limit orders or enter a trade immediately after the price action breaks out the leading span A. First, the cloud breakout could be false. Second, the range within the cloud usually doesn’t allow entering on the breakout with an acceptable Reward/Risk ratio (2/1 or more).
Tenkan (conversion line) and Kijun in the Ichimoku cloud are still strong levels. It is safer to enter trades at the levels around these lines.
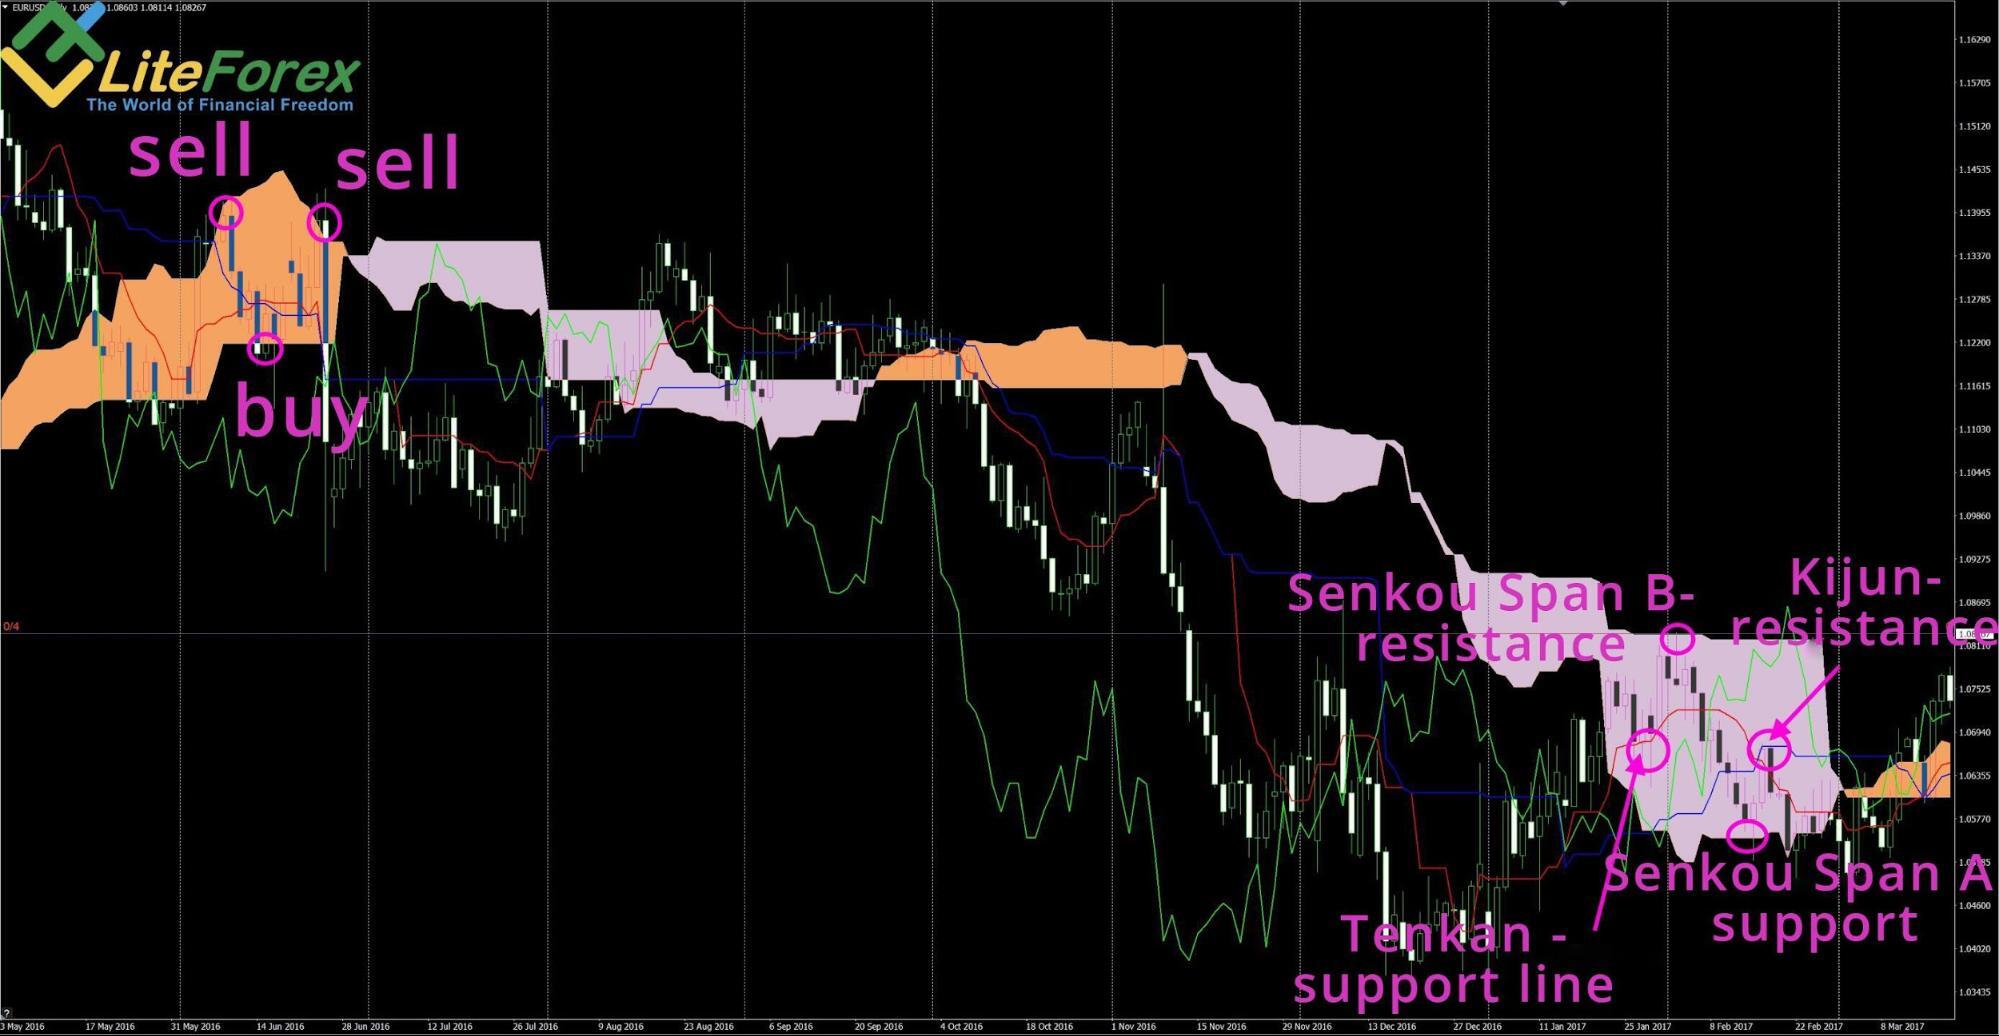
The above screenshot displays two different cases. In the left figure, the price was trading between Span A and leading Span B. In the right one, the Tenkan and Kijun were also used as strong levels.
Trading inside the two cloud boundaries of the Ichimoku is employed by professional Ichimoku traders who know what they do. To detail the entry point, they use shorter timeframes and the Japanese candlestick patterns to supplement an Ichimoku cloud strategy. I do not recommend newbies to trade stocks or other assets in the cloud, as this trading strategy is quite difficult. Beginner traders should first master trading according to simpler and stronger signals described above.
Chikou Span Cross
As I wrote earlier, the Chikou Span serves as an oscillator in the Ichimoku trading system. Therefore, the first thing you should pay attention to is how the price has deviated from the green price moves line. A wide gap between the oscillator and the current closing price means there should soon start a correction opposite to the main trend.
If you witness such a situation and the Japanese candlesticks generate an additional pattern to buy or sell counter the major trend, you can use those important trade signals and open a position in the direction of the correction.
Other important trade signals within an Ichimoku strategy appear when the Chikou Span crosses the price chart. Thus, when the Chikou Span line crosses the price’s base line from below, this indicates an upcoming bullish trend and also produces multiple buy signals. If the Ichimoku Chikou comes from above, this is a potential bearish trend and a sell signal.
You should remember that the oscillator is projected back 26 bars. Approximately as many days, according to the Ichimoku tool developer, large traders need to accumulate the position before the further strong move.
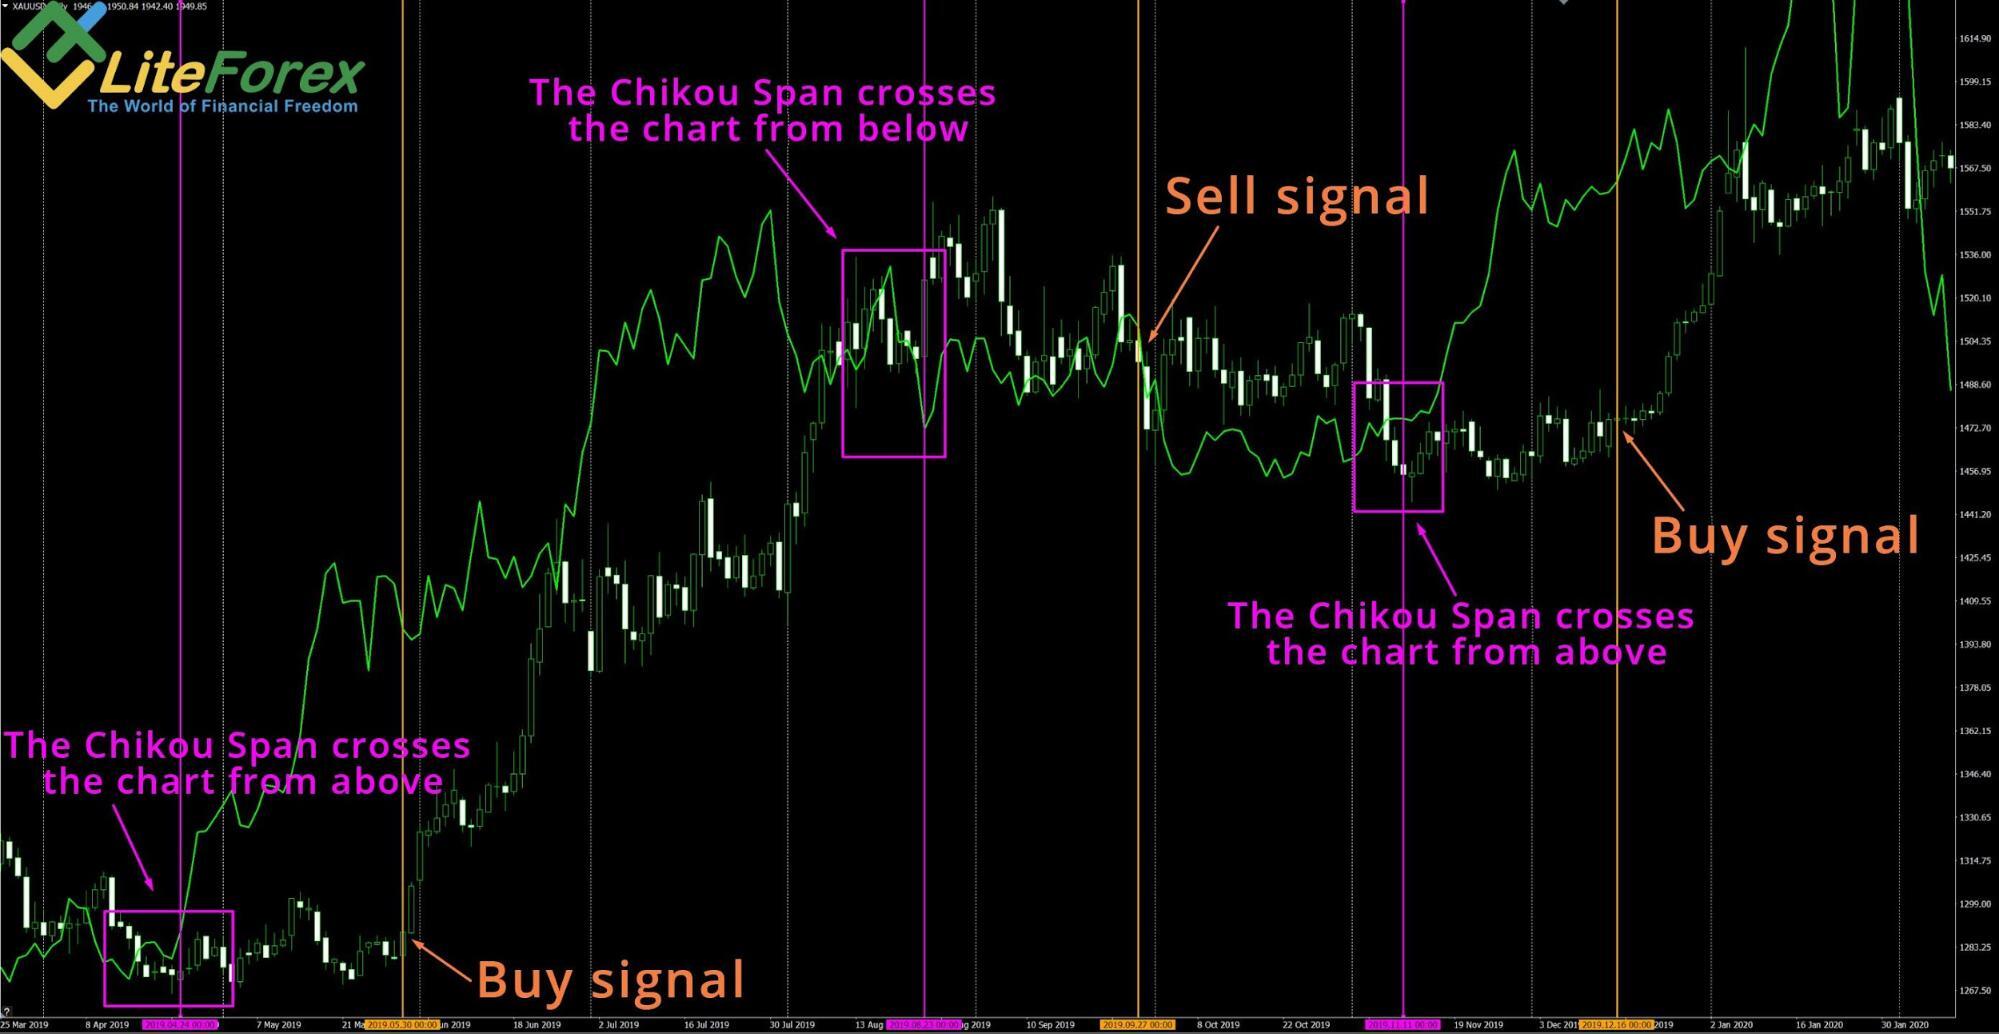
In the above example, the bar marked with a purple vertical line marks the point where the Chikou span breaks through the price’s base line either upside or downside. The orange line marks the bar that generates sell or buy signals, accordingly. The pattern appears quite seldom in Ichimoku charts, but it is a strong signal in the Ichimoku trading strategies.
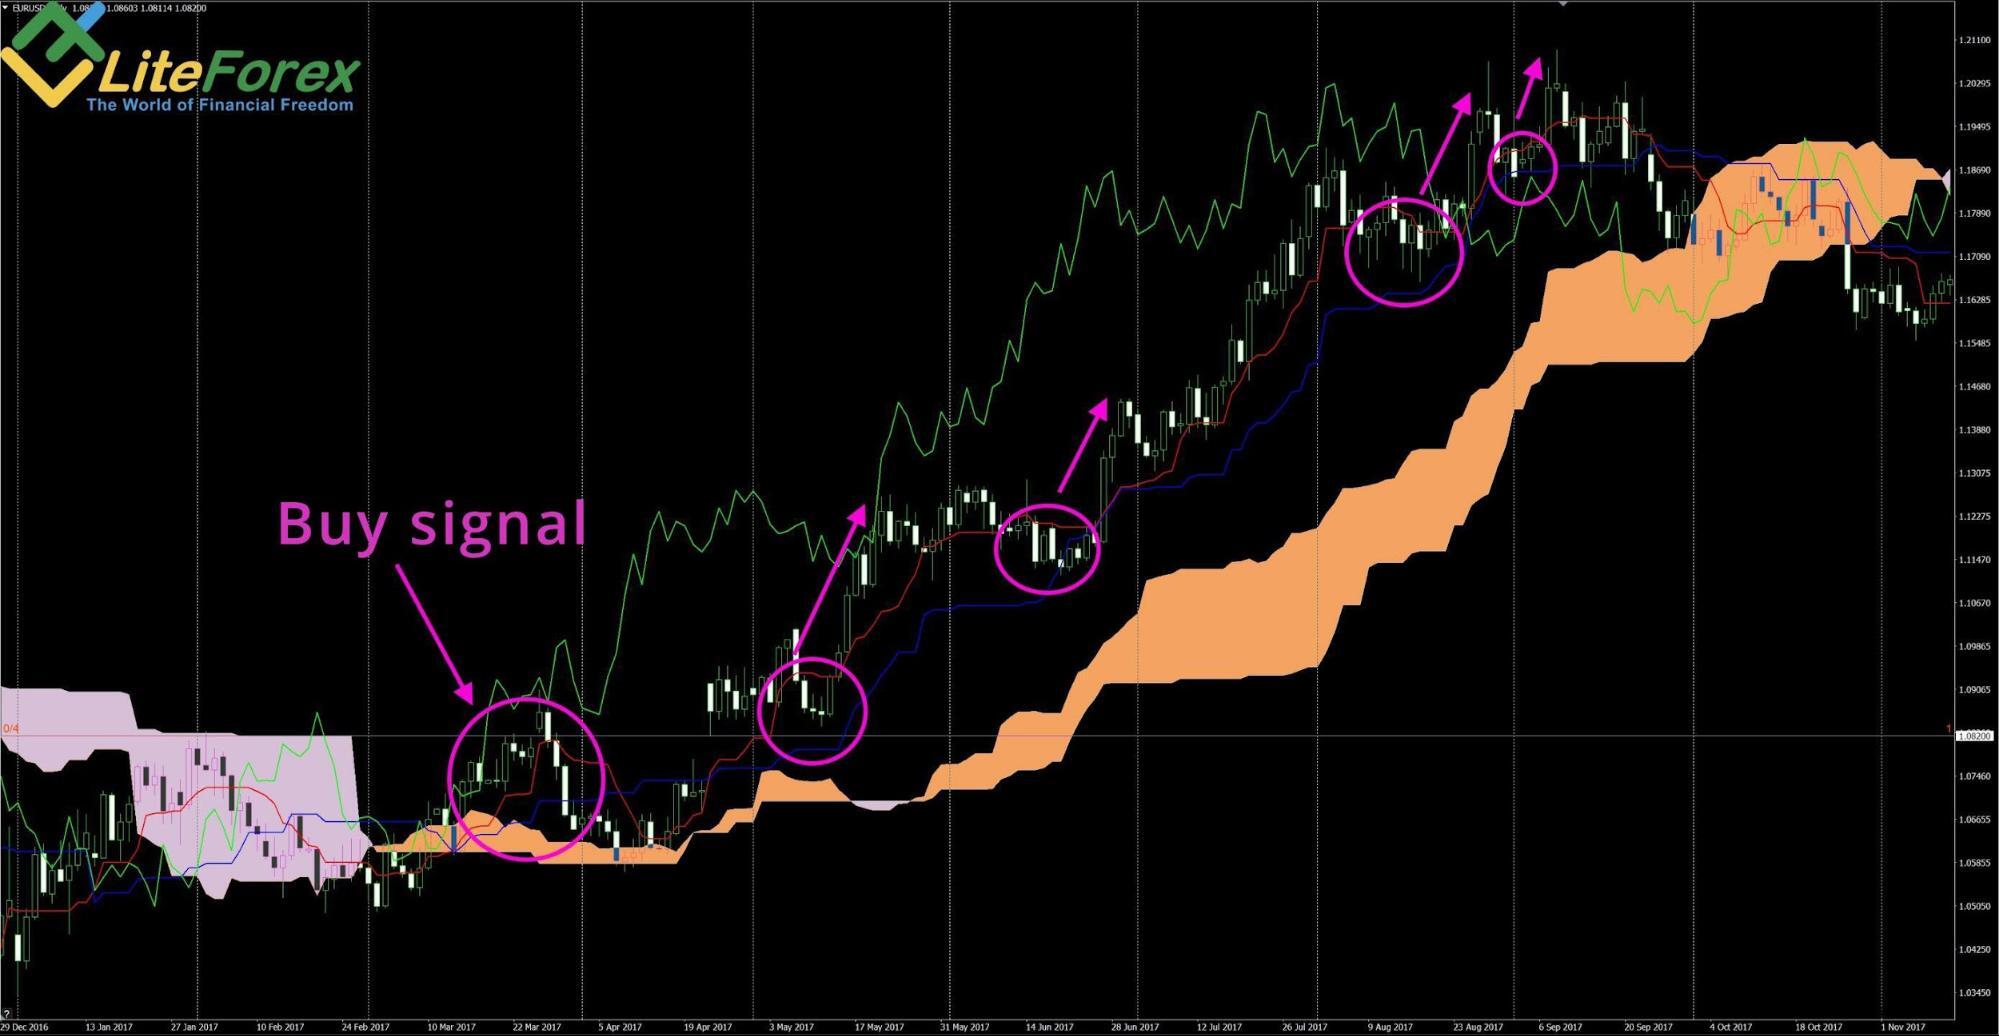
All the lines are arranged in the same direction
When all the indicator’s lines are facing in the same direction, there is a strong pattern that suggests entering a trade in the trend direction.
We see from the examples that the Ichimoku cloud, the Tenkan sen (conversion line) and Kijun sen are directed in the same direction, which indicates the entry direction.
Signals summary
As you can see, there are quite many patterns generated by the Ichimoku indicator. How to read Ichimoku cloud? At first, it can be difficult for a beginner to figure out which signal is delivered by a particular combination of lines and clouds. What trade should you enter according to a signal price and which cloud strategy would you choose? How much time should you hold the trade you enter?
I have made a classification of Ichimoku strategy signals to help you in future.
Note: Spot the signals in the daily timeframe.
Signal | Direction | Trend/note |
Golden Cross | bullish trend | Short-term |
Dead Cross | bearish trend | Short-term |
Tenkan and Kijun face up | bullish trend | medium-term |
Tenkan and Kijun face down | bearish trend | medium-term |
Orange cloud | bullish trend | Long-term |
Purple cloud | bearish trend | Long-term |
The price breaks out Senkou Span (leading span) B | bullish/bearish (according to the breakout direction) | It is an early signal price. You need additional confirming buy or sell signals |
Price is inside the Ichimoku cloud | Flat | Middle-term. You need to trade when the edges of the cloud kumo turns according to the Price Action signals or candlestick patterns |
Price is far from Chikou Span | Counter-trend | Trade in the long-term correction |
Price breaks out Chikou Span from below | bullish trend | Long-term |
Price breaks out Chikou Span from above | bearish trend | Long-term |
Japanese candlesticks in the Forex Ichimoku trading system

Ichimoku Sanjin stressed the importance of using the Japanese candlestick technical analysis when trading the Ichimoku signals. Without analyzing the patterns generated by the Japanese candlesticks, the probability that the trade entered according to an ichimoku strategy will be successful is about 60%-70%. However, if professional trades apply the analysis of Japanese candlesticks as an additional filter, they can reach an 80% chance of success or even more.
Here, the Ichimoku trading strategy becomes more complicated, and you will have to miss some signals. However, if you practice the candlestick analysis, you will achieve better results as you will cut the potential stop loss size, detail the entry point more accurately and exit the trades on time.
I recommend you confirm your ideas about the trading strategies to buy or sell within any Ichimoku system employing the signals delivered by simple candlestick patterns. You can also employ Price Action patterns. You do not have to learn and trade all the patterns in order to understand the price momentum.
Three or five most common price patterns will be enough, provided you use them often. After all, an indicator is just a derivative of the price moves, and the price chart is always primary. Only the price moves indicate the real market situation.
I covered in detail the most important price action patterns in the previous educational article, Price Action Forex strategies.
Ichimoku trading strategy
Let us study a real example of trading with the Ichimoku indicator. The Ichimoku cloud download indicator is a kind of independent trading system. So, we won’t employ any additional filters or analytical tools. We should trade according to the signals described in the article.
I will try to demonstrate a simple Ichimoku mq4 trading strategy. It is a medium-term trading strategy, so it may take quite a long time to hold the trade until there is a profit.
We shall not trade all the signals. Concerning this Ichimoku cloud strategy, I will cover only the simplest patterns for a beginner, such as the Golden Cross and the Dead Cross. A good not necessary entry condition is base line and conversion line alignment in the same direction.
Primary condition, we shall strictly follow are:
As Ichimoku is a trend indicator, we shall trade only with the long-term trend, which is indicated by the cloud’s color. The orange cloud signals buy entries, the purple cloud generates a strong sell signal sell.
A stop loss shouldn’t exceed reasonable limits. If it is greater than the weekly ATR, we won’t enter such a trade. We are going to trade in a calm market. What does it mean? It means that, following sharp price momentum movements in the daily chart, we shall expect the moment when the market goes back to norm.
After the price moves and hits significant extremes in the daily chart, we should move the trade to the breakeven.
A stop loss will be set either beyond the Kijun sen and Tenkan sen or beyond the cloud, according to which is closer to the entry point. In exceptional cases, a stop loss is placed beyond the nearest local high / low if the Tenkan Sen and Kijun Sen lines are too close to the current entry price.
Reward/Risk ratio will always be 2/1. So, the potential take-profit is twice as big as a potential stop-loss. This makes it easier to set the target profit.
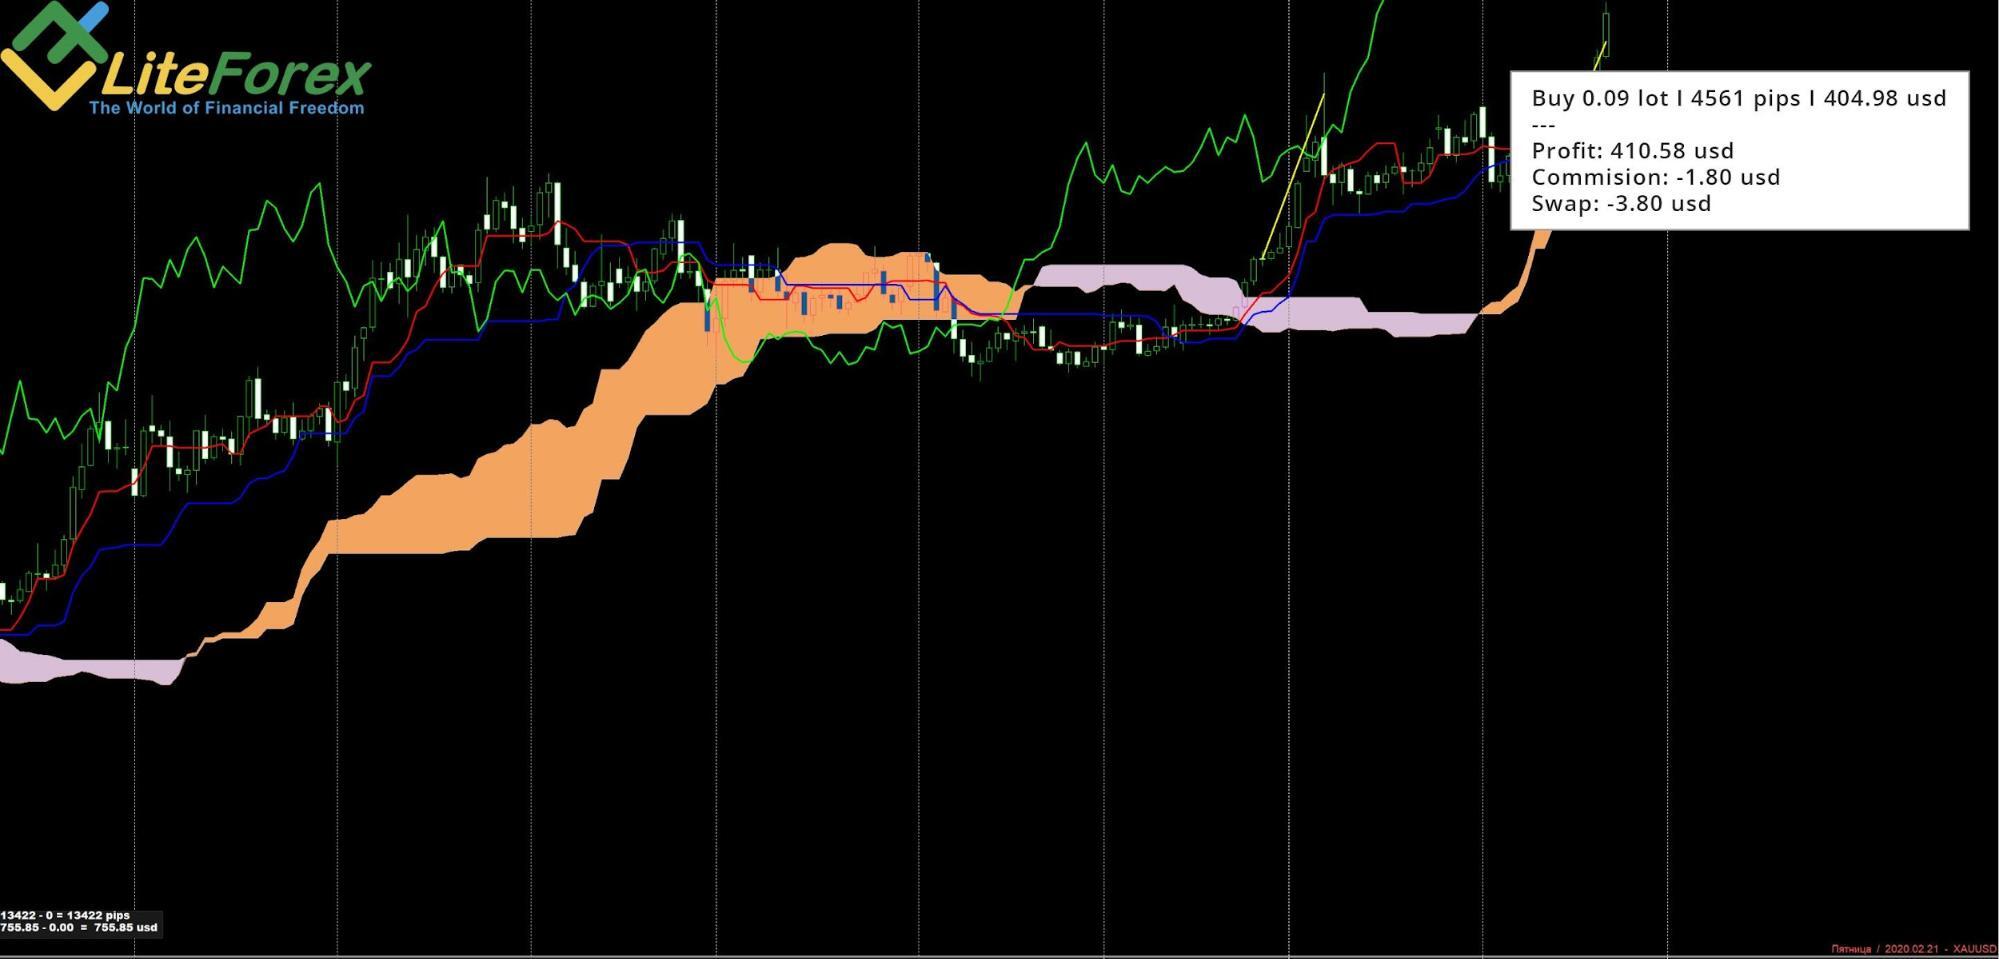
So, I open the first position on gold (XAUUSD) according to the Ichimoku strategy on December 27 2019. All indicator settings are standard. You see from the below screenshot the chart drew a golden cross pattern to buy on 12-13 December. However, the cloud indicates a strong sell signal that pushes to a long-term downtrend and a significant bearish sentiment. Next, I do the following. I expect until the cloud kumo turns orange, i.e. the long-term trend turns up. If the golden cross pattern is still relevant, I entered the trend.
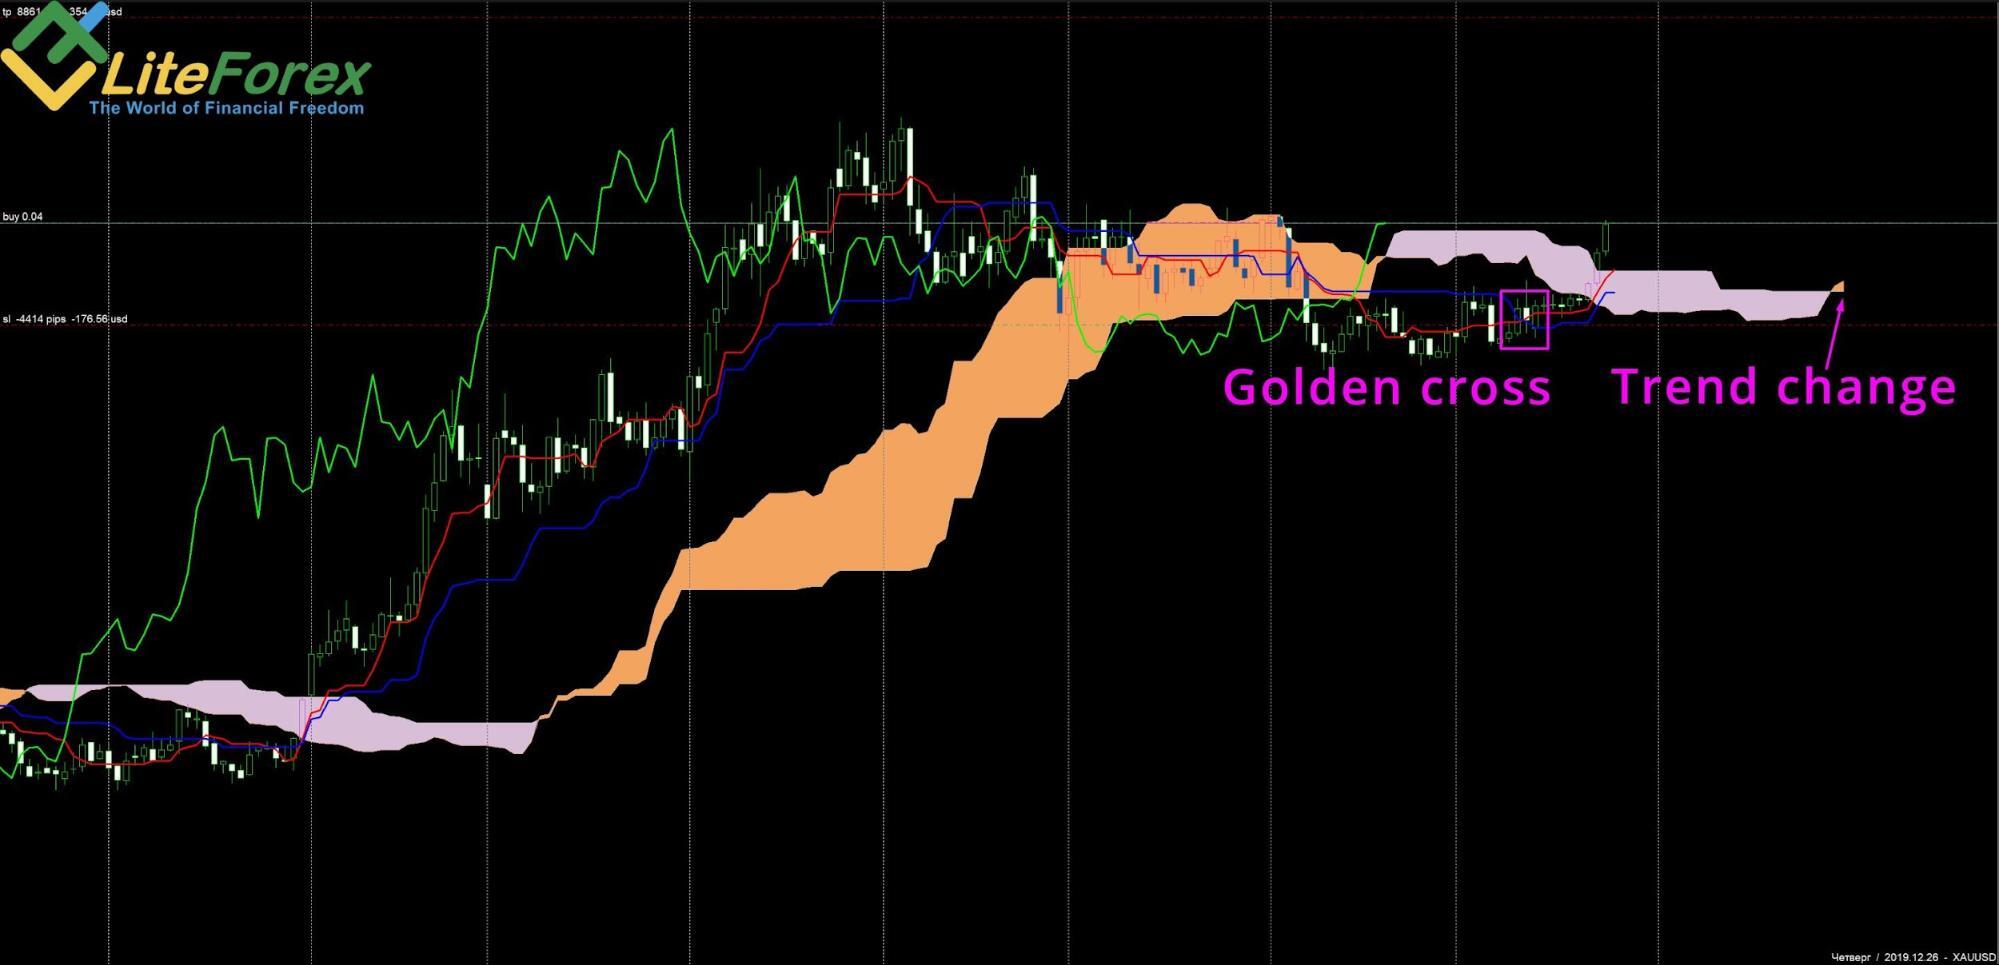
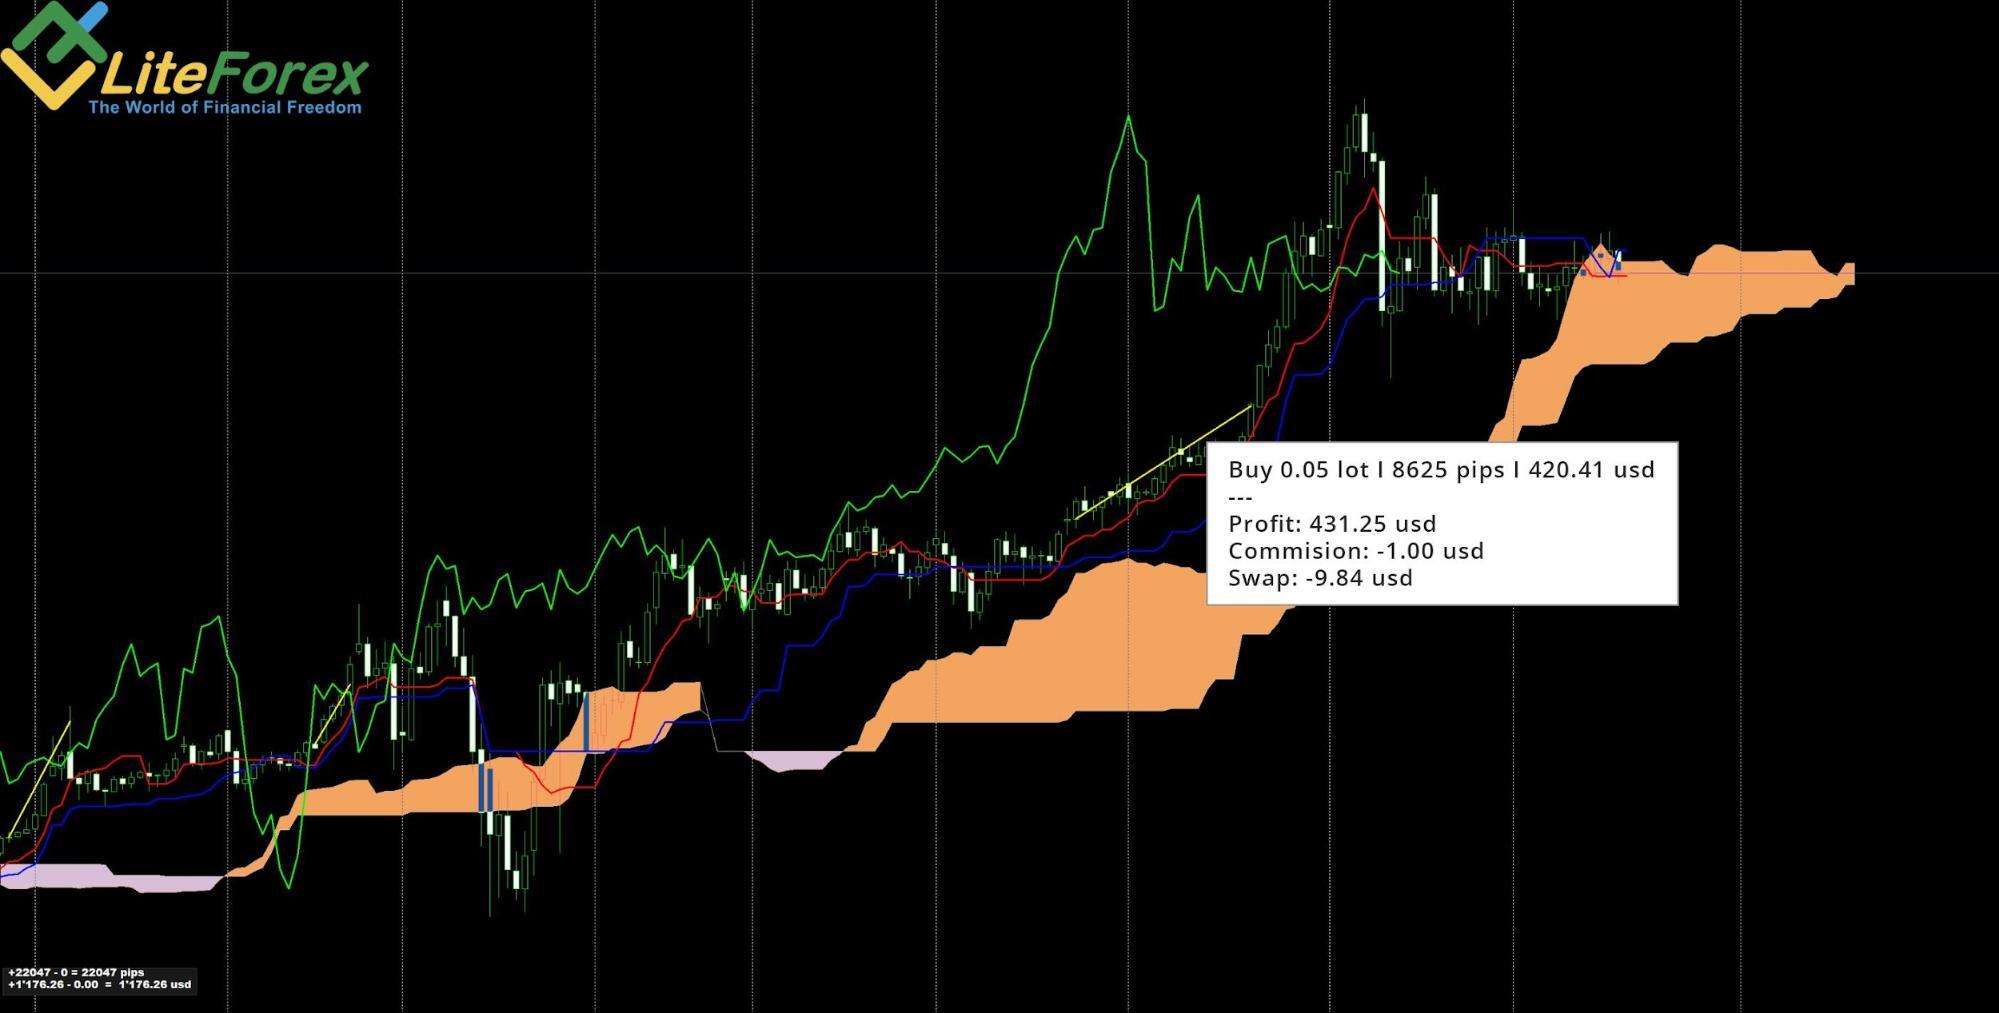
Some time later, the price momentum breaks through a significant high, the high of September 2019. I move the trade to the breakeven.
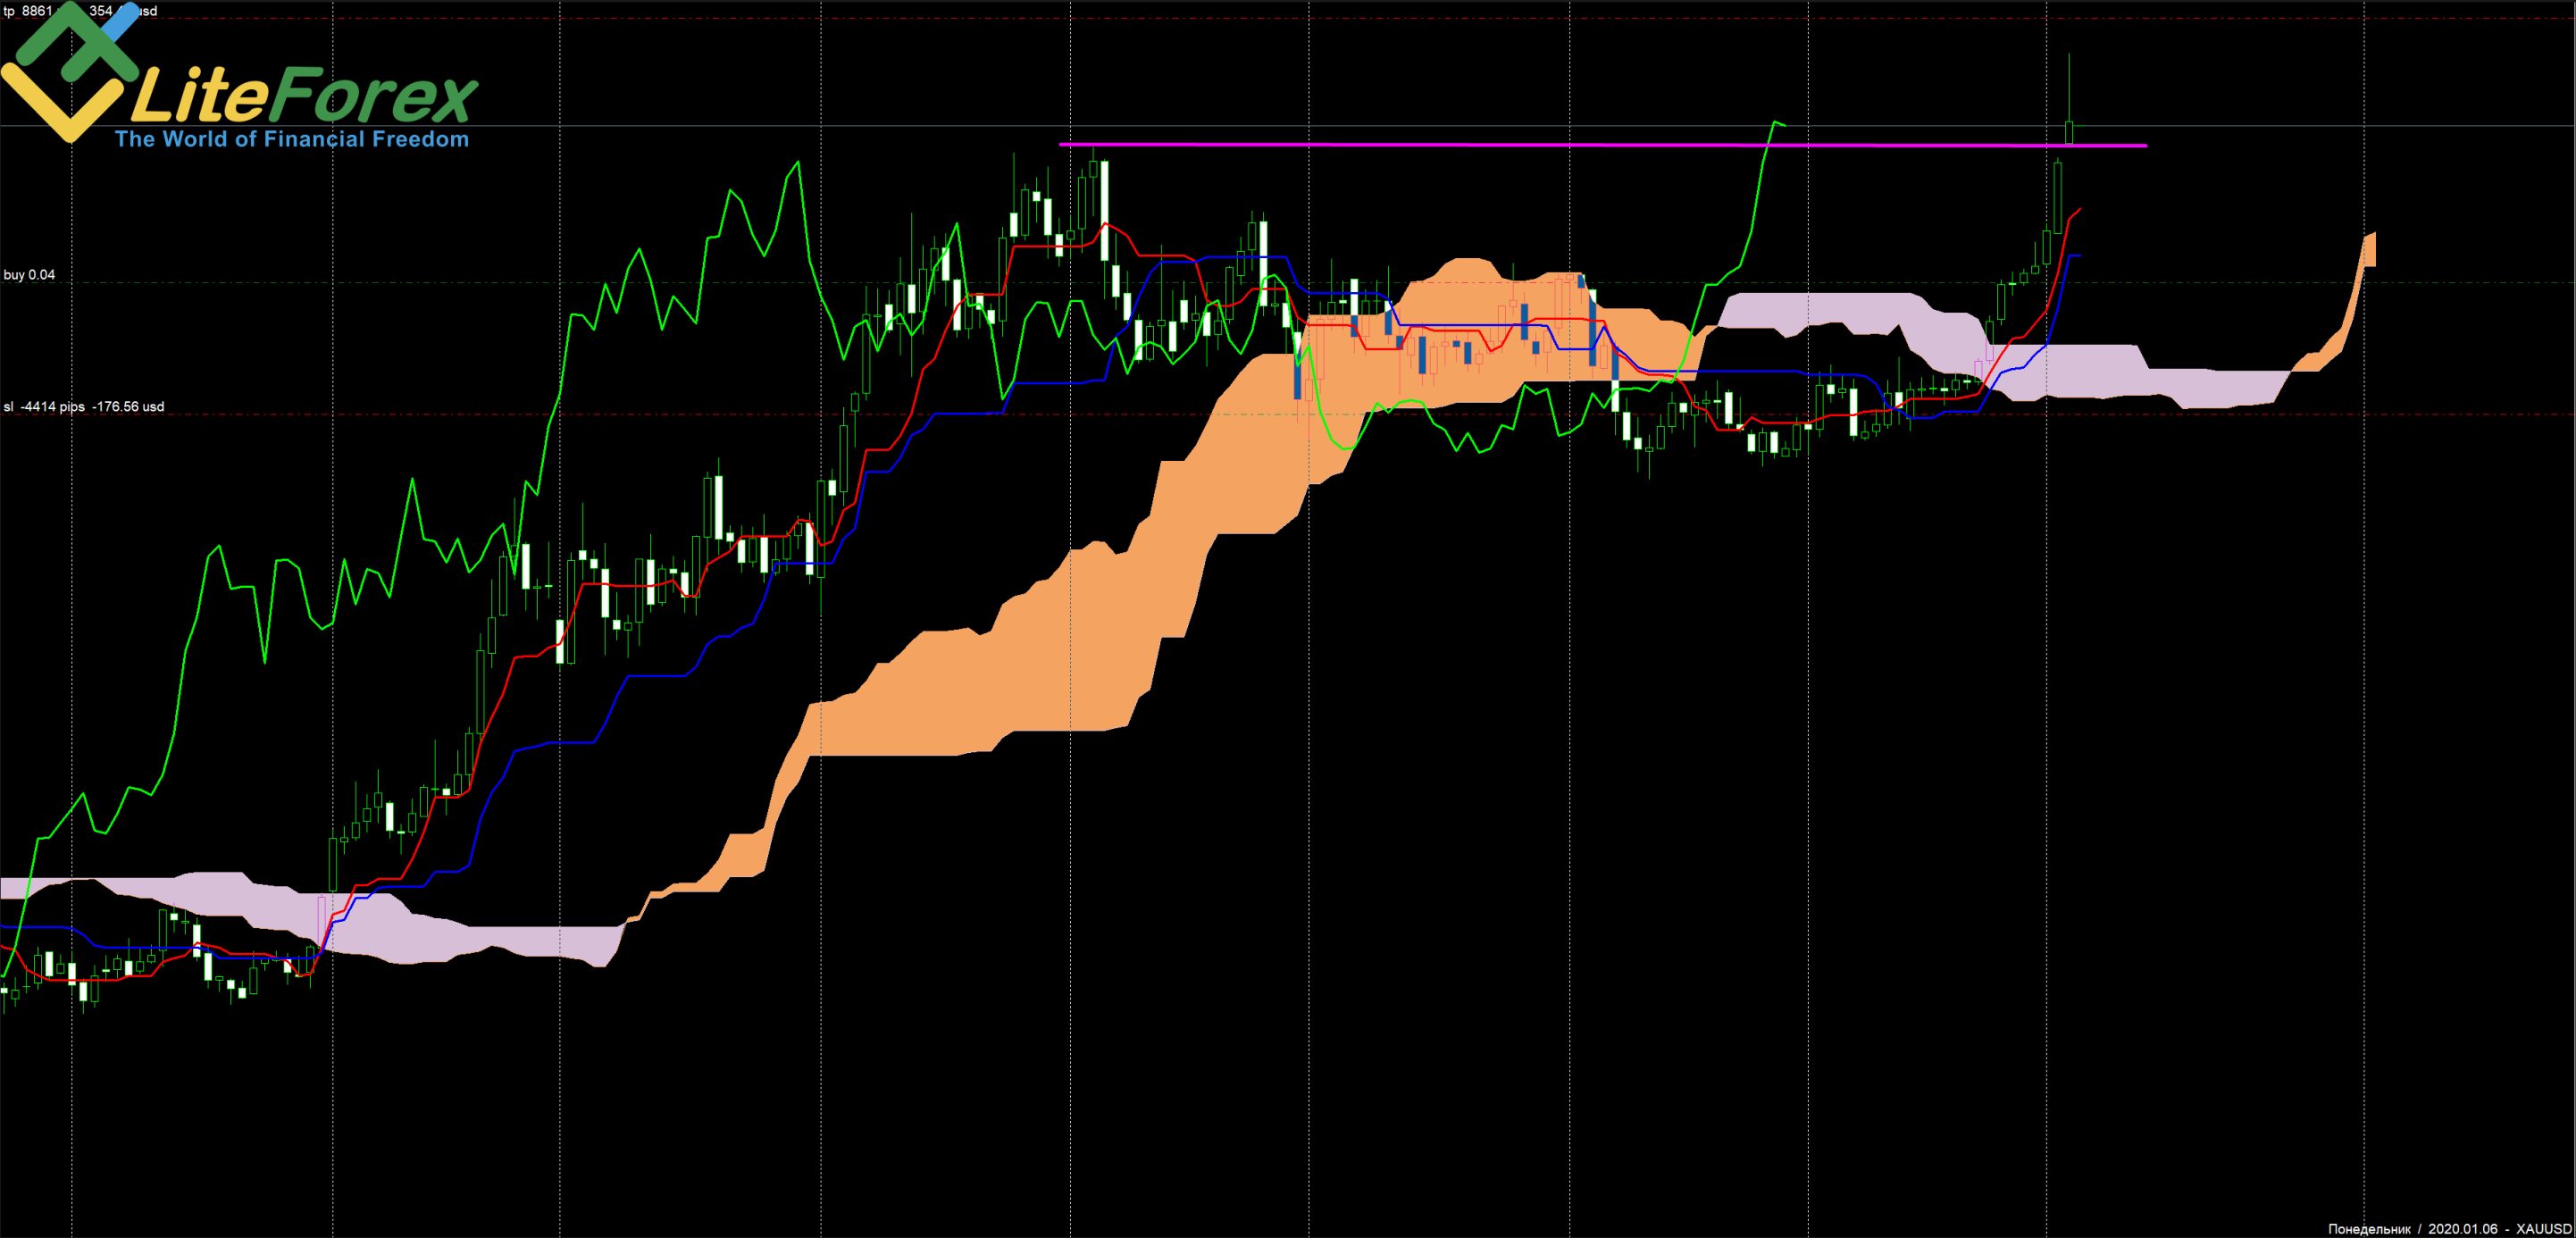
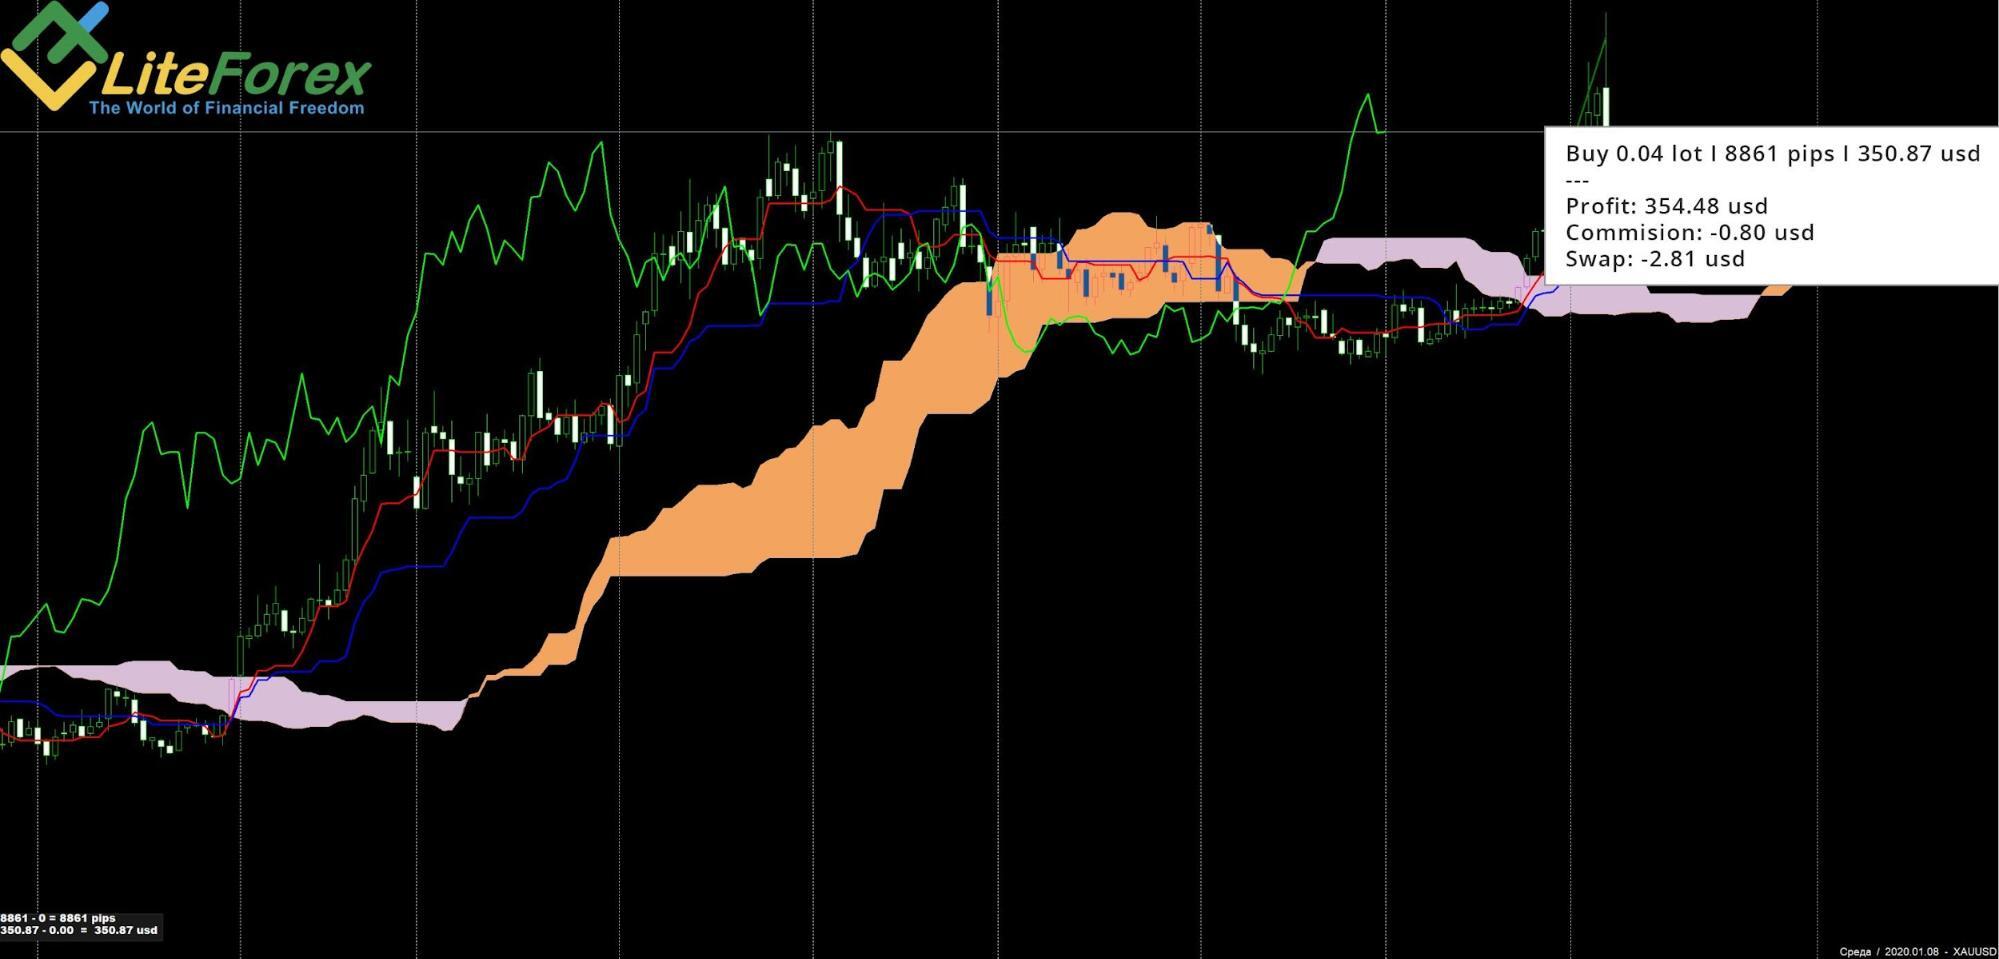
A day later, the trade is closed by the take profit.
Based on Ichimoku charting, I enter the next trade on gold in six weeks. There is a long-term uptrend with a strong bullish sentiment, according to the orange cloud. A golden cross forms on February 14. I open a buy position.
The price moves and breaks through the local high, I move the trade to the breakeven.
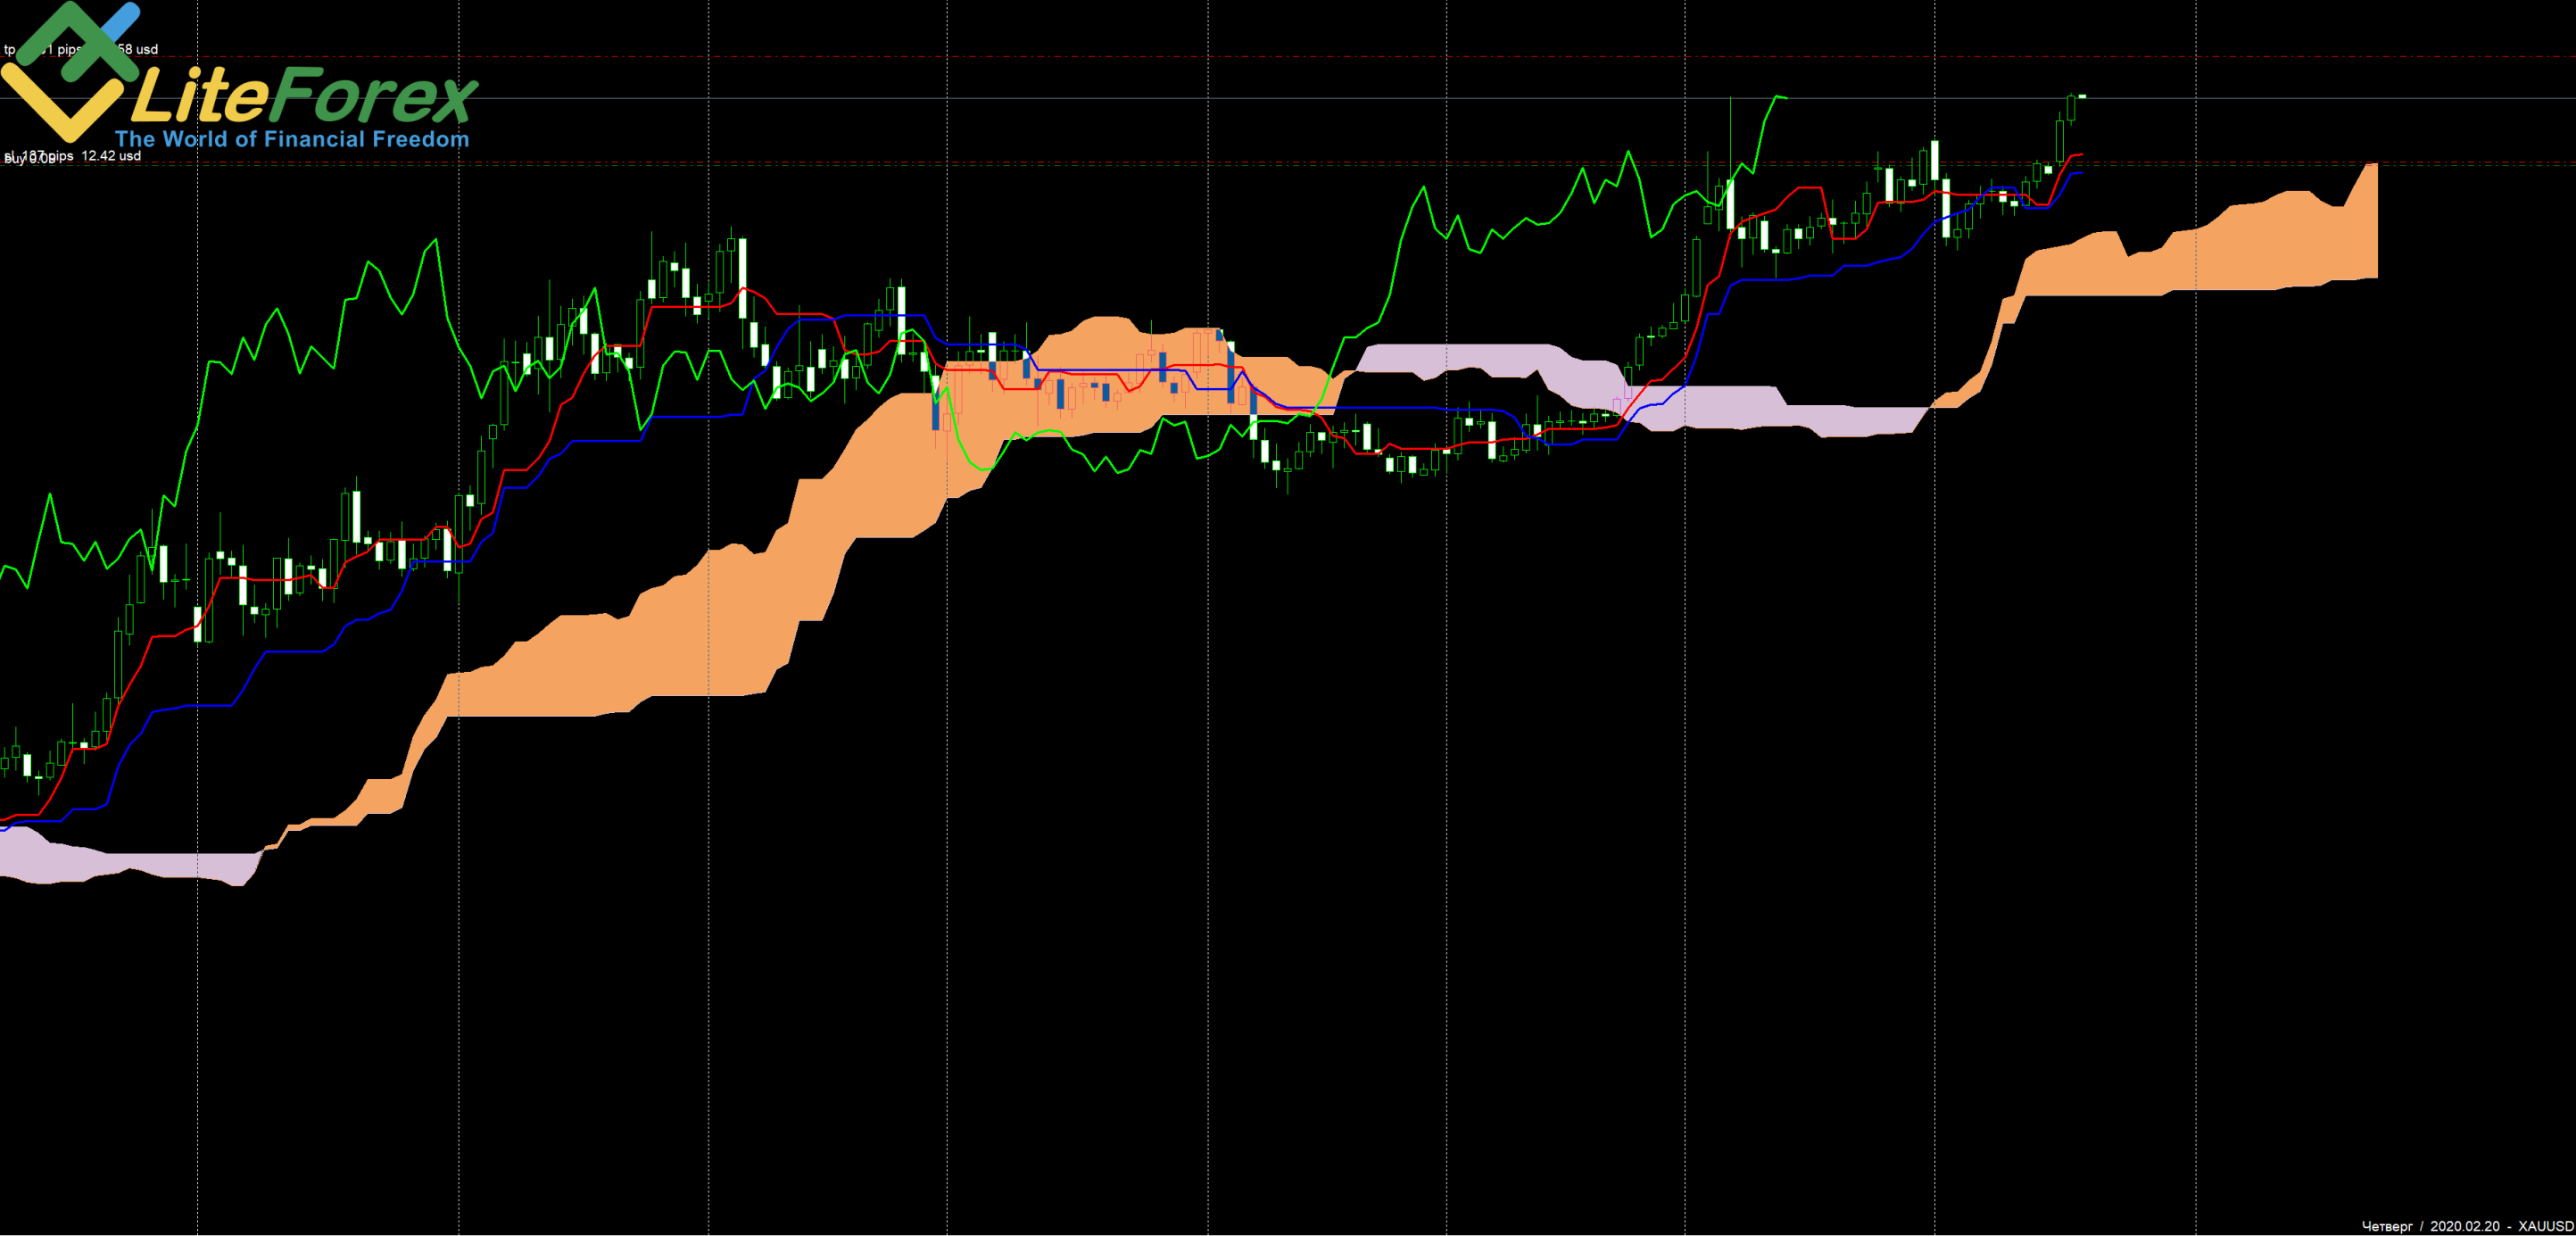
A few days later, the trade is closed by the take profit.
Now, I will demonstrate to you examples of the high market volatility. According to rule 2 of the trading system, we shouldn’t enter trades in a highly volatile market, as the stop-loss exceeds an average weekly closing prices change. 700-800 is a very high value for a stop loss. We shall expect until the market stabilizes.
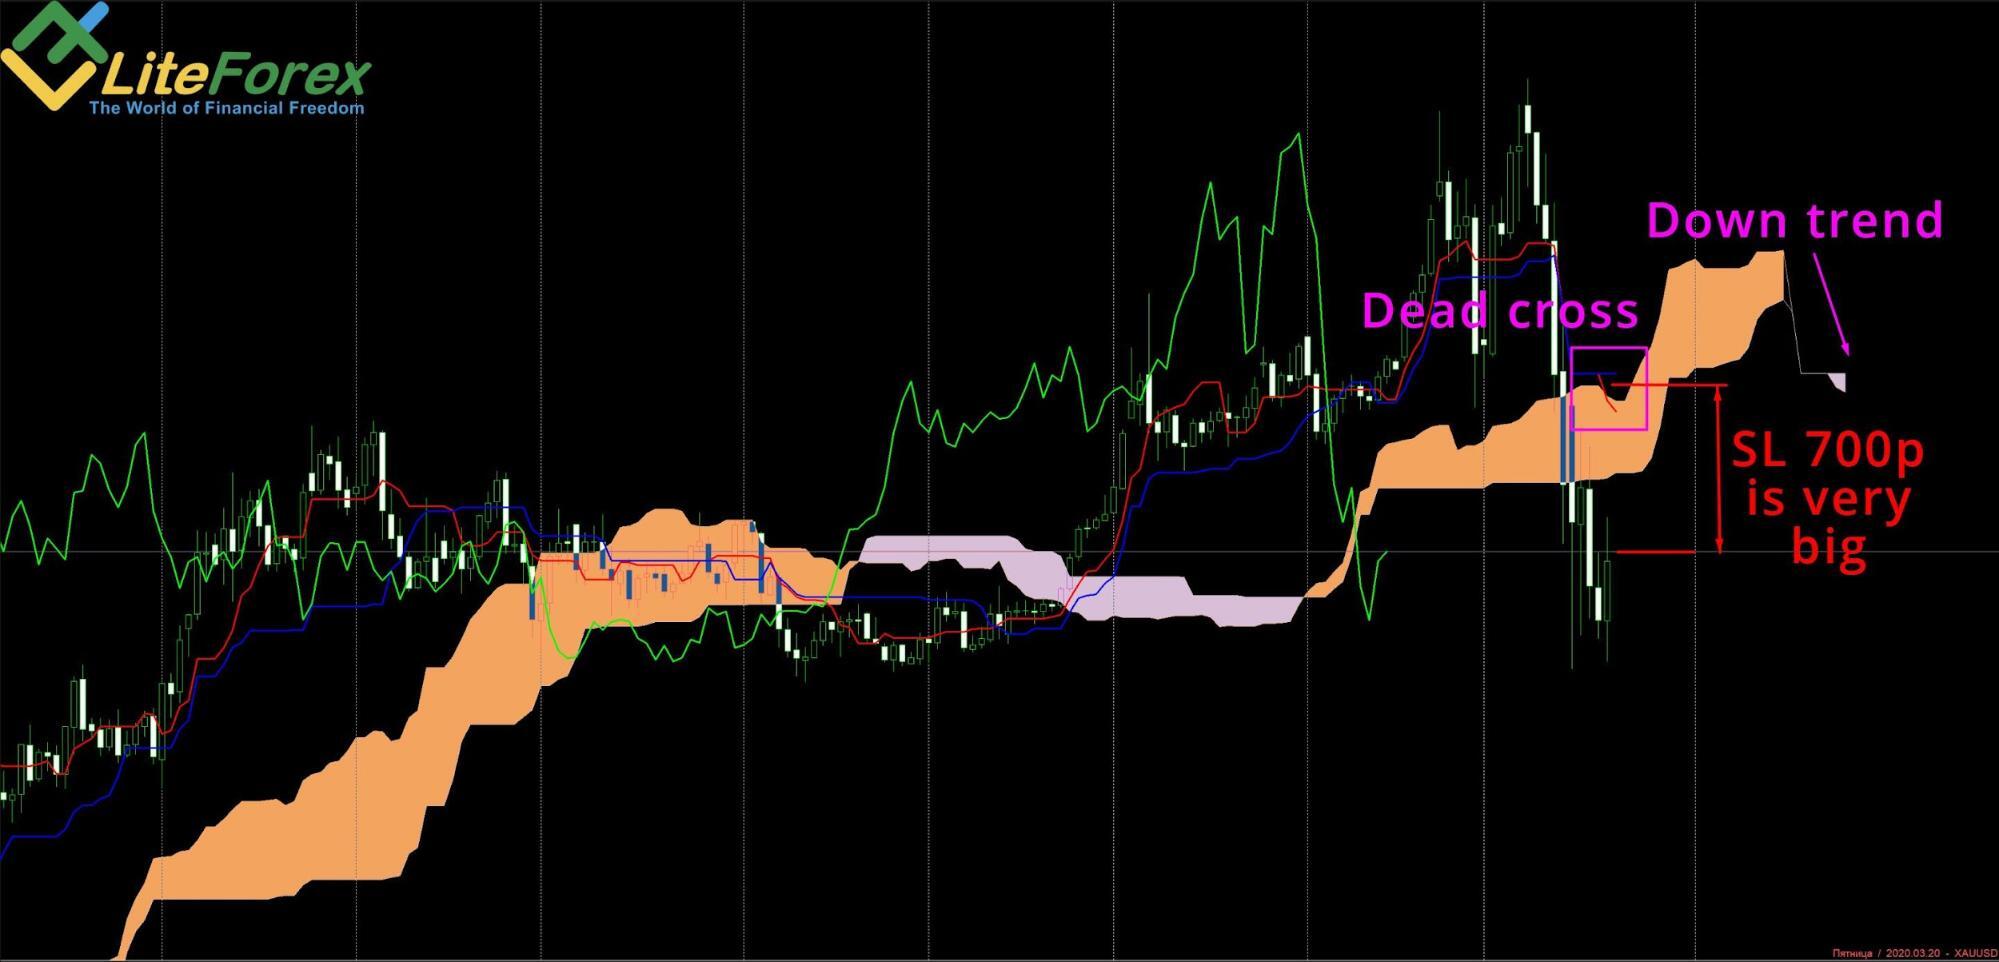
I miss another trade after the long-term reverses up again. The price jumps back to the price levels, recorded in the February-March period 2019. Here, I don’t enter a trade because the size of the potential stop loss is not appropriate.
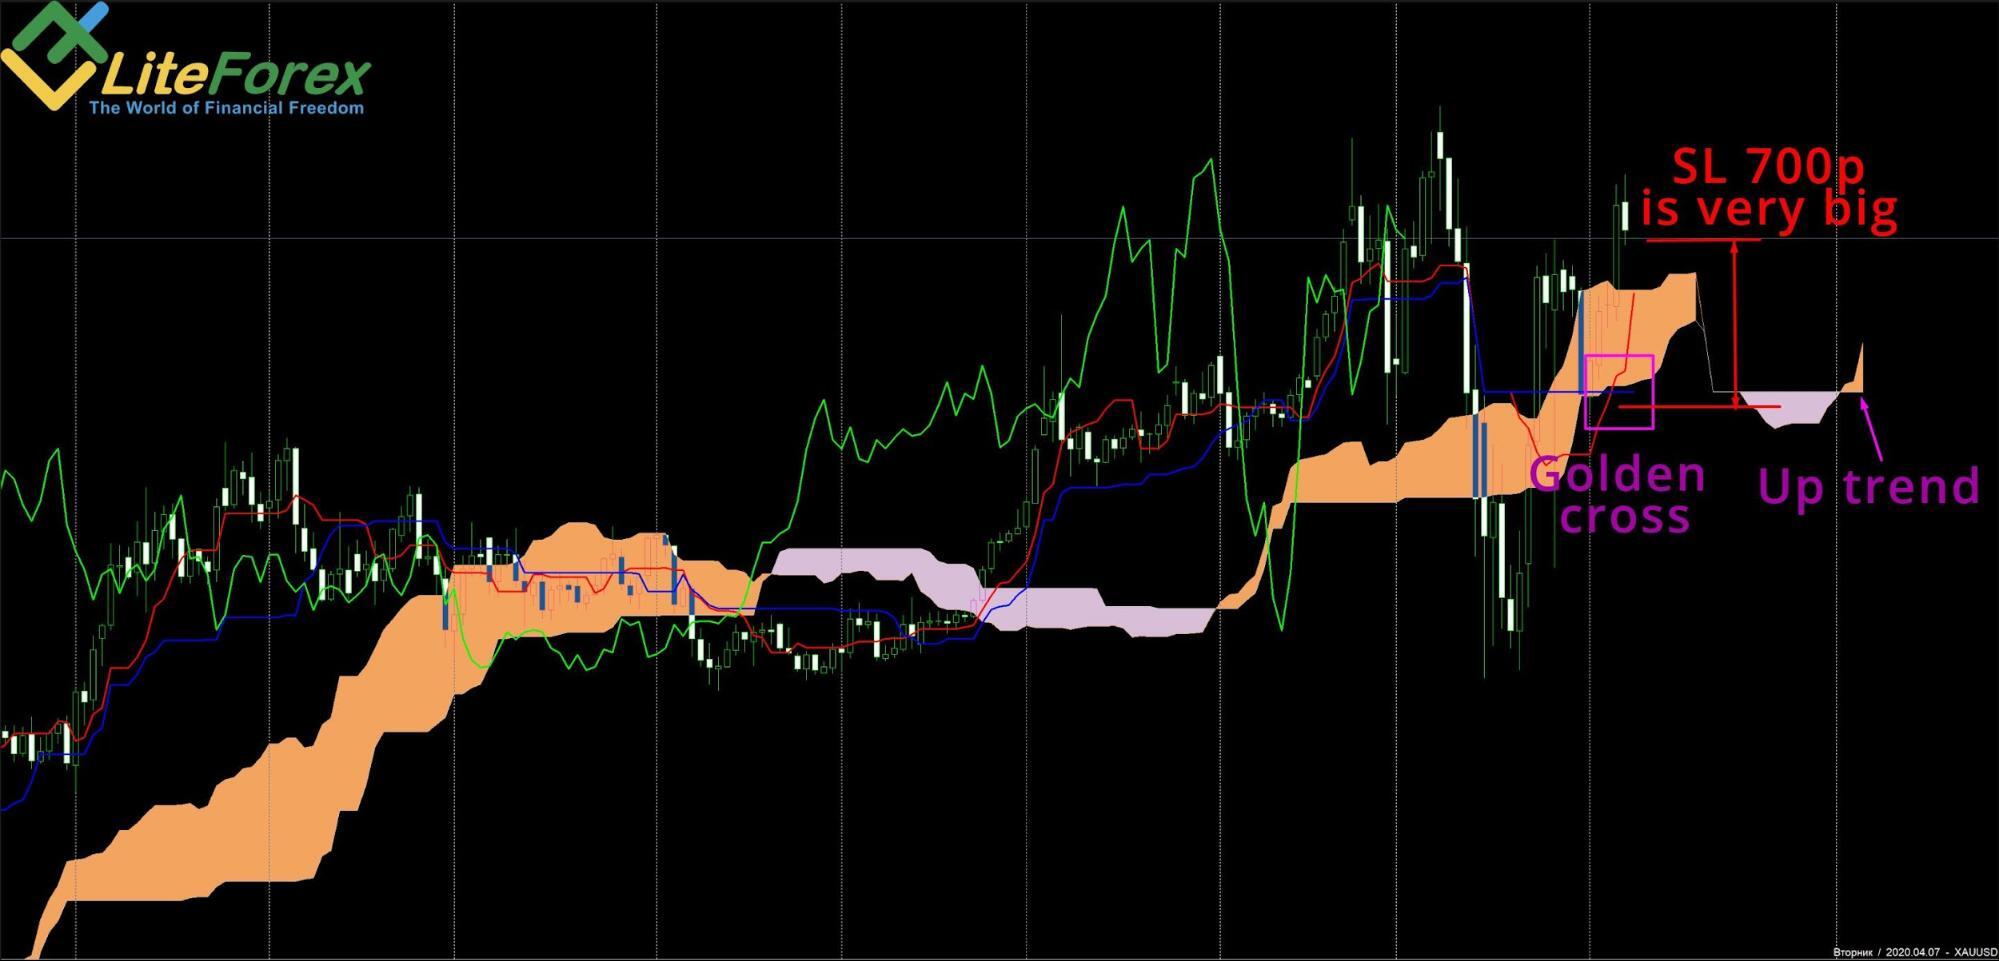
I enter the next trade in the long-term uptrend after three months of waiting.
A month later, the position is closed by a take-profit order. I forgot to make a snapshot when I closed the trade, so I made it at the time of writing.
As you see, it is quite simple to choose Ichimoku cloud as your trading strategy. I demonstrated you a simple trading strategy based on two Ichimoku signals, the Golden Cross and the Dead Cross patterns. These signals must correspond to the ongoing global trend, as Ichimoku is first of all a trend indicator.
If you trade only these two patterns, you will receive quite a few signals for instruments in a year. However, the signals will be very accurate. If you want to enter more trades, you should learn other Ichimoku patterns and trade more financial instruments.
The most important rule is that you shouldn’t enter trades counter the trend and when the market volatility is very high. You’d better wait for some time and even miss a trade than take an unreasonable risk of a loss.
Conclusion and a trader opinion of Ichimoku Kinko Hyo
The Ichimoku cloud strategy is the most complicated tool among standard momentum technical indicators included in most trading platforms. This is a free indicator, which is an advantage.
Although the Ichimoku signals seem complicated to read, any trader can understand the Ichimoku indicator and understand the market sentiment.
Of course, I recommend all traders to study and use in practice this powerful technical tool. Basically, it is a complete trading strategy suitable for all investors. It considers trading with the trend, flat, and trading in the correction.
If you are a newbie, I recommend you to start studying the Ichimoku indicator and trading strategies using a long-term trend. When you go through this stage and gain more trading experience, you can employ other patterns as well.
Do not forget to confirm your trading ideas to buy or sell with candlestick patterns. This will allow you to be more confident when making trading decisions and get a better Reward/Risk ratio. I think using a Price Action Forex strategy when you consider entries at the key levels will help you increase the final profit.
It can take you quite a long time to master the Ichimoku system, but it is obviously worth studying, as the chance of a win is about 80% when you learn to employ all the capacities of the Ichimoku indicator.
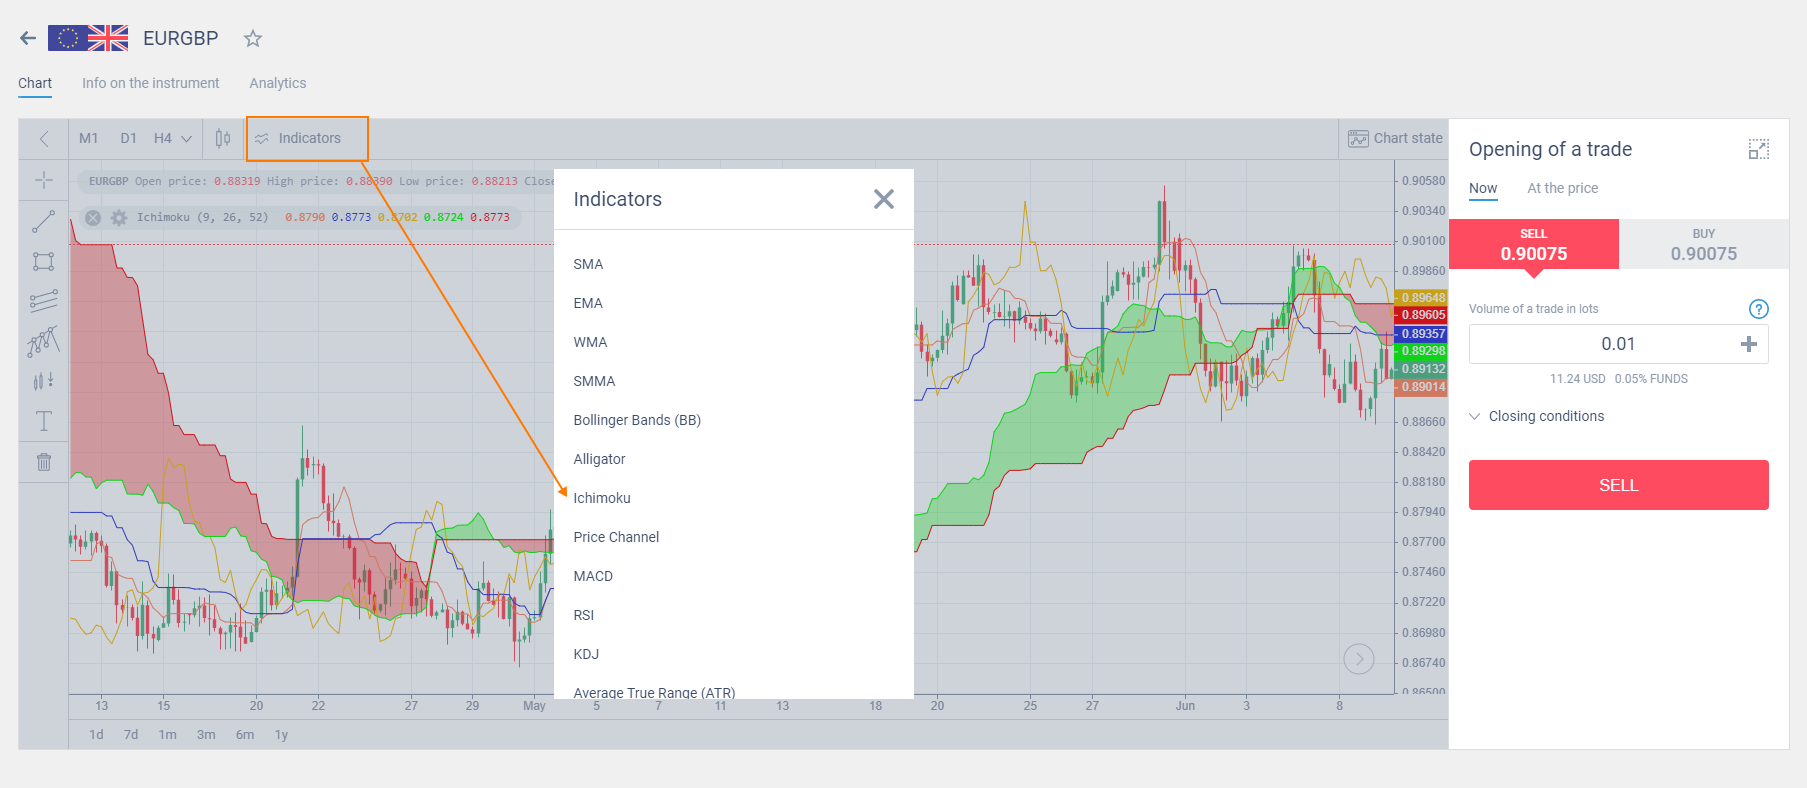
The Ichimoku indicator is available in the MT4 platform for free and is one of the built-in indicators in it. I recommend using LiteFinance online platform in the beginning of your journey as a trader — there the Ichimoku indicator is also one of the built-in ones.
How do we trade cryptocurrency with Ichimoku indicator?
Let us consider Bitcoin:
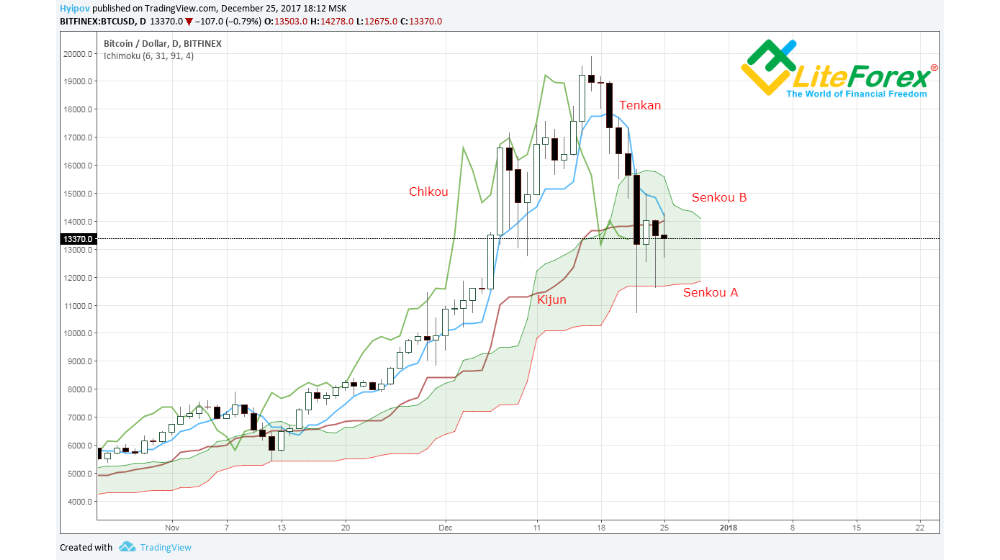
In the BTCUSD daily chart, we see that the ticker climbed into the green cloud, which means the market is in a situation of uncertainty. Meanwhile, leading span A in this case is a strong support level line, and, leading span B is a resistance line.
The intersection of Tenkan (blue line) and Kijun (burgundy) lines means a trend reversal.
But Kijun often acts as a support line for bitcoin, from which Tenkan constantly bounces with a small puncture down.
Here, Chikou (the green price moves line) can act as a confirming bullish signal, its crossing of the quotation from the bottom to the top gives a signal price to buy (from top to bottom bullish cross — for sale).
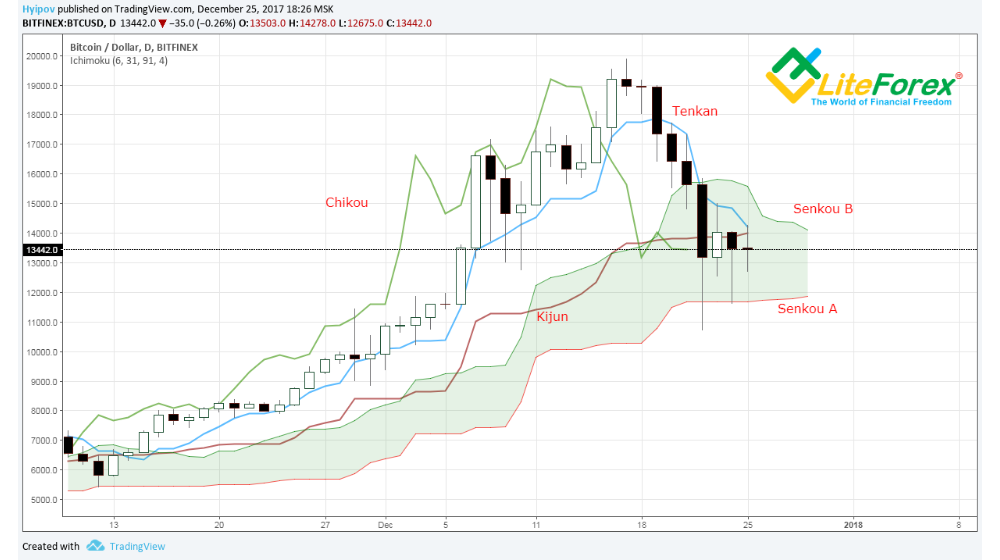
If we look at a larger picture, we see that the chart has rebounded from the lower cloud boundaries of the green cloud with a small puncture and now a reversal pattern is being formed, where we need to wait for the following signals for a purchase.
Tenkan sen line (blue) rebounding from Kijun (burgundy) up;
Chikou price chart puncturing from bottom up;
- Price ticker exit from the cloud with piercing of the upper boundary — leading span B.
Accordingly, the following signals will mean the reversal of the trend, and hence the consolidation of long positions:
Passing Tenkan Sen line (blue) through Kijun (burgundy) from top to bottom;
- Price ticker exit from the cloud with piercing of the lower boundary — Senkou (leading span) A.
However, it is still too early to make final conclusions about where the price will move in the near future.
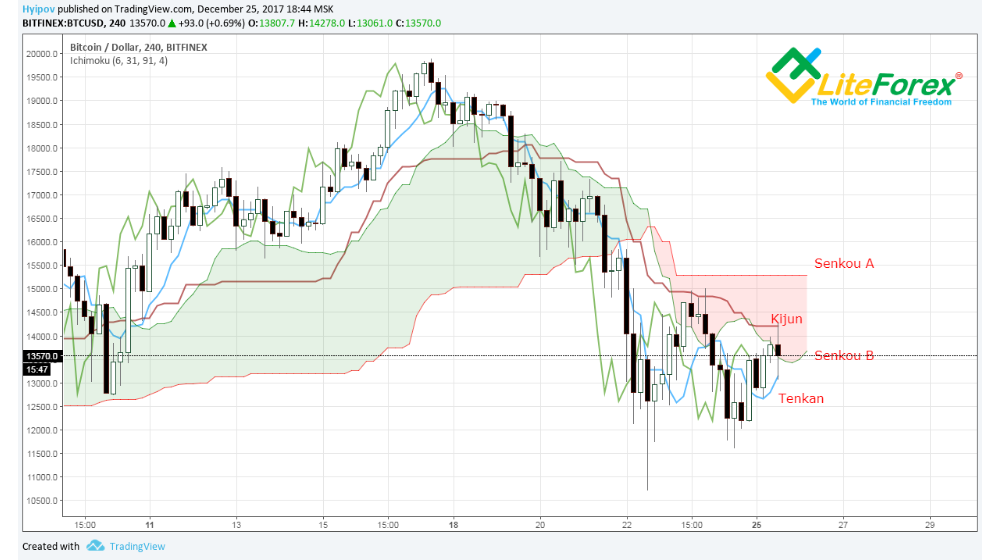
If you look a little deeper, in the 4-hour chart, BTCUSD price moves below the cloud, where Kijun acts as a resistance line before the cloud kumo turns red.
So that the final upward reversal will be signaled by the situation in which the chart will come out of the cloud, breaking all the resistance levels and consolidating at a level of 15,500 where the cloud kumo turns red, but for now the continuation of a lazy correction smoothly turning into a flat is more likely.
At least, these are the signals that this remarkable Ichimoku indicator gives us.
The author Goichi Hosoda recommended using the signals of this indicator together with candle analysis (which, incidentally, originated in Japan too)
Together, they provide a fairly transparent picture of what is happening and unveil the possible development of events for the medium-term future.
With the skillful use of the Ichimoku strategies together with other signals, it will be your ticket to a cloudless future!
I wish you successful trading. You can write any questions concerning the Ichimoku system in the comments below this article. I will be glad to answer.
With respect, Alex Rodionov.
Ichimoku Cloud FAQ
Here is Ichimoku cloud explained. This chart is made of five lines, each of them has a strict mathematical justification and reflects one of the characteristics of the current trend.
1. Tenkan sen line indicates the price action, the sharper the line, the stronger the trend.
2. Kijun sen projects the future market moves. If the price moves above the top line, the market is likely to go up following a strong bullish trend, and vice versa.
3. Senkou leading span A and Senkou leading span B make up the so-called cloud, defining the market volatility. When the price moves within the cloud, the market is going sideways.
4. Chikou Span delivers buy or sell signals . If the Ichimoku Chikou line breaks out the price base line upside, buy; if it breaks the price chart downside, sell signals.
The Ichimoku technical analysis tool is a leading indicator, it can be used to anticipate the market situation in the medium-term and long-term outlook. Senkou Span A and B lines are leading and form the Ichimoku Cloud. The clouds projected into the future give clues on possible movements of the trend.The Ichimoku cloud is a popular indicator among traders who trade in various markets, in Forex, stock market or cryptocurrency. The primary benefit of the indicator is that Ichimoku system is a complete trading system that analyzes different trends (short-term, medium-term, long-term) and can generate trading signals, to trade both in the trend and in the correction. The indicator seems quite complex, but if you study it in detail, you will understand the signals and make a thorough market analysis.
The Ichimoku indicator is a complex indicator which could serve as an independent trading system. It doesn't require any additional indicators. If you wish, you can add an indicator of futures volumes and an indicator of Price Action patterns for better detail of entry points.
Ichimoku strategies perform the best in the weekly and daily timeframes. In fast markets, you can use the Ichi cloud support and resistance lines in the four-hour timeframes. The best time frame for the Ichimoku cloud system starts from D1. I do not recommend trading in the timeframes shorter than four hours as for example an hourly chart that some traders prefer. You can use default customs in weekly and daily timeframes. In shorter timeframes, you will have to custom Ichimoku indicator MT4 parameters and experiment with the variables’ values.
The Ichimoku technical indicator was developed by Goichi Hosoda in the 1930s. The Ichimoku indicator is in the standard list of tools of most trading platforms. The Ichimoku is quite popular among position traders and helps them identify strong trends. All those indirect evidence suggest the indicator be reliable. If you are not confident, you can test the Ichimoku trading strategy on a demo account, or test Ichimoku cloud strategy for intraday trading on a real account with a small deposit. Moreover, you can also use other technical indicators in conjunction with Ichimoku cloud, like Relative Strength Index, to spot potential large price movements in the future.
The Ichimoku indicator is not so good for intraday trading. It performs the best in middle-term and long-term trading. This is because the indicator developer, Goichi Hosoda, put in the settings of the main lines the number of working days per month in the Japanese financial markets. Other parameters in the settings are also based on the number of working days. If you want to use the Ichimoku for day trading, you will have to change the standard settings and adjust them to the shorter timeframes. There are other technical tools that will perform better than Ichimoku cloud kumo day trading and boost your initial investment such as the macd indicator, the relative strength index, etc.
P.S. Did you like my article? Share it in social networks: it will be the best "thank you" :)
Useful links:
- I recommend trying to trade with a reliable broker here. The system allows you to trade by yourself or copy successful traders from all across the globe.
- Use my promo code BLOG to get a 50% deposit bonus on the LiteFinance platform. Simply enter this code in the appropriate field when funding your trading account.
- Telegram chat for traders: https://t.me/litefinancebrokerchat. We are sharing the signals and trading experience.
- Telegram channel with high-quality analytics, Forex reviews, training articles, and other useful things for traders https://t.me/litefinance

The content of this article reflects the author’s opinion and does not necessarily reflect the official position of LiteFinance broker. The material published on this page is provided for informational purposes only and should not be considered as the provision of investment advice for the purposes of Directive 2014/65/EU.
According to copyright law, this article is considered intellectual property, which includes a prohibition on copying and distributing it without consent.