The DeMarker indicator, also called DeM, is an oscillator-type technical indicator created in the 1980s by the famous trader Thomas DeMark. The DeMarker formula compares the most recent period's peak high and trough low prices with those from the previous period. This comparison helps determine potential market trends as well as overbought and oversold conditions.
The key benefit of the DeMarker indicator is its ability to alert observant traders to exhaustion points in the current trend, signaling probable imminent reversals. When properly incorporated into a robust trading plan alongside other confirming indicators, the DeMarker can be a valuable tool in helping traders make higher probability decisions. But it should be considered as something different than a standalone system.
The article covers the following subjects:
Major Takeaways
The DeMarker (DeM) indicator offers some valuable insights for traders when applied prudently, including:
- The indicator formula compares the current period's peak high and lowest low to the prior period's values, calculating the difference between them. More considerable differences drive the indicator toward overbought or oversold thresholds.
- Readings above 70 indicate potential overbought conditions and upside exhaustion, while levels below 30 signal possible oversold conditions and downside exhaustion.
- DeMarker can alert traders to probable imminent trend reversals or pauses as it approaches these overbought or oversold thresholds.
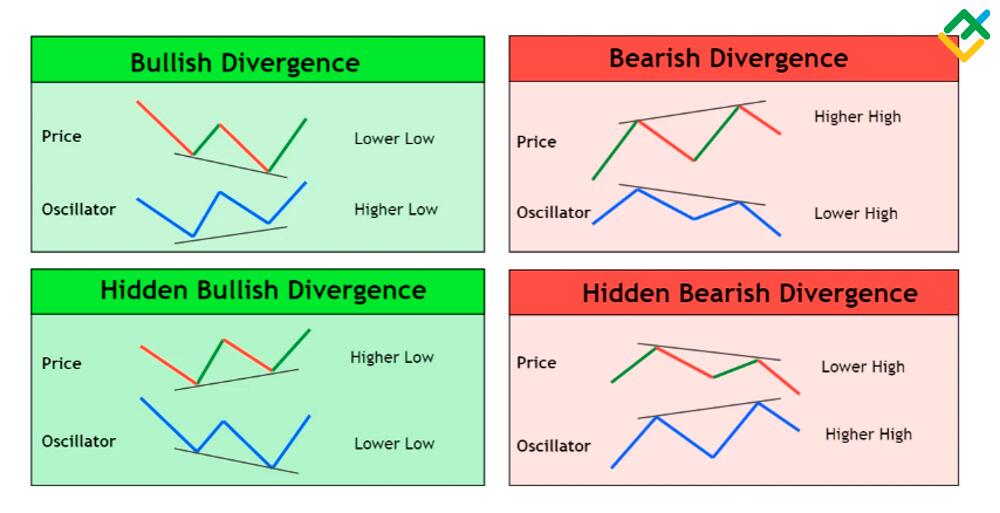
- Divergences between DeMarker and price, such as lower DeM highs as price makes higher highs, can identify hidden momentum shifts ahead of the trend change.
- DeMarker strategies work best when incorporating other confirming signals like candlestick patterns, additional oscillators, or trend filters rather than relying solely on DeM.
- Key strategies include using DeMarker for overbought/oversold reversal trades, identifying divergence setups, or as a filter for other indicator signals.
- Customizing the indicators lookback periods and thresholds for each market traded can optimize performance. The default 14 periods may be better.
- No indicator provides guarantees. DeMarker works best as part of a complete trading plan incorporating sound risk management practices.
How the DeMarker Indicator Formula Works
The DeMarker indicator formula seems complex at first glance but is based on comparing the most recent highs and lows to the values from the previous period.
Specifically, the DeMarker formula is calculated as follows:
DeM = (Max(high - previous high, 0)) / (Max(high - previous high, 0) + Max(previous low - low, 0)) * 100
Where:
- Max(high - previous high, 0) = The difference between the current bar's high price and the last bar's high price. If the difference is negative, it uses zero in the calculation instead.
- Max(previous low - low, 0) = The difference between the current bar's low price and the last bar's low price. Again, if the difference is negative, it substitutes zero into the formula.
This comparison looks at the current period's peak high price and lowest low price relative to the prior period. The more significant the difference between the current lows and previous lows, current highs and previous highs, the further the DeMarker indicator value will shift toward its overbought or oversold threshold levels.
The standard DeMarker settings use 14 periods for the historical lookback and calculation. Readings above 70 are considered overbought conditions, while below 30 indicate oversold conditions. However, traders can customize these parameters as needed.
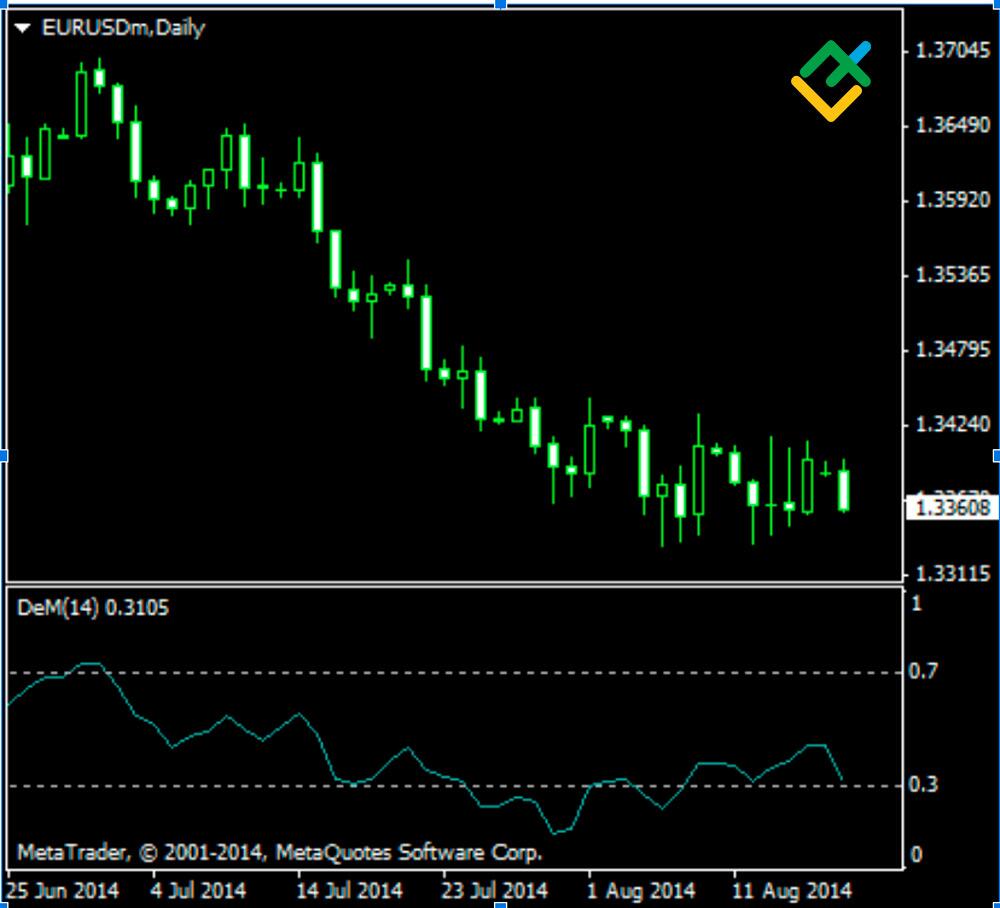
How to Interpret DeMarker Values
The DeMarker indicator oscillates between a scale of 0 to 100. Values approaching the upper threshold level of 70 highlight potential overbought conditions and upside exhaustion in the trend.
Conversely, readings dropping close to the lower threshold around 30 signal possible oversold conditions and downside exhaustion.
More specifically:
- Values climbing above 70 suggest a potential market top or that an uptrend is nearing exhaustion and due for a reversal.
- Readings falling below 30 indicate a prospective market bottom or that a downtrend is exhausted and may reverse course.
As the indicator moves toward these overbought or oversold thresholds, it can alert observant traders to watch closely for probable imminent trend reversals or at least a pause in the current directional momentum.
However, like all indicators, the DeMarker should not be solely relied on to trigger trades automatically. It performs best when incorporated into a robust trading plan using other confirming signals.
Adding the DeMarker Indicator to Charts
The DeMarker indicator in Forex trading is included as standard on most trading platforms like MetaTrader 4 (MT4) and MetaTrader 5 (MT5).
Follow these steps to readily add the DeMarker indicator to your charts:
- Open the Navigator panel on the platform and scroll down to the Indicators section.
- Locate and double-click on the DeMarker indicator option.
- The DeMarker indicator will now appear as an additional element on the price chart.
- Adjust the default setting parameters, such as changing the number of periods, line colors, style, etc.
The standard DeMarker settings use 14 periods for the historical lookback and calculation, which works well for most assets and timeframes.
However, traders should experiment with the period setting to find the optimal number of bars for the particular market and timeframe being analyzed and traded.
Get access to a demo account on an easy-to-use Forex platform without registration
How to Use DeMarker Indicator in Trading
There are several basic approaches traders incorporate for using the DeMarker indicator signals in their trading strategy according to technical analysis.
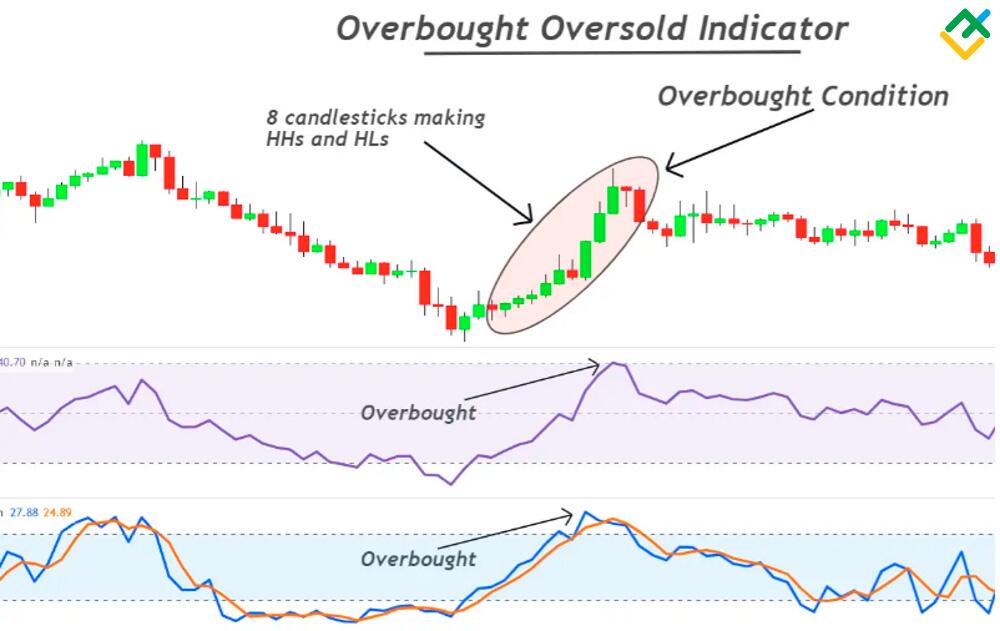
Overbought/Oversold Reversals
- Values climbing above the 70 level indicate potential overbought conditions and upside exhaustion in the uptrend. This suggests closely watching the price action for short-trade entry signals.
- Readings falling below the 30 level signal possible oversold conditions and downside exhaustion in the downtrend. This points to keeping an eye out for extended trade entry opportunities.
Divergences
- If the price makes a higher high, but the DeMarker indicator forms a lower high, it shows a bullish divergence, which hints at hidden upward momentum.
- When the price turn at the market creates a lower low, but the DeM produces a higher low, it highlights a bearish divergence, suggesting a demand for the underlying downside momentum.
Additional Filter
Use DeMarker readings to confirm overbought/oversold signals from other indicators like RSI. The probability of an imminent reversal strengthens if the signals align between indicators.
DeMarker Trading Strategy Examples
Here are a couple of examples of basic trading strategies incorporating the DeMarker indicator.
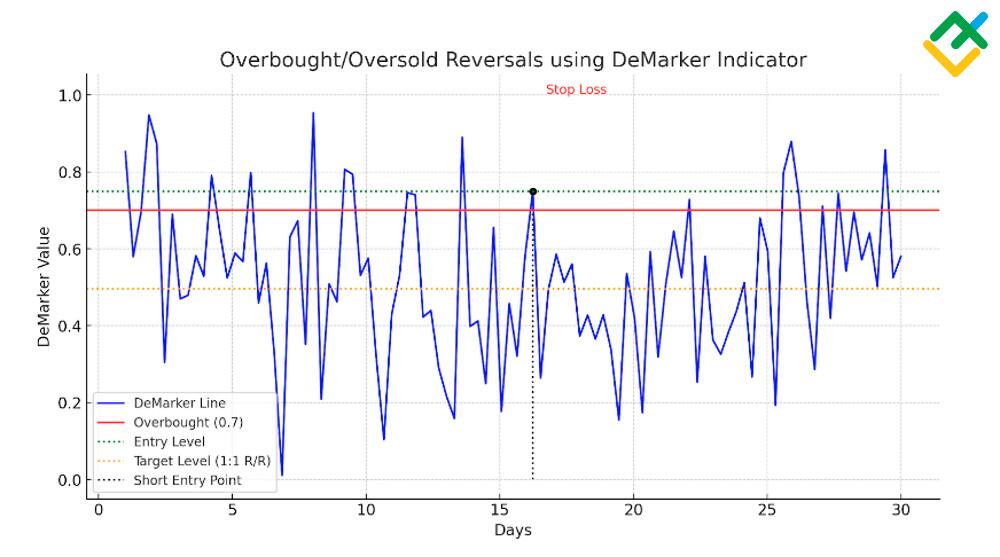
Overbought/Oversold Reversals
Entry: Enter a short trade when the DeM line crosses above the overbought 70 level. Place a protective stop loss order just above the recent swing high. Target a minimum 1:1 risk/reward ratio initially, with the potential to scale out additional profits at crucial support levels.
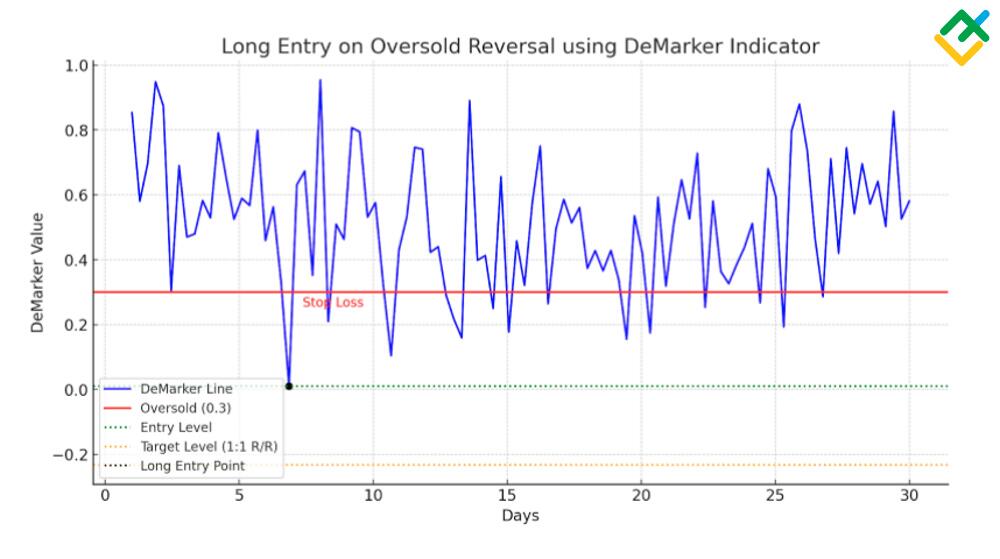
Entry: Enter a long trade when the DeM line crosses below the oversold 30 level. Place a protective stop loss order just below the recent swing low. Target at most minuscule a 1:1 risk/reward ratio initially, with possible scaled profit targets at crucial resistance zones.
Bond Trading Strategy
Entry: When the DeMarker line crosses below 30 into oversold territory, buy the bond instrument. Place a stop loss order just below the DeMarker indicator's recent low. Take partial profits when DeM reaches the midpoint level of 50 and exit the remainder of the position when DeM hits the overbought 70 level.
This straightforward bond trading strategy netted 48 trades over six months. It achieved 42 winning trades for an 88% win rate. The average risk/reward ratio was 1:1.5, indicating it captured 50% more profit than the amount risked on average.
Tips for Using DeMarker Effectively
Here are some tips to optimize the usage of the DeMarker indicator:
- Customize the lookback period setting to find the ideal parameters for the particular security and timeframe being analyzed. The default 14 periods may not be optimal.
- Use DeMarker in conjunction with overbought/oversold signals from other indicators like RSI to align signals and boost the reliability of trade signals.
- Be aware indicator signals can persist for extended periods in strong trending markets. Consider combining DeMarker with a trend filter or using it mainly in range-bound conditions.
- Thoroughly backtest any strategies incorporating the DeMarker indicator to validate performance before applying it to live trading with real capital at risk.
Conclusion
When applied prudently, the DeMarker oscillator in Forex can be a valuable tool for traders in identifying exhausted trend moves and probable reversals early. However, the indicator should be used as something other than a standalone trading system. Instead, traders are best served to incorporate DeMarker signals as an additional filter for trade confirmation within a broader trading plan paired with other indicators.
Its also essential to thoroughly backtest strategies, including the DeMarker indicator, and practice trading with demo accounts to optimize parameters and validate performance before committing real capital. Used wisely, the added confirmation from DeMarker can aid traders in making higher probability trading decisions. But no indicator is a guarantee of future results.
In summary, the key benefits of the DeMarker indicator are:
- Comparing current and prior period high/low prices to identify overbought/oversold levels;
- Spotting divergences between price and indicator trends;
- Signaling potential exhausted moves and imminent reversals;
- Providing additional trade confirmation as part of a larger trading system.
When added to a well-tested trading plan, the DeMarker indicator can be useful to a trader's toolbox.
Platform where traders earn more

Trade on LiteFinance’s high-tech ECN platform and open an account so that beginner traders can copy you. Earn a commission for copy trading and boost your income.
Demarker indicator FAQs
The DeMarker Indicator (DeM) in Forex was designed as a leading indicator, in contrast to most oscillators, which are lagging. This means DeM aims to anticipate future price movements rather than simply reflecting past trends.
The best strategies use DeMarker for confirmation, and other signals like candlestick patterns, trend filters, or additional oscillators like RSI. Using DeMarker alone is not ideal.
The default 14 periods work well for most securities and timeframes. But it's best to backtest and optimize the number of periods for each market traded to identify the ideal setting.
It's not advisable to use DeMarker alone to trigger trades. Its best use is as a confirmation filter for overbought/oversold signals. Relying solely on DeM often leads to false signals and suboptimal performance.

The content of this article reflects the author’s opinion and does not necessarily reflect the official position of LiteFinance broker. The material published on this page is provided for informational purposes only and should not be considered as the provision of investment advice for the purposes of Directive 2014/65/EU.
According to copyright law, this article is considered intellectual property, which includes a prohibition on copying and distributing it without consent.