

The CCI indicator or CCI Commodity Channel Index is an oscillator indicator, a technical analysis tool, originally developed by Donald Lambert in the 1980s. Despite its name, the indicator is quite efficient not only in commodity markets but also in trading stocks, currencies, and other financial instruments.
The simplicity of signal interpretation, relatively easy calculation and the ability to use the Commodity Channel Index in any markets and trading platforms have made the indicator very popular among traders.
Even a newbie can successfully trade with the CCI. Professional traders employ the indicator to spot additional entry points and use it as an oscillator to track the overbought and oversold zones in the market.
The article presents an ultimate guide to trading with the CCI indicator. Read on, and you will learn the history of the CCI Commodity Channel Index, major calculation formulas, and basic trading strategies using the CCI to make profits.
The article covers the following subjects:
What is the Commodity Channel Index (CCI)
The Commodity Channel Indicator (CCI) is an oscillator. Most of the time, the indicator chart is in the neutral zone, indicating that the market is relatively calm. When the indicator chart leaves the neutral zone, the tool indicates a price momentum. Also, with the help of CCI, a trader can determine when the market is in overbought or oversold conditions, and thus predict the trend exhaustion and the market reversal or correction.
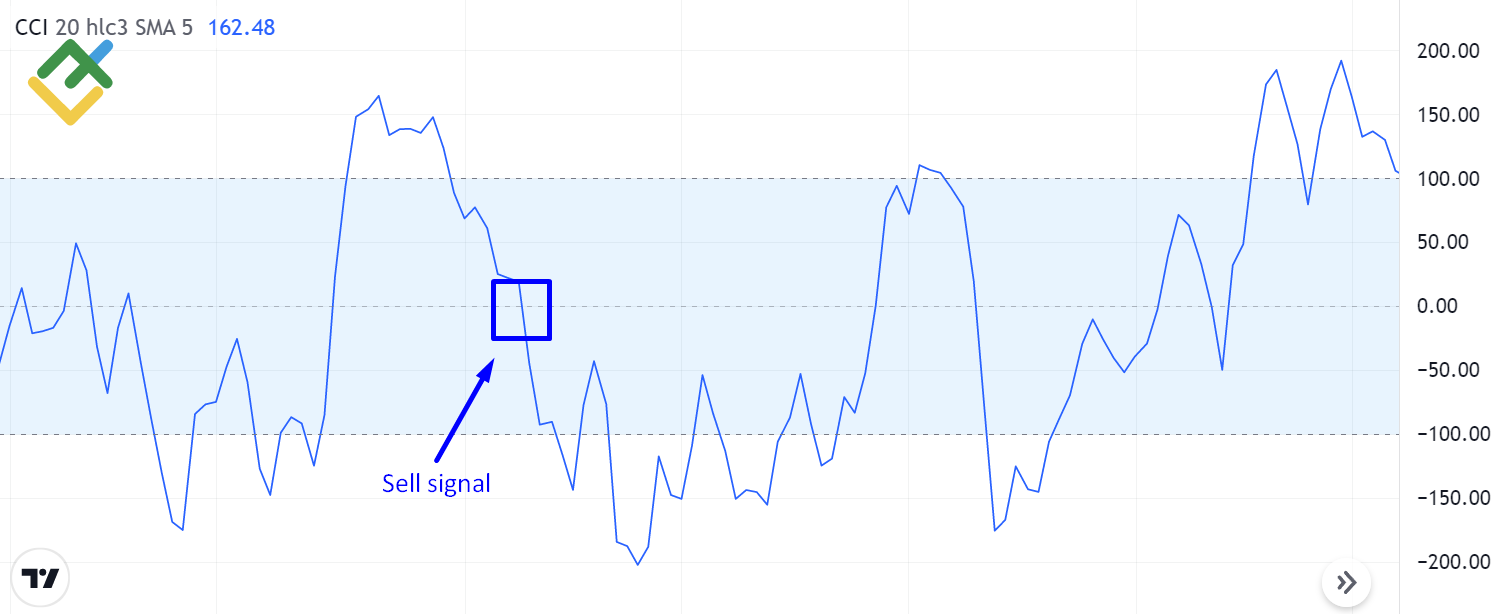
The figure below displays the CCI indicator in a trading chart
You see that the CCI indicator is displayed in a separate window under the price chart of a trading instrument.
The index looks like a curve that is located either above or below zero. The indicator also has levels +100, +200, and -100, -200, they are used to define the price momentum, as well as the overbought or oversold condition of the market.
According to the general rules of CCI trading, all signals could be grouped into two categories: signals to trade in a trend and ones to trade in a correction.
To trade a CCI strategy in a strong uptrend, you should expect the indicator line to break the zero line upside and enter a buy trade. When you are trading in a downtrend, wait until the indicator line breaks the zero level downside and enter a sell trade.
When you want to trade in a correction, it is advised to expect when the index goes beyond the level of +100 or -100, and then begins to return back to the neutral zone. The neutral zone is the area from +100 to -100, which means that the trend has exhausted and there should start a correction.
In some cases, the market could reach levels of +200 or -200, or even +300 or -300. When the price breaks out these levels and then returns back, it is a strong signal to trade on the correction. The more market deviates from its normal values, the higher the chance that the price will go back to these median values.
The Commodity Channel Index could be used as an independent trading system or as an oscillator to supplement the trading strategy. Everything depends on your investment objectives and trading skills. You can change the indicator settings, such as the period, according to your needs. However, I recommend testing the tool with the period of 20 first to try the basic CCI strategy.
History of Commodity Channel Index creation
Nowadays, the most popular trading assets are Forex, stocks, and cryptocurrencies. But this was not always so. You might be surprised, but financial market trading started with commodities, for example, grains, cotton, coffee, beans, etc.
Next, the first futures for these commodities appeared. Futures were needed by producers of agricultural products in order to hedge (insure) against the risks in case of crop failure and natural disasters, and buyers of these securities needed to be sure that they would receive the product at a price agreed with the seller in advance.
During its existence, commodity markets have given rise to many mathematical indicators that have gained popularity and are included in the so-called group of classical technical indicators.
The Commodity Channel Index was introduced in the October 1980 issue of Commodities magazine (now known as Futures magazine) by mathematician Donald Lambert. The commodity channel index indicator was designed to analyze the prices for commodity futures in a daily chart.
As the main idea of the CCI indicator, Donald Lambert used the idea of the market's cyclical trends. Low volatility is alternated by sharp price swings; high prices are followed by lower ones, and vice versa. The market’s movements repeat from time to time, although the repetition might not be exact.
It should be noted that the idea that the market moves in cycles is not new. It was approached by well-known traders before Lambert. The founder of wave theory Ralph Nelson Elliott, the founder of VSA analysis Richard Wyckoff, co-founder of Dow Jones & Company, Charles Dow, and others speculated upon the cyclical nature of different markets.
If one correctly defines market cycles, they could accurately determine optimal entry points when one trend finishes and an opposite one starts using the CCI indicator.
In his articles, Lambert used periods of 20 and 60 days. The first interval was used for relatively short-term trading. The second period could be employed in medium- and long-term trading. Currently, traders also apply shorter CCI periods to trading more volatile assets than commodities.
Lambert also used a daily timeframe as the primary one to spot the entry signals of the indicator. However, the CCI algorithm is quite efficient in shorter timeframes as well.
Interpretation: how to read CCI
The CCI indicator settings and trading principles are similar to other oscillators. All signals can be conventionally grouped into two types, signals to trade in the trend and signals to trade in a correction.
To define the trend, one should be guided by the principles of classic chart price analysis or apply supplementary tools. This is necessary to avoid the traps of false signals sent by the oscillator. When a trader has an understanding of the market trend priority direction, the signals of the CCI oscillator will be profitable.
CCI signals to trade with the trend
The CCI signals for trend trading appear when the CCI indicator line crosses level 0. Based on the trend direction, you should expect the indicator line to break through the zero level, either upside or downside.
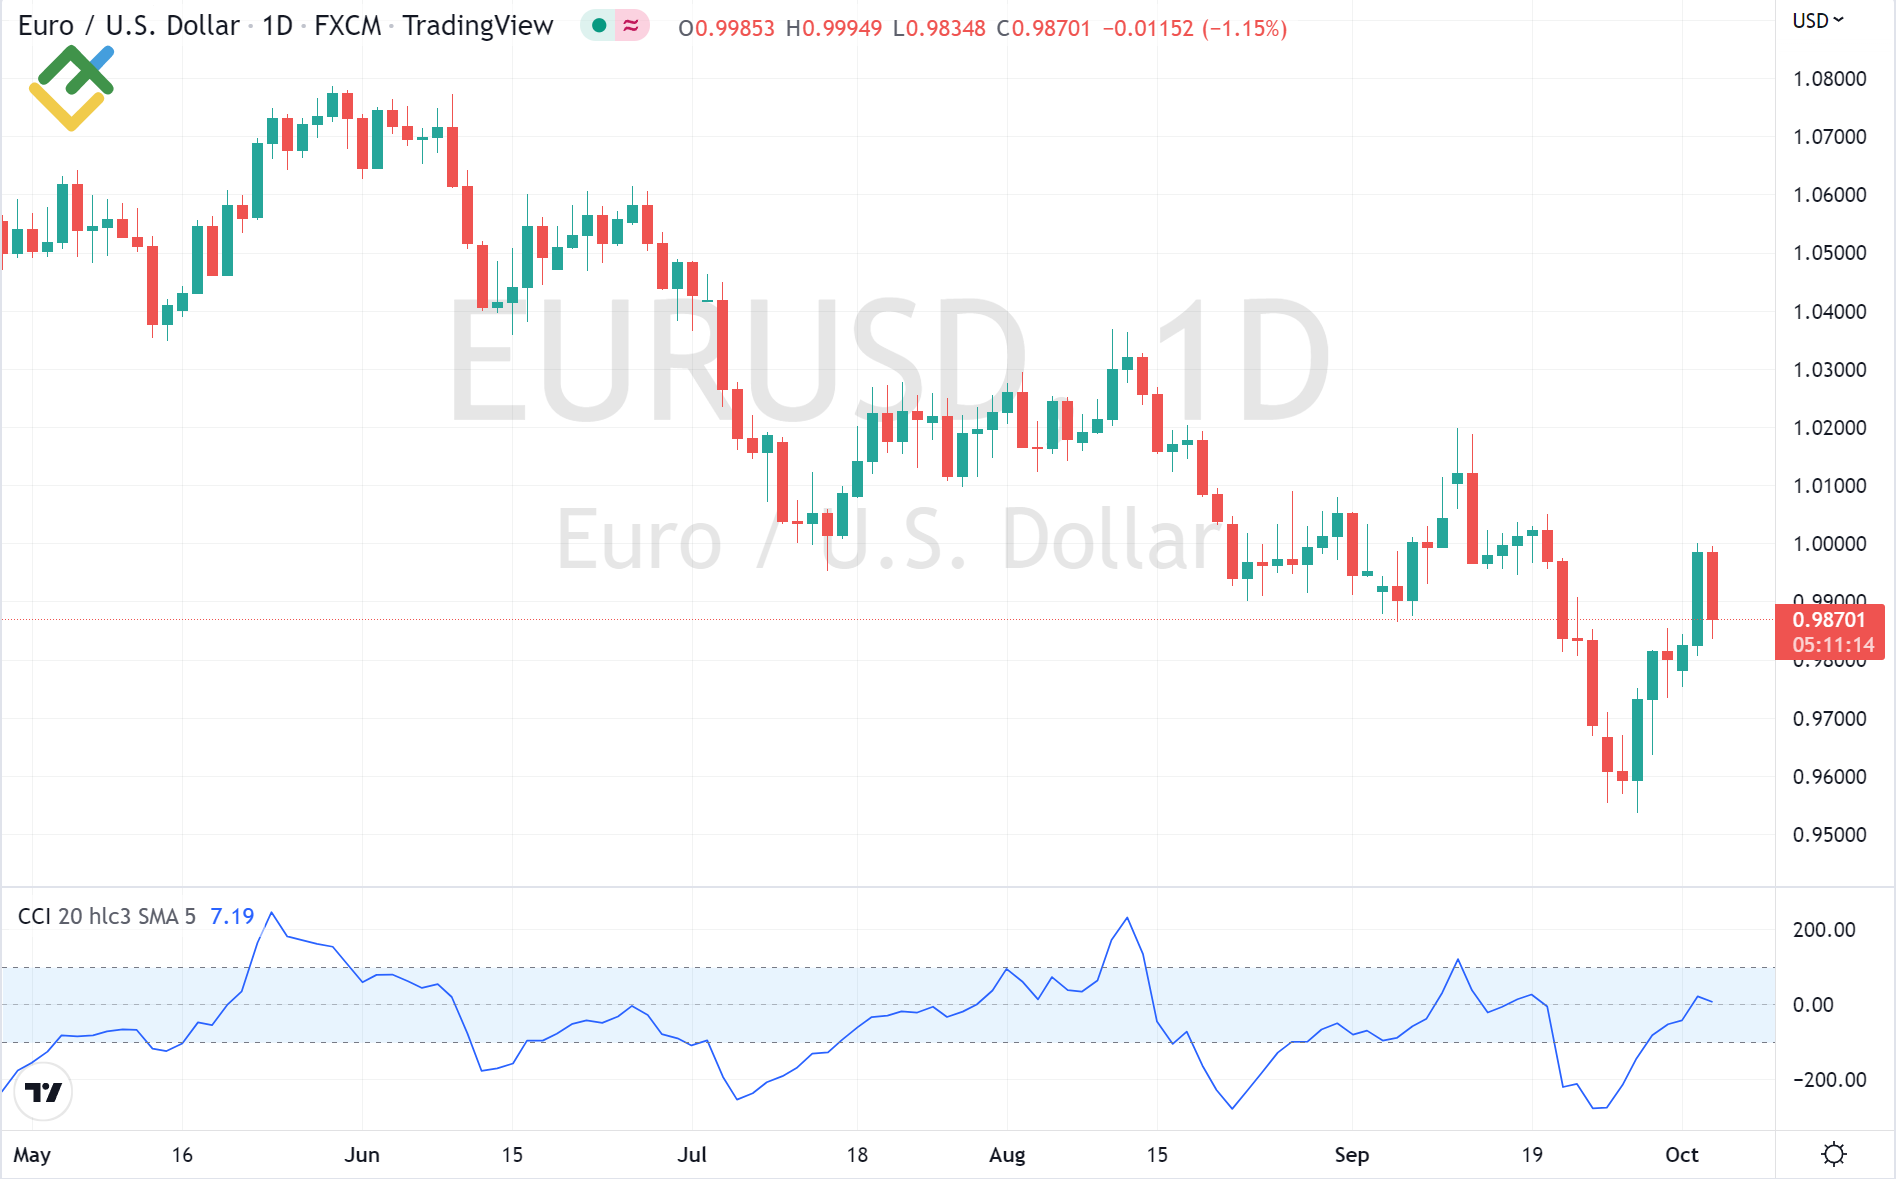
The chart below displays the CCI signals to trade the EURUSD downtrend.

The blue vertical lines mark the moments when the CCI indicator line crossed the 0 level downside. Therefore, after the formation of this signal at the close of the trading day, the trader should open a sell position.
In the chart below, red vertical lines mark the days when the signals to buy in the USDCHF uptrend emerged.
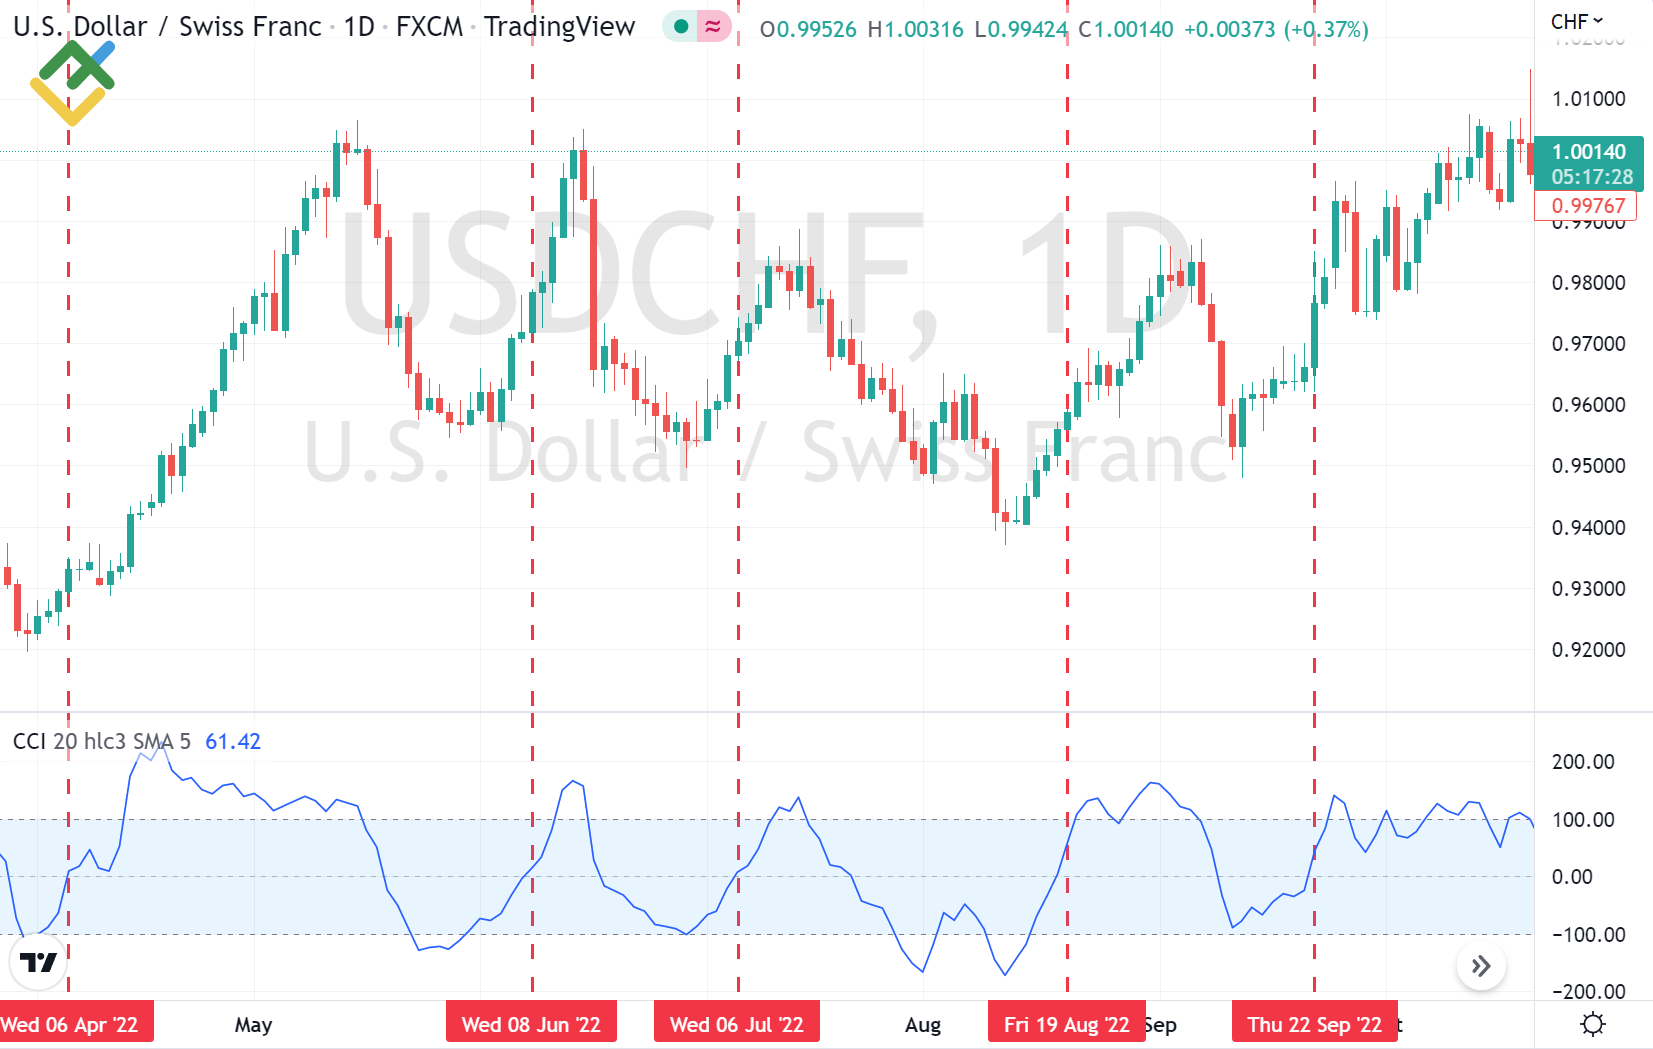
As soon as the index crossed the 0 line from the bottom up, and the trading day closed the price with a gain, the market continued to grow.
I want to emphasize once again that a trader should identify the trend in longer timeframes (D1, W1) to trade based on the signals described above. The trend can be identified using general techniques, such as key highs and lows in the chart, or using other technical analysis tools.
An oscillator is not meant to define trends.
If you trade each situation when the CCI crosse level 0 upside or downside, you will face a situation when the market movement is rather limited, or a stop loss works out.
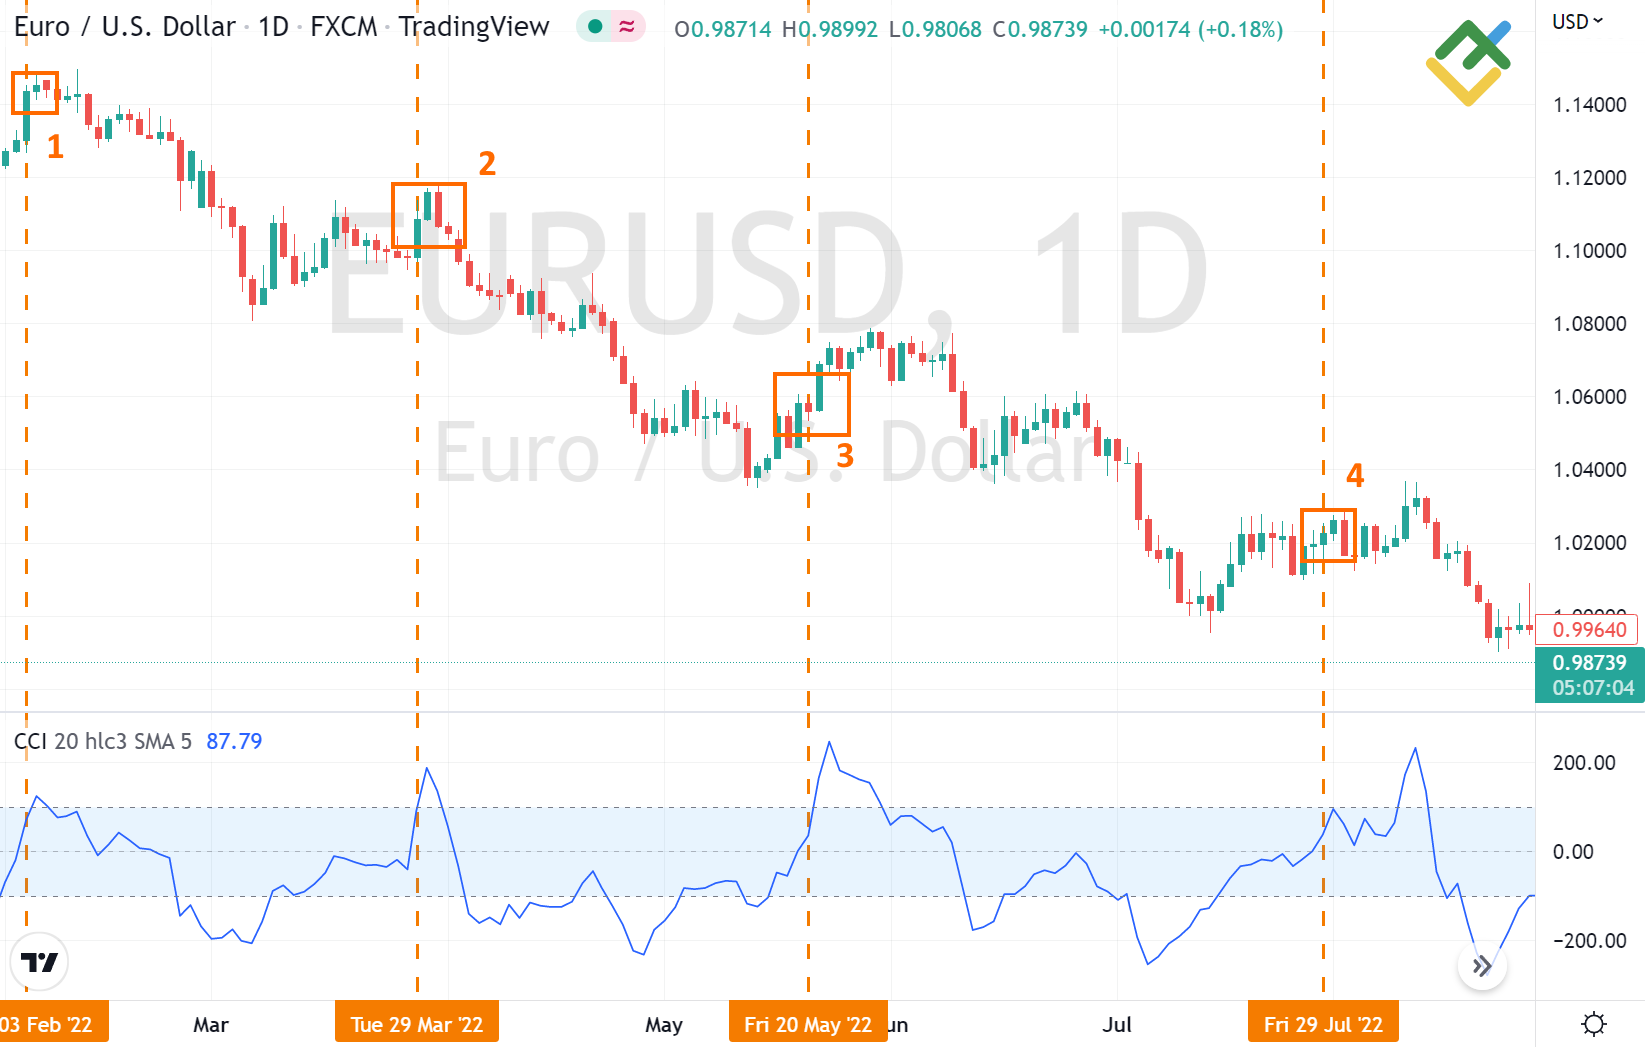
In the EURUSD chart, you are already familiar with, orange lines mark wrong, according to the trend direction, entry points. Note that entry points 1,2, and 4 must have ended the trade with a stop loss. Entry point 3 would yield a profit, but the growth is limited, and the price fall continues after it.
CCI signals to trade in the correction
One could trade counter the trend using the CCI indicator. It is possible when the indicator line goes beyond the normal market state (above level +100 or below level -100), the best signals are provided after the test of levels + 200 or -200.
Many experts recommend one refer to the +100 and -100 levels to trade in the correction opposite the trend. Still, I prefer to work with the stronger +200 and -200 levels. There will be more signals from levels 100, but there will be many false ones among them. The market will reach strong levels of 200 less often, but the signals, in this case, will be more accurate, especially in Forex, where volatility is higher than in other markets.
To open a position in a correction, you must first wait for the CCI line to go beyond strong levels, and then return to them. After the price returns to the level of +200 or -200, you can open a trading position counter the ongoing trend.
Below, you see an example of a GBPUSD downtrend.

The black boxes highlight the points to enter a trade in the correction, based on the CCI signals covered above. When the CCI moved below level -200 and then goes back, a buy position is opened.
Entry points 2,3, and 4 provide a good opportunity to make profits. Entry point 1 yielded a loss for the opened position.
You should bear in mind that it is more difficult to trade a correction than a trend. Also, in faster and more volatile markets, like Forex, one has better refer to stronger levels (+200 and -200). In less volatile and slower markets, like commodities, you could consider levels +100 and -100 to identify entry points in trading a correction.
Formula for the Commodity Channel Index (CCI)
Just like most oscillators, the CCI indicator is developed to define the overbought and oversold levels. The CCI spots these zones by measuring the ratio between the current price and the moving average (MA), that is, normal deviations of the current price level relative to the average price.
The calculation process covers several stages:
1. Identification of the Typical Price. It is the most important value. The typical price is calculated as the arithmetic mean of three figures: High, Low, and Closing price.
Due to the typical price, you can have an idea about the market trend. If the current CCI measures are higher than the previous ones, the price is rising, and the trend is up. If the current price is lower than the previous one, the market is falling, and the trend is down.
The typical price calculation formula is below:
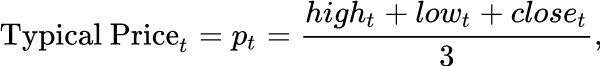
The formula includes the Typical Price(t) or p(t); the High; the Low, and the closing price (Close (t)) for the considered period (t).
For example, for a trading day, when the highest price is 0.9869, the lowest price is 0.9704, and the closing price is 0.9861, the typical price will be (0.9869 + 0.9704 + 0.9861) / 3 = 0.9811.
2. The calculation of the moving average of the typical price.
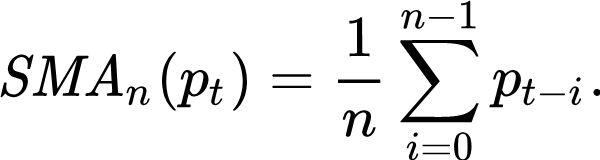
By eliminating random deviations, a clearer view of the trend is obtained. The simple moving average of a typical price is the arithmetic average price over n periods, calculated by the formula:
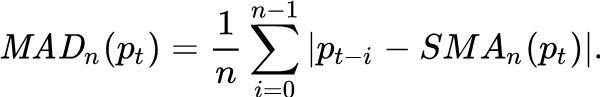
3. The dispersion is calculated. Differently put, this is the mean absolute deviation, which allows you to identify overbought or oversold conditions of the market.
The mean absolute deviation is the arithmetic average of the absolute deviation of a typical price from its moving average over n periods, calculated by the formula:
4. The result is scaled using a reduction factor of 0.015.
The reduction factor is also called the “Lambert constant”. Its value is constant and is designed to fit 2/3 of the absolute deviation values in the interval [-100, 100].
Finally, the CCI formula looks like this:

CCI Calculation Excel Sheet
The Commodity Channel Index can be calculated using Microsoft Excel software. This type of calculation can be useful for those traders who trade on a platform that can’t add the CCI indicator to the chart.
This type of calculation can be useful for obtaining digital CCI values for each trading day. In the future, such digital CCI measures can be analyzed at your own discretion and used with another technical indicator reflecting the market state.
Below, you can find the template for the CCI calculation in Microsoft Excel.
On the first sheet of the template, called “Data”, the trader needs to specify the High, Low, and Close prices. For convenience, I recommend that you also fill in the “Date” and “Open” columns with the corresponding date of the trading day and the opening price.
Next, the program will calculate the Typical Price, the 20-day Simple Moving Average of the Typical Price, the 20-day Mean Absolute Deviation, and the CCI indicator itself using the abovementioned formulas.
If you need to calculate CCI reading for a period other than 20 days, then you can easily edit the template to your liking by reducing or adding the number of periods yourself.
The second sheet of the template, “Parameters”, will display the calculated CCI as a chart. Also, the closing price of the specified periods (days) will be imposed on the chart.
For convenience, you can fill in the “Parameters” table by entering the name of the analyzed instrument, the analysis period, and the CCI calculation time interval. In the future, the “Parameters” sheet can be printed.
Thus, you can have a ready-made tool for calculating CCI in Excel, which is not tied to the trading terminal and can be used depending on your objectives.
Calculating Commodity Channel Index
Let us try to calculate the commodity channel index for the EUR/USD instrument manually at the trading day close on October 21, 2022.
We need to know the high, low, and close of the last 20 trading days, including October 21st. That is, we need the data from September 26 to October 21, 2022, as Forex trading is closed at weekends. To find out these prices, just open any trading terminal and hover the mouse over the day you are interested in, and the trading platform will show all the necessary information.
Next, we should calculate the typical price for each day separately. To do this, add the high price, the low price, and the closing price of the day and divide the resulting amount by 3.
- For example, for October 30, a typical price would be (0.98538 + 0.97344 + 0.98005) / 3 = 0.97962.
- For October 13, the typical price will be (0.98060 + 0.96315 + 0.97763) / 3 = 0.97379.
- Other days are calculated in the same way: (High + Low + Close) / 3.
After you have calculated the typical price for each day, let us find out the simple moving average of the typical price over the past 20 days. To do this, we need to calculate the arithmetic mean of the typical price values from September 26 to October 21 inclusive:
- (0.96235 + 0.96109 + 0.96727 + 0.97556 + 0.97962 + 0.98073 + 0.99304 + 0.99034 + 0.98350 + 0.97609 + 0.97109 + 0.97167 + 0.97016 + 0.97379 + 0.97447 + 0.98029 + 0.98471 + 0.98009 + 0.97938 + 0.98101) / 20 = 0.97681.
The next step is to determine the mean absolute deviation. However, first, you need to calculate the absolute deviation of the average typical price for the day for which we calculate the CCI indicator from the typical prices for each day used for calculation.
As you already know, the mean absolute deviation is calculated according to the formula:
So, the average typical price on October 21 is 0.97681. From this value, you need to subtract the typical price on October 21st. 0.97681 - 0.98101 = -0.00420. To calculate the absolute deviation, we need to take the value modulo, i.e., 0.00420.
Next, we subtract the typical price value for October 20 from the average typical price of October 21, 0.97681 - 0.97938 = -0,00257. We take the absolute values, and here it is 0.00257.
Next, we subtract the typical price for October 19 from the average typical price of October 21, 0.97681 - 0.98009 = -0,00328. We take the modulo value, as usual; it is 0.00328.
We do the same procedure for each trading day, including the very beginning of September 26, 2022.
When we have calculated the absolute deviation of the average typical price from the typical prices for each day, the values obtained separately must be added and divided by 20. The result is the mean absolute deviation. I will not give the whole calculation and limit myself only to the final value - 0.00646.
Next, you need to scale the mean absolute deviation by multiplying it by the Lambert constant of 0.015, 0.00646 * 0.015 = 0.0000969.
Then you need to subtract from the typical price on October 21 the value of the average typical price for October 21: 0.98101 - 0.97681 = 0.00420.
And at the last stage, we divide the value of 0.00420 by the scaled mean absolute deviation: 0.00420 / 0.0000969 = 43.344.
Thus, we got the CCI value at the close on October 21, 2022, for the EUR/USD pair equal to 43.344. To check, you can impose CCI on the price chart in the trading platform and see its value on October 21.
As can be seen from the above example, the calculation of CCI is not complicated but requires numerous actions that are best left to a computer, indicators, and specialized software to quickly obtain the necessary information.
CCI Trading Strategies
The CCI trading strategy is in many ways similar to strategies based on other oscillators. When working with CCI, a trader's attention is mainly focused on the indicator location relative to levels 0, -100, +100, -200, and +200.
Traders like the CCI commodity channel index because it is a versatile indicator that is relatively easy to interpret. Both a beginner and a professional trader can profitably apply the CCI trading strategy, so I strongly recommend that you familiarize yourself with at least the basic strategies below, and then decide for yourself whether this style of trading suits you or not.
Potential Buy & Sell Signals
If we consider the basic signals to buy or sell sent by the CCI indicator, first of all, it should be noted that the indicator is an oscillator. Therefore, the tool itself does not provide any information about the global trend. If you trade each signal, you won’t add up to your initial investment much.
Hence the following idea arises: an additional tool is needed to determine the global trend in the market to minimize the number of unprofitable signals.
Other indicators, such as the Moving Average, can be used to define the trend. However, I believe it is best to stick to the Dow Theory and identify the trend using key highs and lows in the daily chart.
When you have an idea of the primary trend, trading with the CCI indicator won’t be difficult. Next, you should look at buy and sell signals provided by the CCI indicator, having identified the general trend in the market using key highs and lows in the price chart.
Buy signals
A signal to buy is sent when the indicator line crosses level 0 from the bottom up. At the same time, the general trend for the instrument should be up.
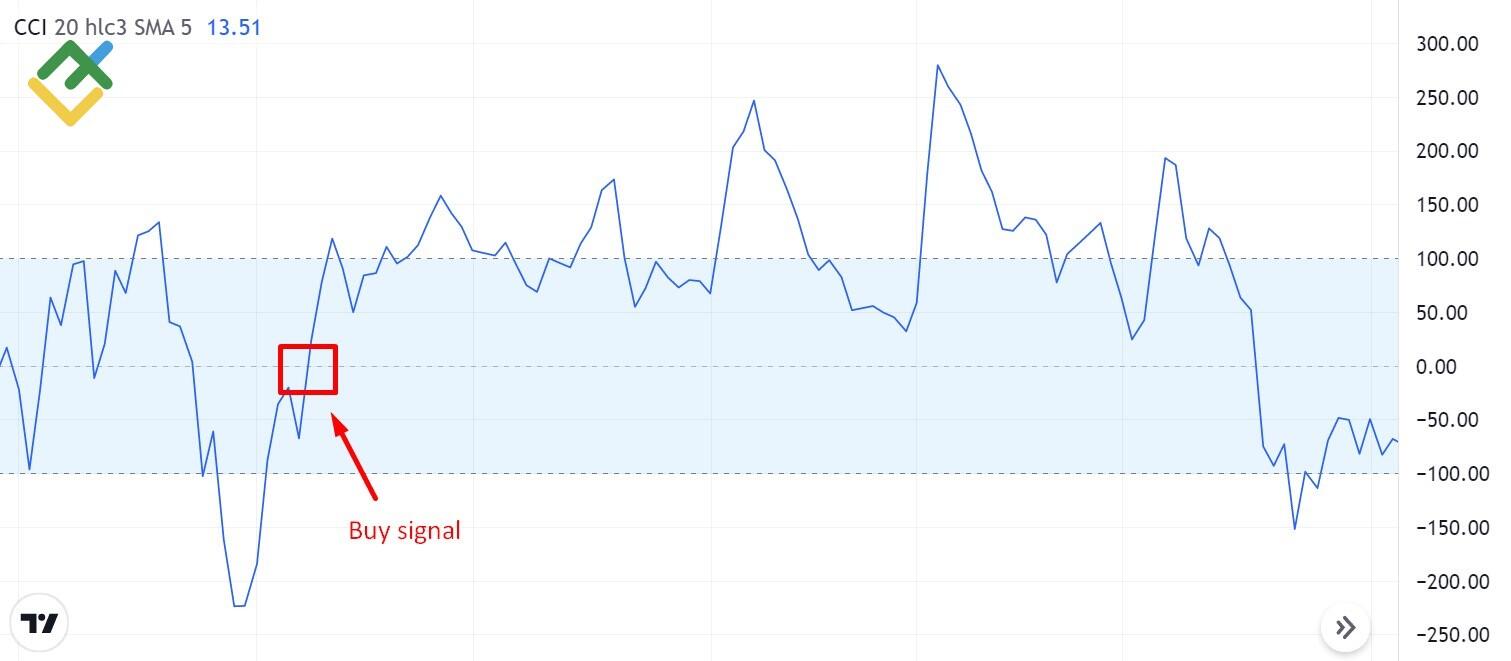
Now, let us add the USCrude oil price chart to the CCI chart.

In the above example of a pro's trade, you see that the general oil trend is up; it started in April 2020. A bullish signal appears on November 9, 2020, when the CCI line crosse level 0 upside. Next, the price starts growing, which is a good buying opportunity.
Main conditions to enter a buy trade:
The indicator period is 20 days.
The indicator line crosses the zero level upside.
Enter a buy trade the next day after the signal is formed.
A stop loss is set below the low of the daily candlestick when the signal appeared if the candlestick range is equal to or a little bigger than the average daily range of the instrument (ATR). If the candlestick has a small range, it makes sense to consider the previous day and set a stop loss below the daily low preceding the signal day. If the candlestick exceeds the ATR by two or more times, the stop loss is set at the middle level of the signal candlestick.
A take profit is recommended to be set at a distance of 3 or 4 times longer than the stop loss. You can also set the take profit at the strong resistance level of the day or an important local high.
Let us explore one more example.
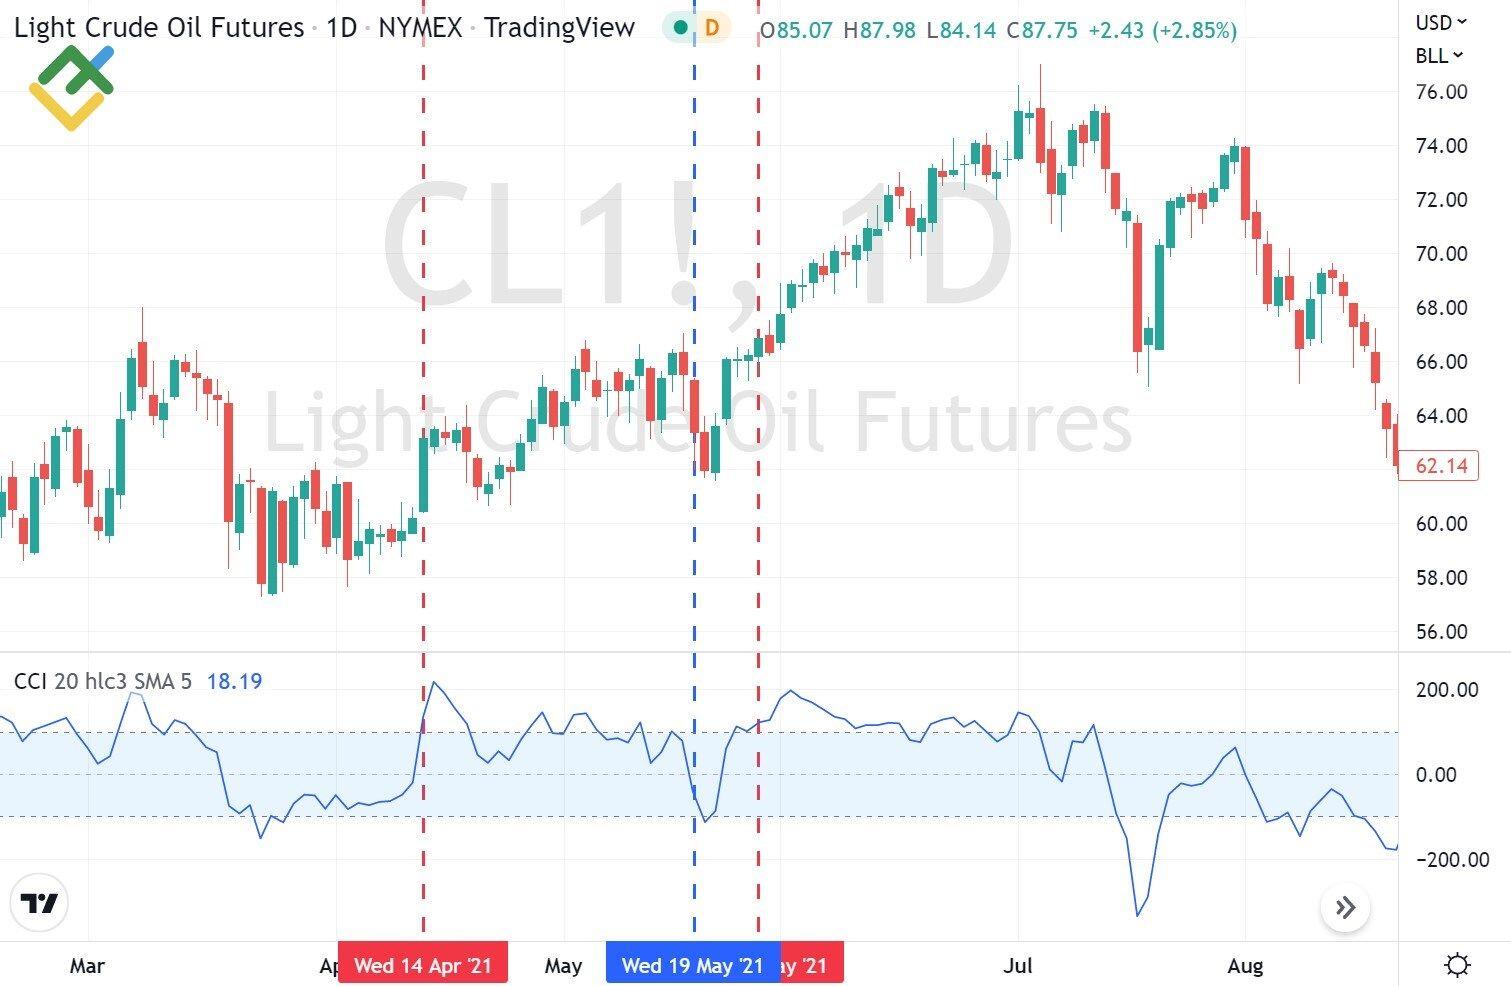
The market provides two trading signals to buy USCrude oil. The first one appears on April 14, 2021; the second one is on May 27, 2021.
When the trade is entered according to the first signal, the market doesn’t reach the take profit and starts a correction. The CCI indicator breaks through the zero level from top to bottom (marked with the blue line). In this situation, I recommend exiting the trade, even if there is a loss, as the conditions for holding the position are not met, and the indicator generates an opposite signal. One should not enter a sell trade at the close of the day, marked by the blue line, as the overall trend is up.
However, a few days later, on May 27, the Commodity Channel Index generates one more signal to buy; this time, it yields a profit.
Sell signals
The bearish signal is sent when the indicator line crosses the zero line downside. At the same time, the general strong trend should be down.
Now, let us add the S&P 500 price chart to the CCI graph.
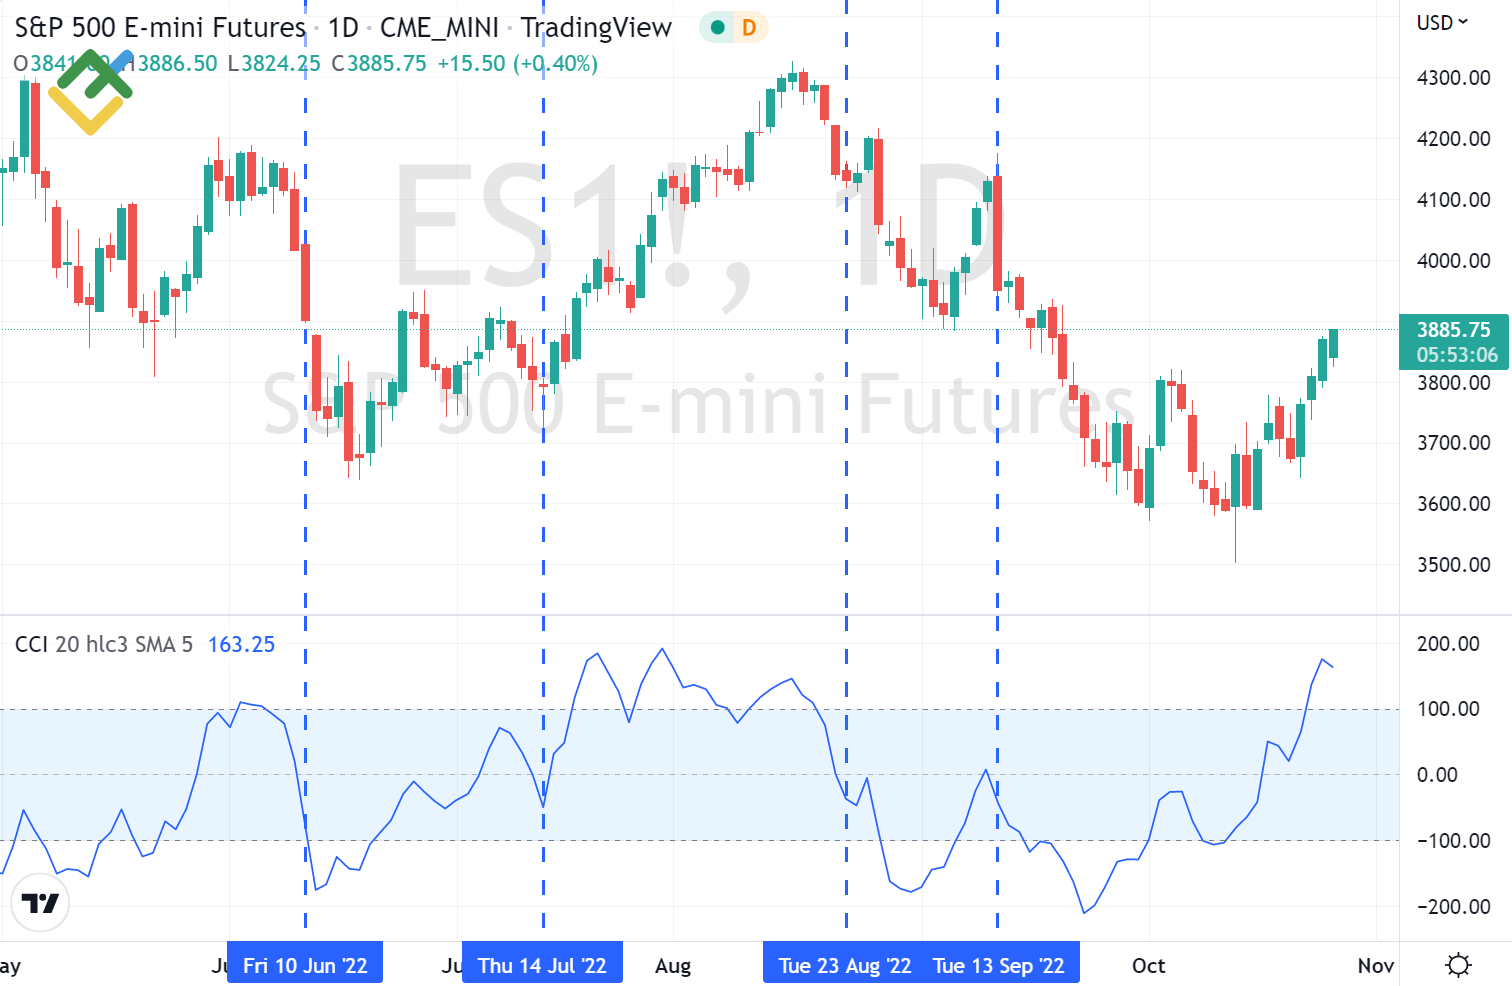
A sell signal appears 4 times: on June 10, 2022, July 14, 2022, August 23, 2022, and September 13, 2022.
In the first case, the downward movement is limited and would not yield a reward-to-risk ratio of more than 3 for a trade.
In the second case, the sell signal forms within an ascending correction. One should not trade such a signal if one understands that the opposite correction is developing. However, there won’t be a disaster if you enter a sell trade in such a situation; you will just face a small loss within your CCI trading system.
Following the third signal, the S&P 500 index significantly drops, and the planned target is reached. Here, the stop loss is set not above the high of the signal candlestick, but above the high of the previous candle, as the signal candle’s range is narrower than the average daily range for the instrument.
The position opened based on the fourth signal also yields a profit.
Primary conditions for a sell trade:
- The indicator period is 20 days.
- The CCI line crosses level 0 from top to bottom.
- The trade is entered the next day after the signal appears.
- The stop loss is placed above the high of the daily candle on which the signal was formed, provided that the range of the candle is equal to or slightly greater than the average daily move (ATR) of the instrument. If the candlestick’s range is narrow, then it is reasonable to consider the previous day in the calculations and set a stop loss for the high of the day preceding the signal one. And the third case is if the candle exceeds the ATR twice or more. Then the stop loss is placed in the middle of the signal candle.
- The take profit is set at a distance that is 3 or 4 times longer than the stop loss. You can also set the take profit at the daily support level or a significant local low.
Overbought and oversold levels
Trading based on overbought/oversold zones means defining the so-called market borders. The market upside or downside limits are easily defined by oscillators. In trading with the CCI indicator, the overbought and oversold levels are +100 and -100, as well as +200 and -200.
Levels +200 and -200 are considered stronger. I suggest beginners master trading using these levels and then consider other ones.
Some traders also apply levels +300 and -300, but the indicator can reach these levels only provided the period is shortened, or the market is highly volatile.
When the CCI moves up to the overbought zone, the uptrend might be exhausting, so there should be a correction, or the trend could reverse down.
Reaching the downside limits of the oversold zone means the downtrend is weakening, and an ascending correction is about to start, or the ongoing trend might soon turn up.
Let us explore an example of the USDJPY chart to see how the price chart is moving after the CCI reaches strong levels of overbought and oversold, + 200 and -200.
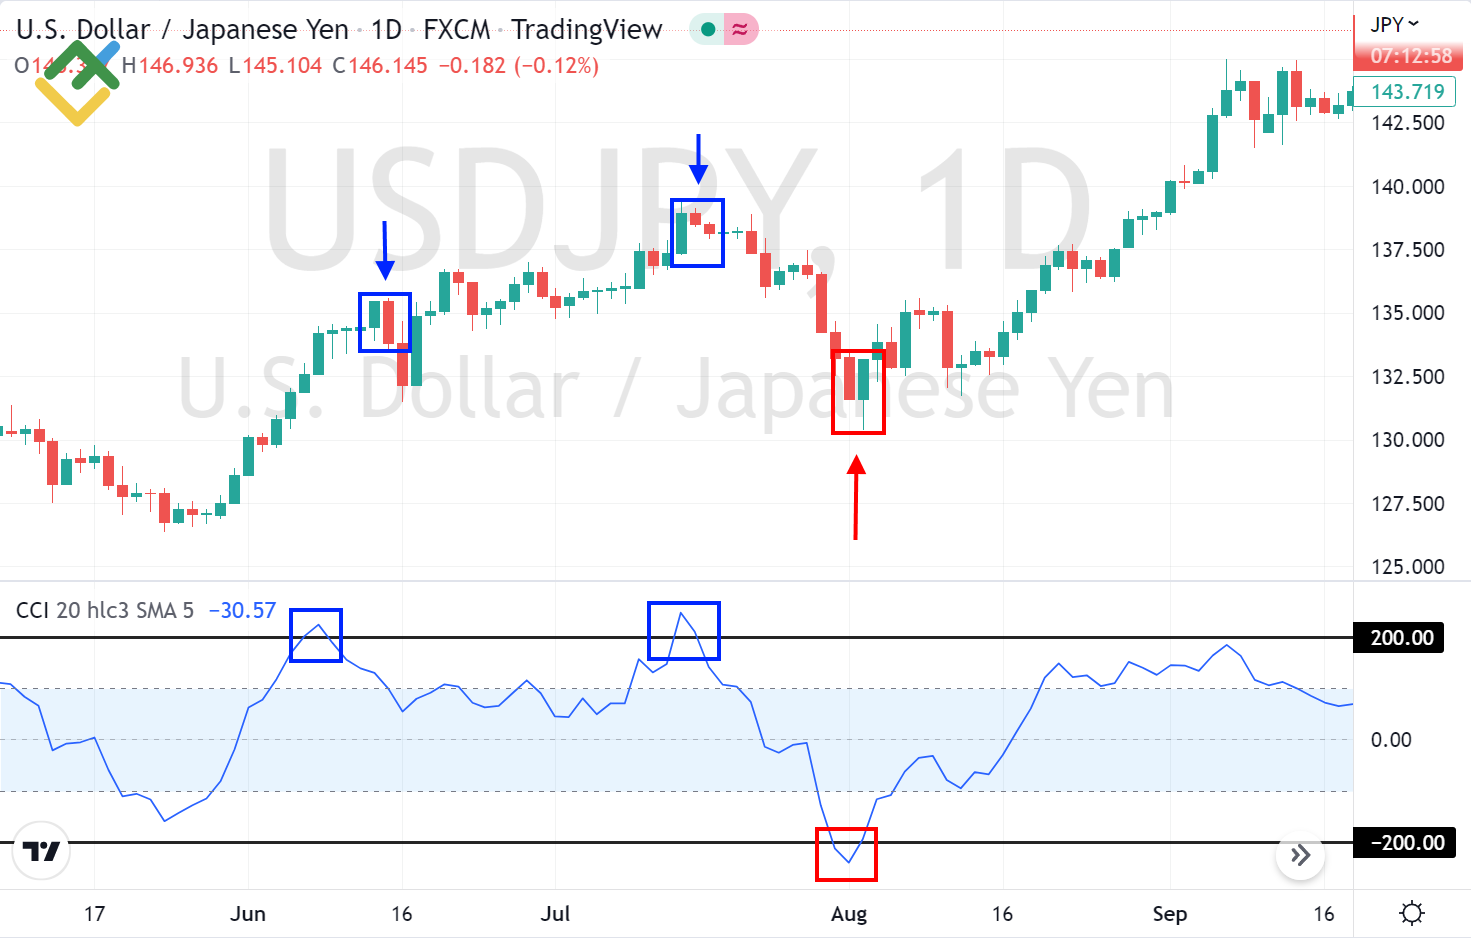
You can see in the chart above that once the CCI indicator reaches the key overbought and oversold levels, the price starts moving in the opposite direction soon afterward.
The arrows in the chart point to the Price Action patterns that provide entry points with a good reward/risk ratio.
It must be noted that when the CCI moves into the overbought and oversold levels, it is not a signal by itself. A specific entry point is identified using supplementary tools, for example, Price Action patterns.
It is important to remember that the CCI indicator is leading, suggesting to the trader that soon after reaching the overbought and oversold levels, the market may begin to move in the opposite direction, which will develop into either a correction or a new trend. This information may allow you to make additional profits.
General rules:
The indicator period is 20.
Mark levels +200 and -200.
Expect the price to reach the levels you marked.
Expect a Price Action pattern or any other pattern to emerge.
Enter a trade according to the pattern.
The take profit should be 3 times greater than the stop loss. A take profit could be set at strong support or resistance levels, for a sell or a buy trade respectively.
Below, there is an example of trading the USDCAD based on the overbought and oversold levels. Like in the case described above, the Price Action buy and sell signals emerge a little later than the index reaches +200 and the negative territory of -200.
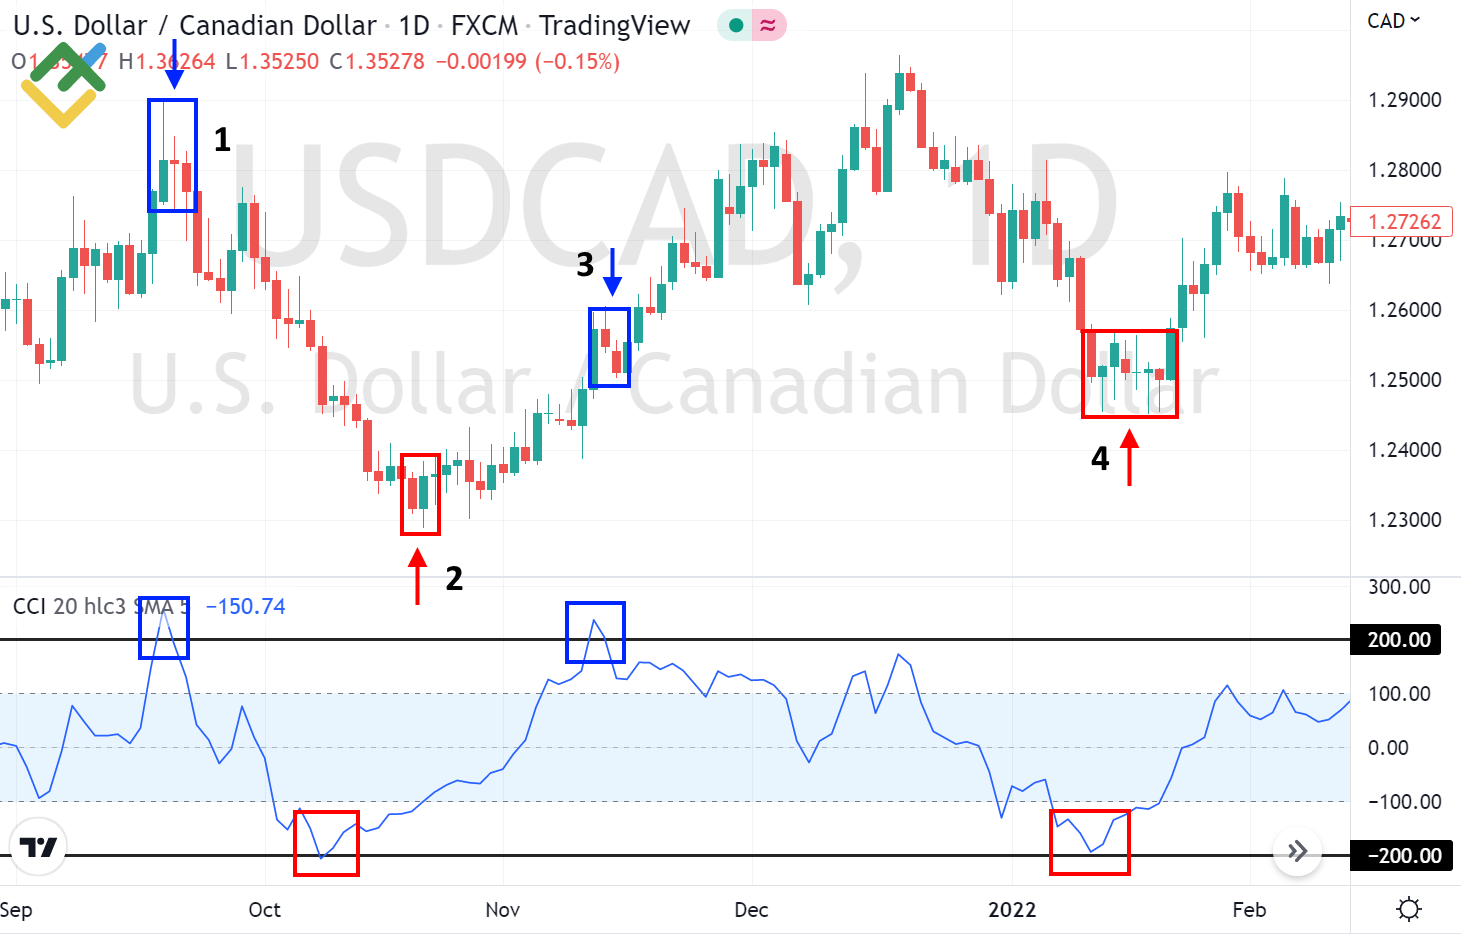
There are four signals in the period from September 2021 to January 2022. Signal 3 is losing, other signals would yield profits.
CCI Bullish/Bearish Divergences
CCI bullish and bearish divergences are strong reversal signals in technical analysis that suggest a soon correction or a price reversal.
Divergence signals appear quite rarely. In general, a divergence appears at the end of long price trends. If you can spot a divergence in the chart, you can make quite good profits.
Divergence means a situation when the indicator and the price chart move in opposite directions.
Bearish divergence
A bearish divergence emerges when the price chart hits a higher high while the CCI dipped, the line makes a lower high or repeats the same one.
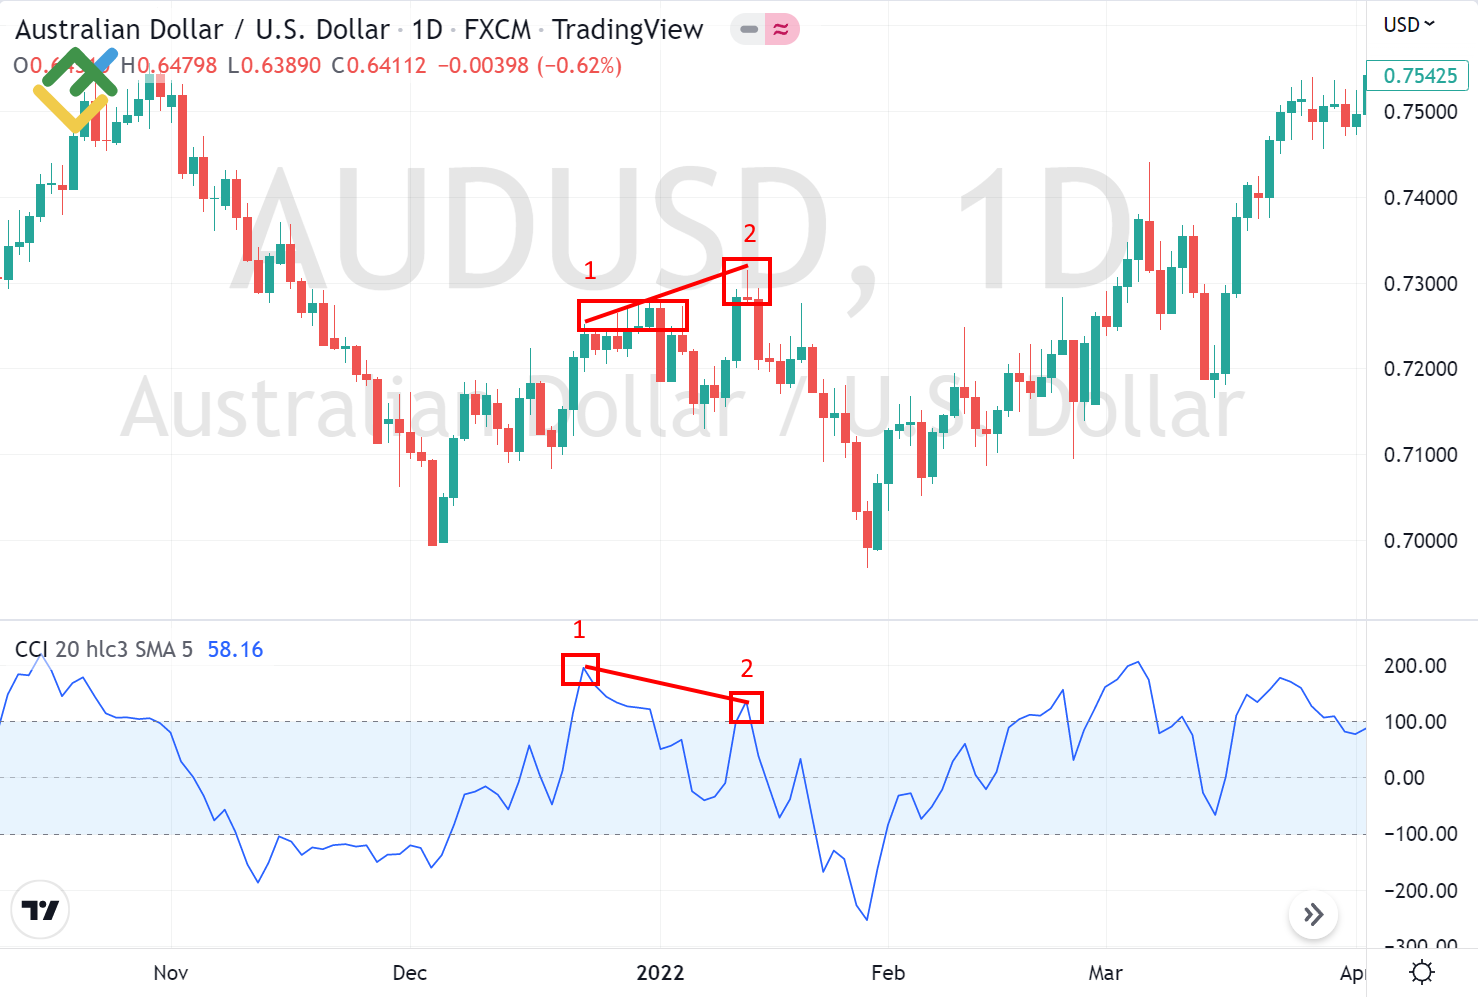
Look at the AUDUSD price chart above. The price chart makes a new high, higher than the previous one, while the CCI makes a lower high. The bearish divergence is a strong sell signal.
An entry signal here is the Pinbar price action pattern that appears when the second high forms. Next, you can see the price values fall, and the bearish movement continues for a few days.
Bullish divergence
A bullish divergence occurs when the underlying security makes a lower low while CCI forms a higher low, which shows less downside momentum.
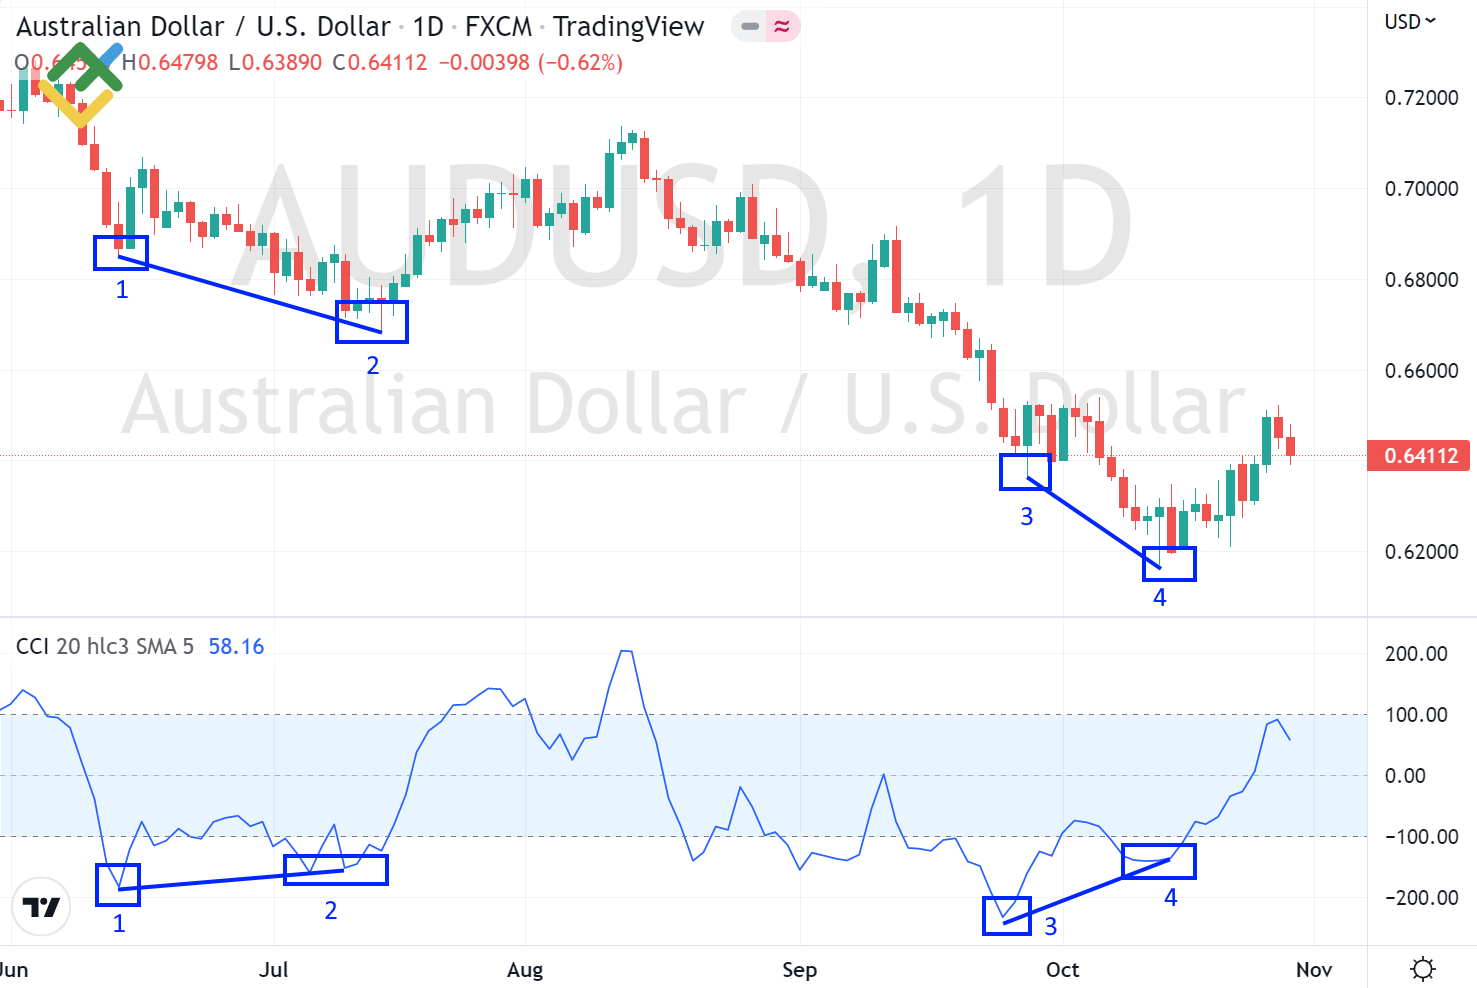
You see from the AUDUSD chart above that the trend is down. The price makes a local low (1), and then makes a lower low (2). The CCI, however, makes a low (1), and the next low is higher. There is a divergence between the price chart and the CC indicator, so the market is about to turn up.
A bullish divergence is a strong signal to enter a buy trade. The trade is opened after the Pinbar Price Action pattern appears, following the second low in the chart.
There is another example of divergence in the same chart. The price chart makes low (4), lower than the preceding one (3), while the CCI makes low (4), which is higher than the previous one (3). Here emerges the bullish divergence, a strong signal to buy in technical analysis.
General conditions to enter trades based on divergence signals
You should attentively follow the extremes in the price charts and in the CCi chart. If the indicator chart and the price go in opposite directions, there is a bullish or bearish divergence. At this moment, you should try to spot a pattern to trade, according, for example, to the Price Action.
A stop loss is set based the pattern rules, according to which the position is opened. A take profit is set at the distance three times longer than the stop loss or at a strong support or resistance level, depending on whether it is a buy or a sell trade.
If you master trading bullish and bearish divergences CCI, you will enter more trades and raise the potential profitability of your trading account. Divergence signals are among the strongest ones generated by the CCI indicator.
How to Use the CCI Indicator for Day Trading
The Commodity Channel Index indicator is also suitable for intraday trading, like most technical analysis tools. In this case, the trader should switch to the M5 or M15 timeframe. The shorter the timeframe, the more signals there will be. In a longer timeframe, there will be fewer signals, but they will be more reliable.
You can leave the indicator default period at 20 or choose your own value. Don't be afraid to experiment. For highly volatile instruments, a period with a greater value should be selected. For low volatility, the opposite is true.
For intraday trading, the same rules and strategies that I described above work. Watch the CCI location relative to level 0, overbought and oversold levels +200, -200, bullish and bearish divergences. The main difference is that the position holding time will not be several days, but several hours. However, in day trading, there are more false signals. In short timeframes M1 - M15, there is more so-called market noise, so it is not always possible to determine the general trend for the instrument.
Let us explore a few examples of CCI day trading.

Look at the EURUSD price chart, the timeframe is M5. Numbers mark strong overbought and oversold levels of +200 and -200. An entry signal is still a Price Action pattern.
In the first case, the CCI indicator reached level +200, and there is a Pinbar in the price chart. A sell trade is entered.
In the second case, the CCI indicator reaches level - 200, and there is a Bullish Engulfing pattern in the chart. A buy trade is entered.
In the third case, the CCI reaches the overbought levels of +200, and a Pinbar emerges in the price chart. A sell position is opened.
In the fourth case, the CCI reaches level +200, and a bearish engulfing pattern appears in the price chart. Again, a sell trade is entered.
A stop loss is always set according to the Price Action pattern rules. A take profit is set at a distance of three times longer than the stop loss. You can also set a take profit at a strong resistance (for a purchase) or support (for a sale) level. Another option to exit a trade is when the CCI indicator reaches level +100 or -100, depending on the trade direction (buy or sell).
Thus, based on the above example, one could make a profit from four trades entered based on the CCI signals to identify overbought and oversold areas.
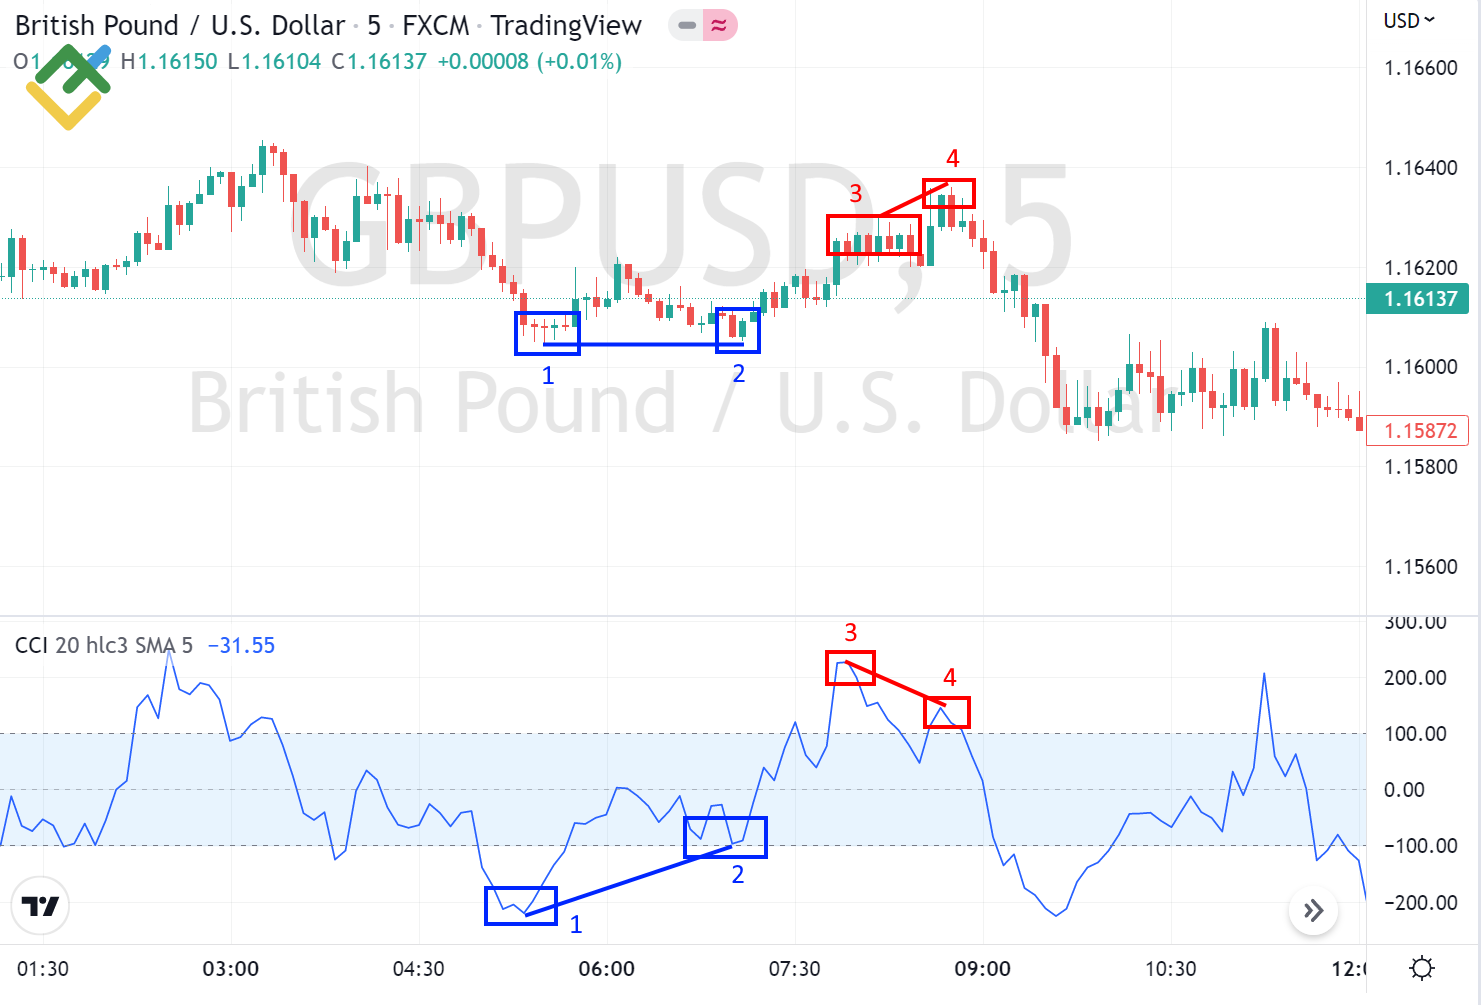
The next example displays the GBPUSD price chart, the timeframe is M5. Let us see how bullish and bearish divergence signals work in real trading.
In the first two cases, a bullish divergence is defined. The price chart makes a new low at the level of the previous one, and the CCI chart makes a low 2 higher than the low 1. There is a bullish divergence, a strong signal to buy. A trade is entered when a PPR pattern appears.
In the third and fourth cases, there is a bearish divergence. The price chart hits a high, higher than the previous one, and the CCI makes a high (4) lower than the previous one (3). A bearish divergence is a strong sell signal. The position is opened based on the Railway Track candlestick pattern.
Thus, in one trading day, one could make profits 2 times on divergence signals. The main thing is to carefully monitor the incoming signals sent by the CCI indicator and find discrepancies between the price chart and the indicator chart. It is also important not to miss the entry point according to the Price Action pattern, as, in day trading, the market may move a considerable distance from your entry point in the next 5 minutes.
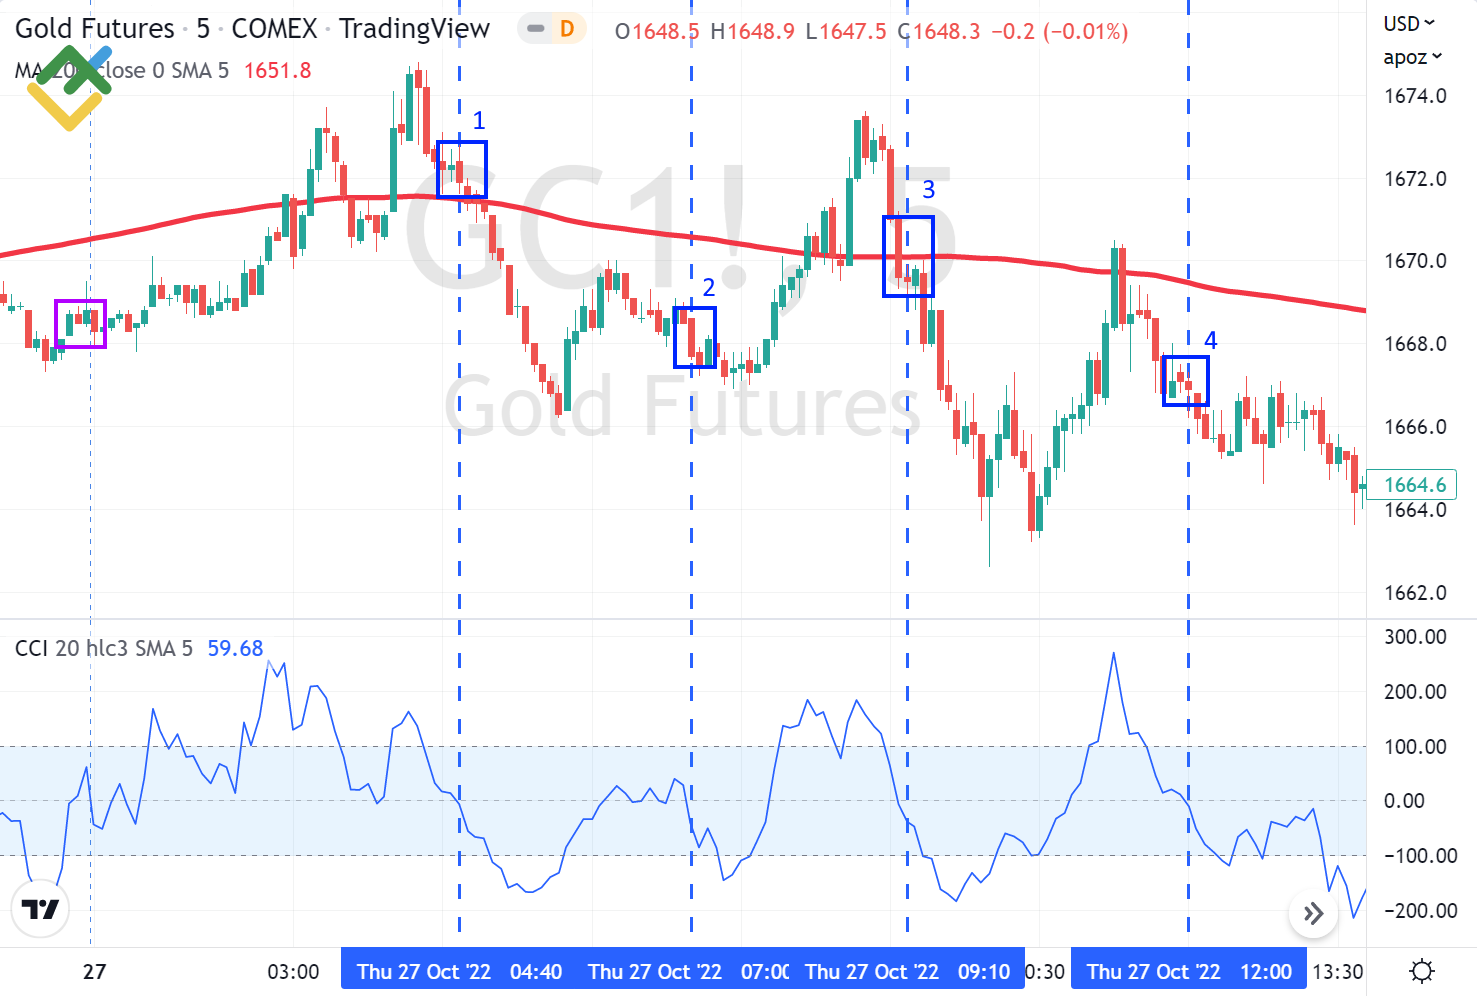
Finally, let us look at the gold futures chart GC, timeframe M5. To determine the overall global trend, you can use a simple moving average with a period of 200. A sign of a trend change will be the closing of the trading day below/above this moving average. When working with level 0 of the CCI indicator, it is important to determine the trend; otherwise, the trades will be unprofitable.
You see from the above example that the previous trading day closes below the MA 200. It means that the trend is down at the moment. Therefore, we shall consider sell trades. An entry signal is sent when the CCI crosses the zero level downside.
During half of the day, four signals have formed. Signals 1 and 3 appeared when the price rolls back below the moving average with period 200, which strengthens the signals.
Signals 2 and 4 form under the MA 200. The signals are of usual strength. Signal number 2 doesn’t work, the price doesn’t go in the needed direction, and the trade is exited with a loss.
A stop loss is set according to the following rules:
- The stop loss is set above the high or below the low of the candlestick, on which the signal has formed, providing that the candlestick range is equal to or wider than the average daily range for the instrument. If the candlestick is of medium size, the stop loss is set above its high or below its low.
- If the signal candlestick is of a narrow range, it makes sense to consider the previous candlestick as a reference for high/low to set a stop loss.
- If the signal candlestick is twice or more greater than the average range, the stop loss is set at the middle of this candlestick.
Signals 1,2, and 3 worked out and yielded a profit, based on the principle that the take profit is greater than the stop loss by three times.
In conclusion, I can note that intraday trading is always associated with the maximum concentration of a trader's attention. You should spend much time monitoring the trading chart, which is compensated by many trading opportunities.
Signals appear frequently, such a frequency can cause a trader to overtrade. It is also necessary to take into account important financial news, they can bring significant price fluctuations and changes in the technical analysis picture of the market. Therefore, I recommend starting intraday trading only after a detailed study of the CCI indicator and gaining experience in trading in longer timeframes.
Trading with CCI indicator: Summary
The Commodity Channel Index is a good tool for any trader. In many ways, the principle of its operation is similar to other oscillators, but it also has its own unique features.
The indicator allows you to find overbought and oversold levels of the market of different strengths: +100 and -100, +200 and -200, etc. Using the indicator, you can find the optimal entry points for trading within the global trend. You can also trade in a correction.
The strongest signals from the indicator appear when divergences form between the price charts and the signal line of the indicator.
The CCI indicator is available in any popular trading platform, and if you need to calculate the indicator value manually, you can use an Excel spreadsheet.
The best timeframe for trading with the commodity channel index CCI indicator is D1, but you can trade in a shorter timeframe as well. To do this, you need to add some trend indicators to the trading system in order to reduce the number of false signals.
The CCI indicator is worth your attention, and I hope this article has been useful to you. Having studied the theory, you can move to practice and start trading with the CCI here.
Commodity Channel Index FAQs
The commodity channel index CCI is primarily used as an oscillator to look for overbought and oversold areas in the market. Also, the indicator allows you to trade with the trend and in the correction.
The indicator definitely deserves attention. With proper use, you can find excellent entry points with a small Stop Loss and a large Take Profit. Based on the CCI indicator, you can create a full-fledged trading system.
The Woodies CCI indicator is a trading system based on two classic CCI indicators with different periods. The period of the first CCI is 14. The period of the second CCI is 6. The second indicator in the system is called Turbo CCI or TCCI.
First, you need to determine the trend in the market. This is done using the “6+ bars” rule. After determining the trend, you need to start looking for patterns to enter a trade. There are several entry patterns: a pullback from the zero line, a reverse divergence, a breakout of a trendline following a trend, and a breakout of a horizontal trendline following a trend. Stop loss is set at ½ or ¼ of the daily ATR.
Trend indicators work well with the commodity channel index CCI, such as the simple Moving Average, as well as entry point indicators, such as Price Action. Price Action, in combination with the CCI indicator, allows you to enter trades with the best profit/risk ratio and increase your potential profit.
The difference between RSI and commodity channel index CCI is that RSI is a momentum oscillator, expressed as a percentage, while CCI is expressed as a quantity. The RSI is mainly used to find overbought and oversold areas, as well as divergences, while the CCI can still be used to enter trades following the trend. The CCI indicator has strong and weak overbought and oversold levels, while the RSI indicator has so-called overbought and oversold market areas. Also, CCI is a leading indicator.
It is impossible to say definitely which is better, MACD or commodity channel index CCI. Both indicators are oscillators, but they generate different signals. Each of the indicators has its own characteristics, so you need to use them considering the type of market, instrument, and volatility.
The signal to buy in the commodity channel index CCI is the crossing of the zero line from the bottom up. Also, a buy signal may be the CCI signal line reaching the level of -200 and the formation of a bullish divergence between the price chart and the indicator chart.
The content of this article reflects the author’s opinion and does not necessarily reflect the official position of LiteFinance broker. The material published on this page is provided for informational purposes only and should not be considered as the provision of investment advice for the purposes of Directive 2014/65/EU.
According to copyright law, this article is considered intellectual property, which includes a prohibition on copying and distributing it without consent.