


The ADR indicator is based on statistical analysis of past price movements. It helps traders boost their profits by highlighting levels where they can lock in gains and open new positions.
The article provides the ADR indicator formula and calculation, and describes the most common trading strategies. You will learn how the ADR indicator differs from the ATR and IR indicators and discover some tips on how to use them. Besides, you will find out what the average daily range is and how to utilize it in the Forex market.
The article covers the following subjects:
- Major Takeaways
- What is Average Daily Range (ADR)?
- How to Calculate the Average Daily (ADR)
- Why is the ADR Useful?
- Average Daily Range (ADR) Settings and Exterior
- Trading Signals of the ADR Indicator
- Average Daily Range (ADR) Indicator for MT4 and MT5
- How to Use the Average Daily Range (ADR) in Trading
- Using the ADR Indicator in Trading Strategies
- Comparing ATR, ADR, and IR (AIR)
- Conclusion
- Average Daily Range FAQs
Major Takeaways
- The ADR indicator shows the average price range per day.
- ADR is used to gauge volatility and determine target levels.
- The indicator helps set take-profit and stop-loss levels.
- Suitable for intraday trading and lower time frames.
- Unlike ATR, ADR calculates only the daily price range.
- Effective when combined with other technical analysis indicators and patterns.
What is Average Daily Range (ADR)?
The ADR (Average Daily Range) indicator is similar to the ATR (Average True Range) technical indicator. It calculates the average daily movement of an asset over a specified period using a simple arithmetic mean and the highest and lowest values of each trading day.
To make an informed decision on whether to buy or sell an asset, you need to know how much room there is left for the trading instrument to move. This is particularly relevant for day traders. Before opening a trade, you should understand how many pips the price can go up or down.
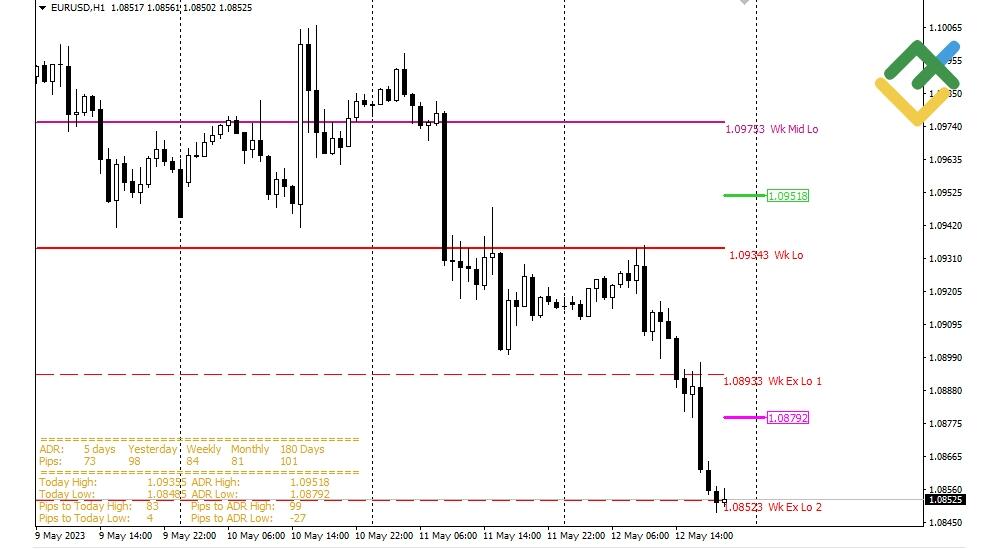
The ADR indicator provides this data. The basic version of the volatility indicator displays the same information as the ATR indicator, with similar period and smoothing settings. However, traders prefer the advanced versions of the indicator, which display ADR levels on a price chart.
You can utilize the ADR indicator to perform technical analysis of any financial instrument on any time frame. The main idea is to assess the current market situation. If the price is significantly below the High ADR level in an uptrend, you can open a long trade. Conversely, if the price is well above the Low ADR level and the trend is bearish, you can initiate a short trade.
This is how the indicator looks when applied in MetaTrader 4:
How to Calculate the Average Daily (ADR)
The ADR is typically calculated over a 20-day period. However, some strategies that focus on short-term trends in the Forex market may use a shorter period, such as 5 days.
Let's calculate the ADR Forex indicator for a 5-day working week. First, we need to find the highest and lowest values for each day. The table below shows the EURUSD currency pair values as of April 26, 2023.
Date | High, $ | Low, $ |
25.04 | 1.10670 | 1.09641 |
24.04 | 1.10501 | 1.09657 |
21.04 | 1.09937 | 1.09377 |
20.04 | 1.09895 | 1.09332 |
19.04 | 1.09840 | 1.09172 |
Let's use these values in the calculation. Here is the ADR formula:
ADR = ((DR1 + DR2 + … + DRn) / n), where DR = |high-low|.
Next, we substitute the values into the formula:
- ADR = (|1.10670-1.09641| + |1.10501-1.09657| + |1.09937-1.09377| + |1.09895-1.09332| + |1.09840-1.09172|) / 5;
- Let's simplify: (1029 + 844 + 560 + 563 + 668) / 5;
- ADR = 732 points.
Why is the ADR Useful?
Main advantages of the ADR indicator:
- automatically calculates the average daily price movement;
- displays the results directly on the chart for better clarity;
- in some versions, calculates the average weekly and monthly price movement;
- can be combined with other technical tools to form a comprehensive trading system for various financial markets.
However, it also has some drawbacks. Its basic version is no different from ATR. Additionally, there are quite a few modified versions. Some versions of the ADR trading indicator plot levels based on the daily opening price, while others use only the highest and lowest values for price range calculation.
Average Daily Range (ADR) Settings and Exterior
The Average Daily Range indicator has a few setting parameters:
Parameter | Description |
Day_x | Indicator period. The number of trading days for calculating the average daily movement of an asset. |
Corner | The location of the information window on a chart. You can select the following options: 0 — upper left corner; 1 — upper right corner; 2 — bottom left corner (default); 3 — bottom right corner. |
Daily_High_Color | The colour of the High ADR level. |
Daily_Low_Color | The colour of the Low ADR level. |
Show_Daily_High_Low_Lines | Enables/disables the average daily price range boundaries. Yes/No |
Show_Weekly_Lines | Displays weekly price movement levels. Yes/No |
The volatility indicator with default settings in the MetaTrader 4 terminal:
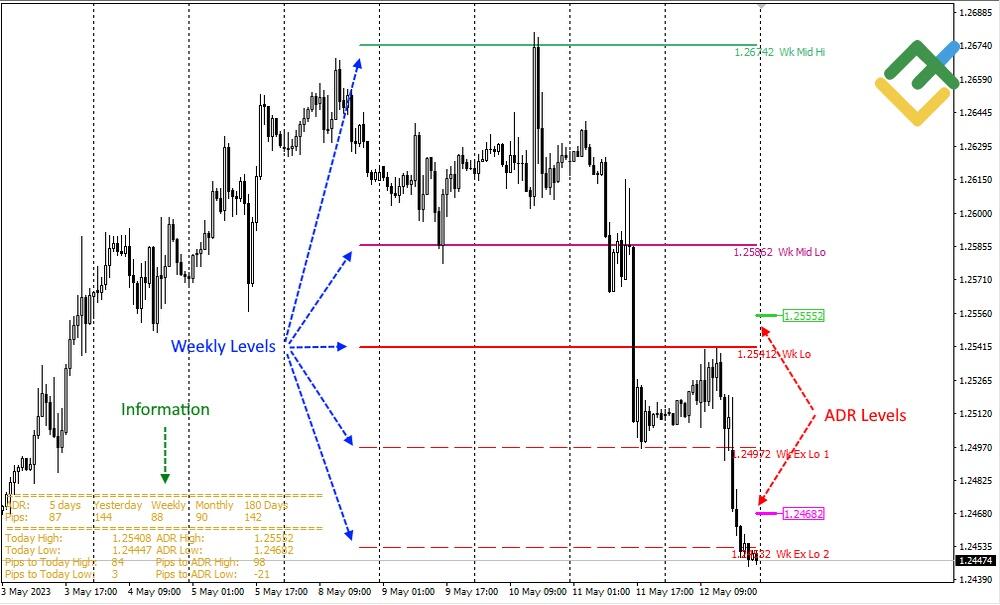
- Information — window displaying the indicator data;
- Weekly Levels — lines showing weekly highs and lows;
- ADR Levels — ADR high and low levels.
Trading Signals of the ADR Indicator
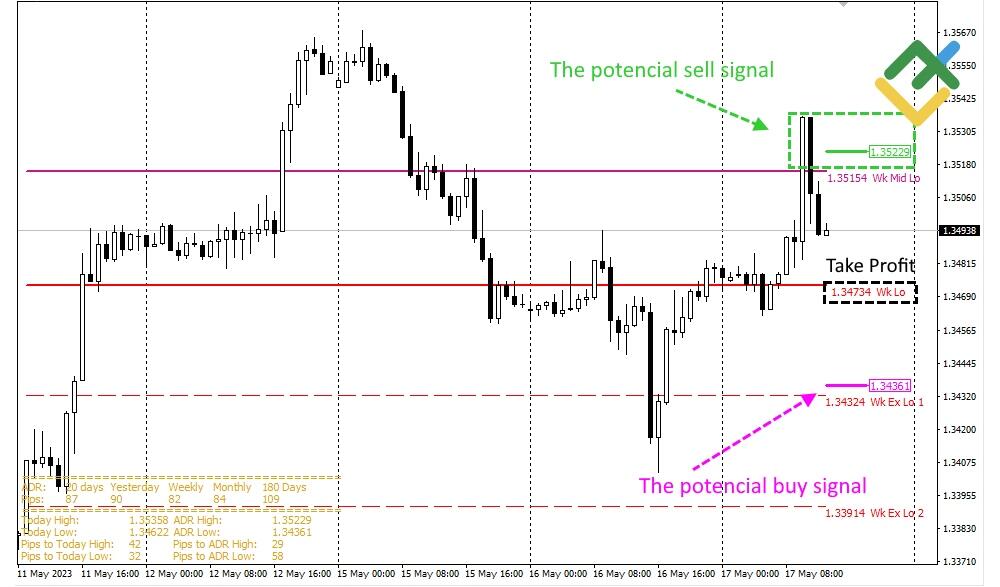
The high and low levels serve as benchmarks for locking in profits and can become reversal points. Remember that the price trades within the ADR range most of the time. Therefore, once the high/low is reached, you can consider opening trades in the opposite direction: short trades at the high level and long trades at the low level. The profit target will be either the nearest weekly level or the opposite ADR level.
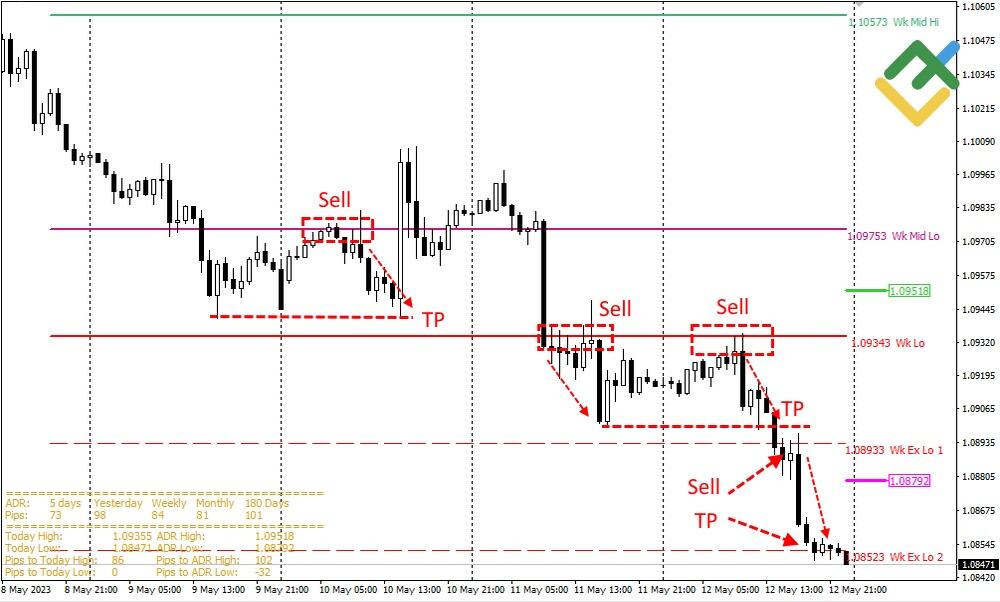
Some versions of the indicator can display weekly levels, which are also an excellent guide for locking in profits on medium-term trades. These levels act as support and resistance levels. They are calculated using a weekly time frame, which makes them more reliable than the standard ADR Forex indicator levels.
Average Daily Range (ADR) Indicator for MT4 and MT5
Unfortunately, the MetaTrader platform does not offer a built-in Average Daily Range indicator. However, various versions can be easily found online:
How to Use the Average Daily Range (ADR) in Trading
How the ADR indicator works:
- if volatility increases, the average daily range (ADR) expands;
- if volatility decreases, the average daily range (ADR) narrows;
- a rise in market volatility may indicate that the price is about to break through the flat range, while a decline signals a possible sideways movement;
- the closer the price is to the ADR level, the lower the potential profit; the further the price is away from the ADR level, the higher the potential profit;
- indicator levels represent support and resistance lines.
Using the ADR Indicator in Trading Strategies
The Average Daily Range indicator is best suited for intraday traders, especially those using the ADR trading indicator as part of a broader day trading indicator toolkit to define entry points, daily profit targets, and stop-loss/take-profit levels.
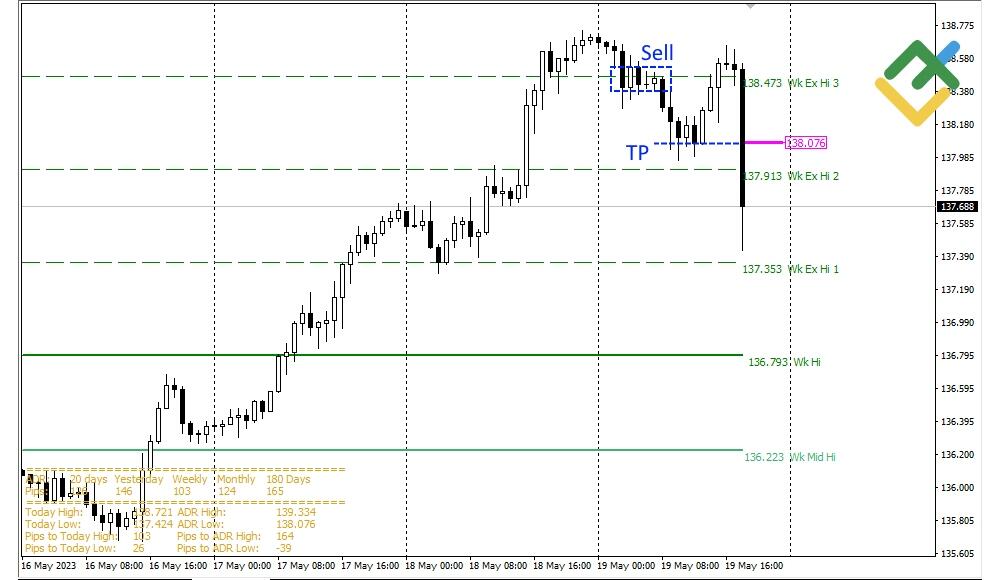
Weekly levels can be used as support and resistance lines. A trader should wait for the level to be tested and then watch the price. If a Price Action signal forms at the support/resistance levels, a long or short trade can be opened. A take-profit order should be set at the opposite level.
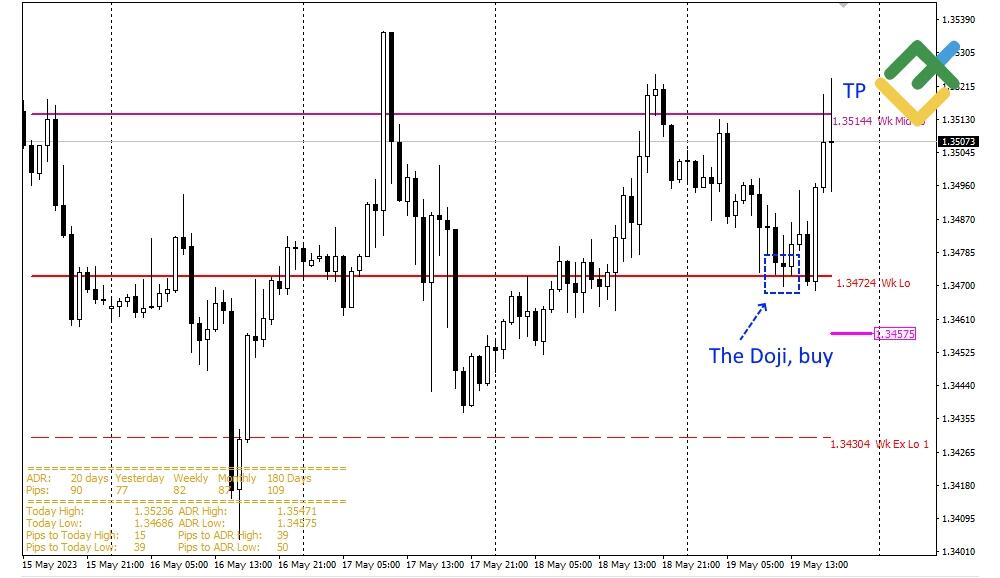
Another way to use the indicator in your trading strategies is to trade breakouts of the previous day's low or high, using the average daily range as a reference. In this case, a take-profit order should be placed at the ADR Forex indicator value. To trade successfully using this method, you need to identify the prevailing trend and open trades in its direction. Such strategies work well for traders whose trading style relies on combining technical indicators with an understanding of price behavior.
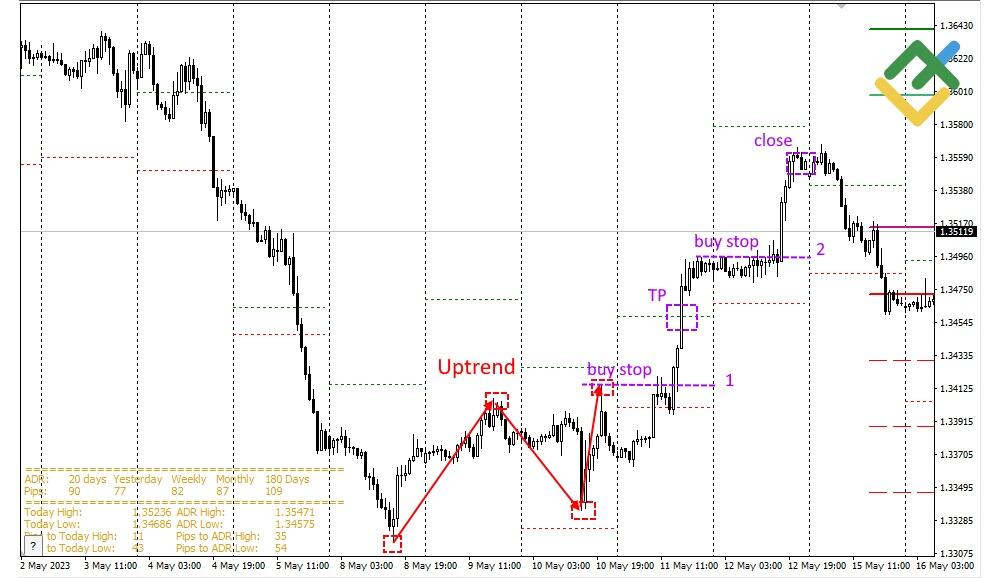
In the example above, the first trade was opened at the breakout of the previous high and closed at the ADR level. In the second trade, the price failed to reach the ADR Forex indicator value by the end of the trading day. Since trading within the ADR range involves opening and closing trades within a single trading day, the second trade should be closed manually.
ADR and Renko Swing Trading Strategy
RenkoSwing is a scalping trading strategy based on several standard MetaTrader indicators, including the ADR indicator.
This strategy benefits from using non-standard Renko charts. Besides, the following indicators are used to filter out signals:
- A 50-period SMA helps you identify the prevailing trend.
- When the 5-period EMA and 8-period SMA cross, they generate signals to open and close trades.
- The Stochastic indicator with settings 14,3,3 (or 15,4,4 / 15,5,5) allows you to eliminate invalid trading signals.
- ATR with a period of 60 is a volatility filter.
Moreover, there are free advisors and templates for MT4.
A buy signal in the RenkoSwing strategy occurs when:
- the price is above the red 50-period moving average (MA) line;
- the purple 5-period MA crosses above the green 8-period MA;
- the ATR indicator is positioned near the middle of the range rather than near swing highs or lows;
- both Stochastic lines are moving up, exiting the oversold zone.
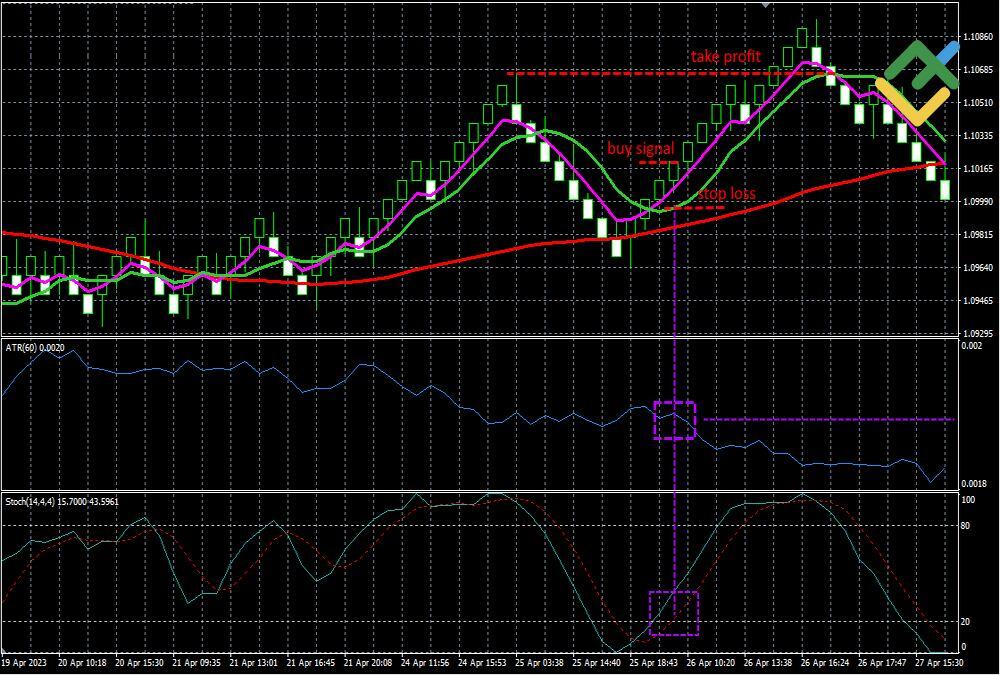
A sell signal in the RenkoSwing strategy emerges when:
- the price is below the red 50-period moving average (MA) line;
- the purple 5-period MA crosses below the green 8-period MA;
- the ATR indicator is located near the middle of the range rather than at local highs or lows;
- both Stochastic lines are moving down, exiting the overbought zone.
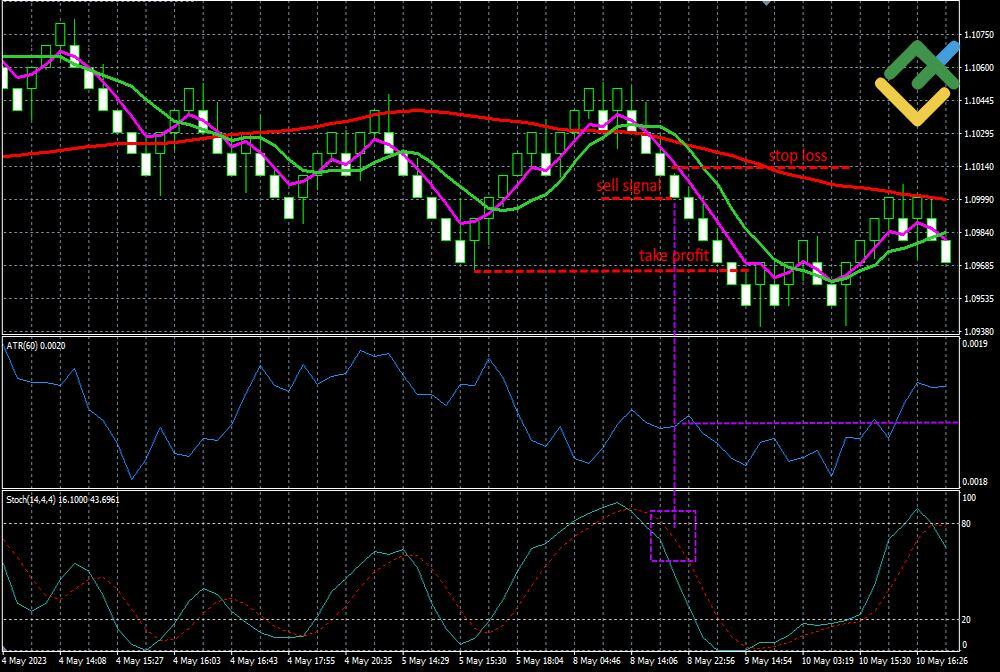
A take-profit order is set at the nearest price high or low. A stop-loss order should be placed at half that distance from entry.
ADR Indicator and Price Action Strategy
This straightforward strategy is based on weekly ADR levels and the Price Action patterns.
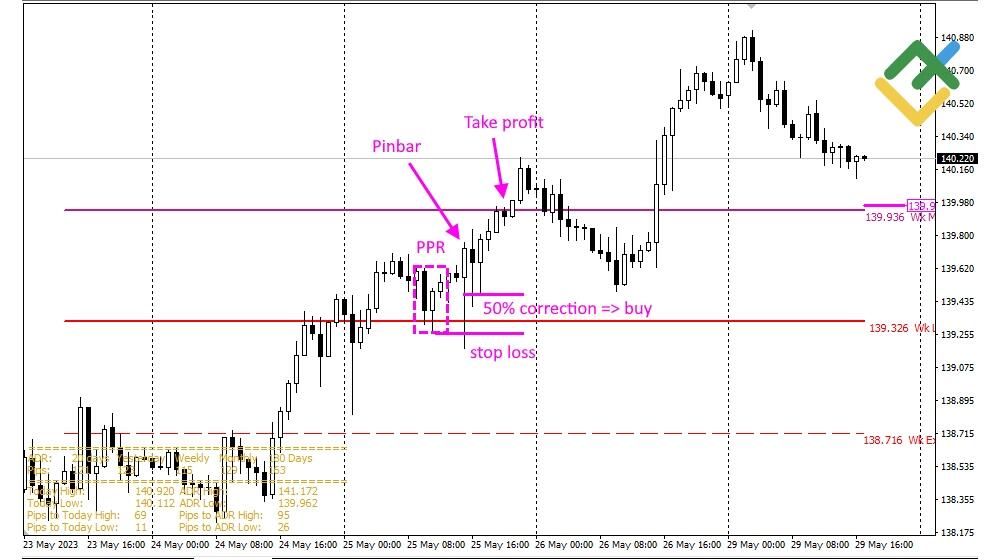
In this strategy, the Average Daily Range (ADR) is the primary indicator, plotting weekly levels (on the MT4 platform). Trade entry signals are determined using simple Price Action patterns, such as Pin Bar, Railway Track, PPR, Bullish Outside Vertical Bar, Bearish Outside Vertical Bar, Bullish Engulfing, and Bearish Engulfing.
A buy signal emerges when:
- the price tests the ADR level from above;
- the level remains unbroken;
- a Price Action pattern forms.
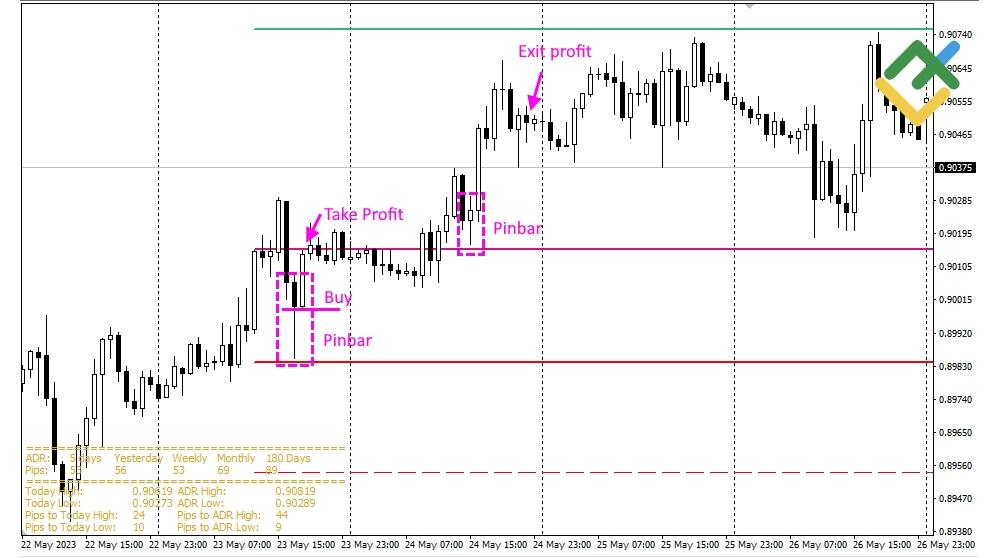
Another example:
A sell signal appears when:
- the price tests the ADR level from below;
- the level remains unbroken;
- a Price Action pattern forms.
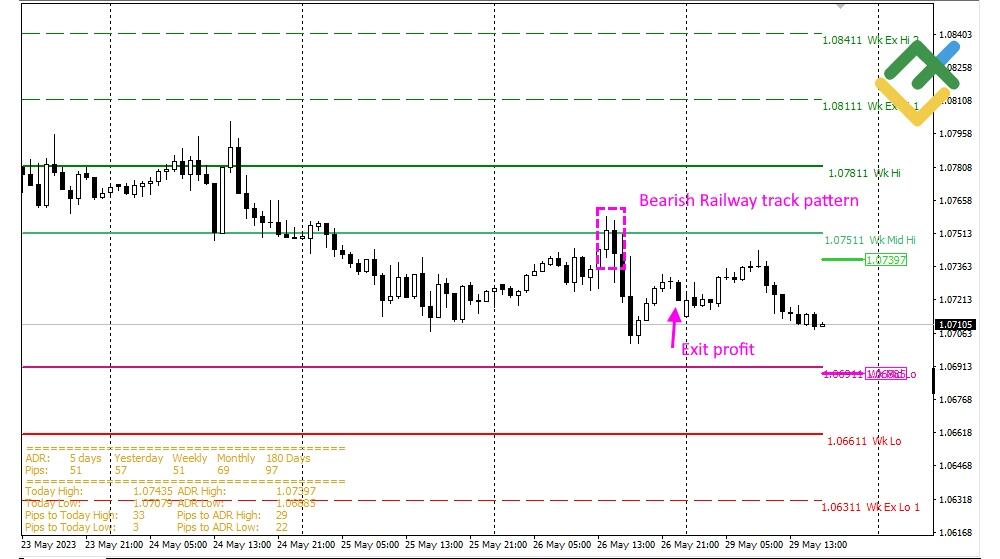
Here’s another scenario:
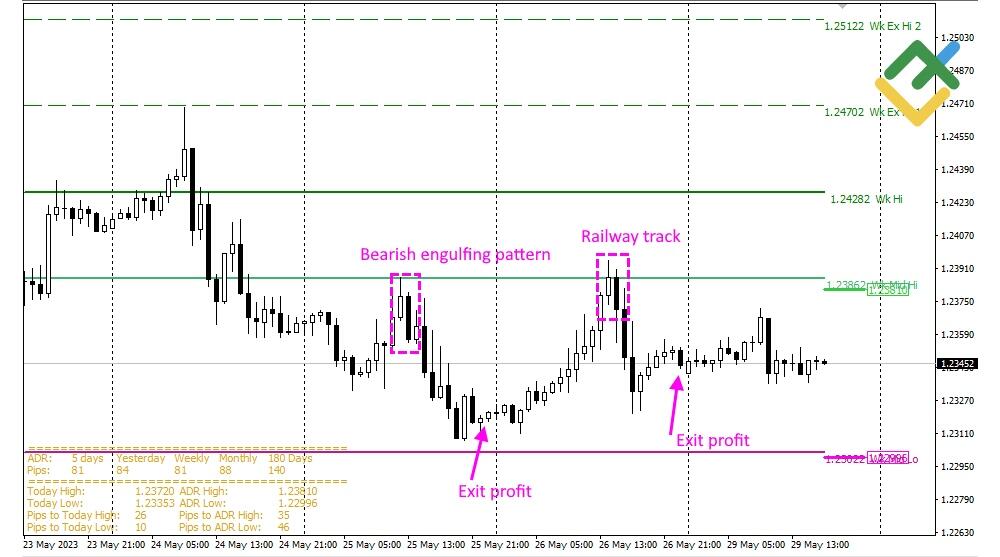
A stop-loss order should be placed beyond the pattern's high/low. A take-profit order is set at the opposite weekly ADR level. If the price does not reach the target level by the end of the trading day, the position should be closed manually. Additionally, it is advisable to follow the trend when trading using this strategy to avoid false signals.
Comparing ATR, ADR, and IR (AIR)
Average True Range (ATR), Average Daily Range (ADR), and Intraday Range (IR) represent a group of indicators that show the average volatility of an asset.
The ATR indicator shows the average volatility of an asset, indicating whether it is increasing or decreasing. Moreover, the degree of volatility can be determined on any time frame.
Traders use the ADR indicator to determine the average daily price range. This tool is more suitable for determining exit points and gauging a trade's profit potential.
The IR (AIR) indicator measures the difference between the high and low of each price bar, expressed as a percentage of the opening price. By analyzing its readings, traders can identify bars that deviate significantly from typical price movements.
Indicator | Expressed in % or $ | Considers gap | Average value | Describes each bar |
ATR | Commonly in $ | Yes | Yes | No, only the average value is shown |
ADR | Commonly in $ (sometimes in %) | No | Yes | No, only the average value is shown |
IR | % or $ | No | Yes (can be enabled in the settings) | Yes |
Conclusion
ADR (Average Daily Range) is an indicator that displays the average daily price range for a specified number of previous trading sessions. Essentially, it measures how many pips, on average, an instrument moves from its low to its high during a day. For example, if the ADR is 80 pips, it means that the currency pair has moved an average of 80 pips from one extreme to another over the last N days. The indicator can be calculated for different periods. The most commonly used periods are 5, 10, or 20 days.
The ADR indicator is particularly useful for intraday trading because it helps to evaluate the potential range of price movement. The indicator helps to determine whether the price has enough momentum to continue moving or whether the market has already exhausted its daily range. This is especially important when entering trades. If the price has already passed 90–100% of the average daily range, the odds of a slowdown, consolidation, or even a reversal increase. In addition, when combined with key support and resistance levels, it becomes a powerful reference for placing take-profit orders and assessing risk.
Average Daily Range FAQs
In Forex trading, the ADR can help you decide when to close an intraday trade. If the price has already moved as far as its average daily range or even exceeded that range, the probability of a reversal or consolidation increases.
ADR is calculated as the arithmetic mean of the daily ranges (High − Low) for a specified period, for example, 14 days. Calculation formula: ADR = (Σ(High − Low) for N days) / N.
The ADR indicator outlines the likely price boundaries for the day, with about an 80% chance that the market will stay within those levels. In other words, most of the time, the price will trade inside the ADR range, while the remaining 20% of cases are usually impulsive moves.
A 20-day period is a good way to estimate the average daily range for a month. To find the average daily range for the last week, use a 5-day period instead. You can apply either an EMA or an SMA to smooth the values.
The ADR indicator cannot be classified as either a lagging or leading indicator, as it does not determine trends. Its primary function is to display the average daily price movement of an asset over a specified number of days.
The average value of ADR will be different for each asset. It depends on numerous factors, such as the asset class (stocks, currencies, commodities, cryptocurrencies), whether it is speculative, safe-haven, or risky asset, and whether it is popular among traders.
The content of this article reflects the author’s opinion and does not necessarily reflect the official position of LiteFinance broker. The material published on this page is provided for informational purposes only and should not be considered as the provision of investment advice for the purposes of Directive 2014/65/EU.
According to copyright law, this article is considered intellectual property, which includes a prohibition on copying and distributing it without consent.