
This article deals with the Chaikin Accumulation/Distribution indicator. You will find a detailed description of the indicator, its calculation formula, and trading signals. You will also learn trading strategies and patterns generated by the A/D lines and have a look at some other similar indicators.
We shall also analyze Accumulation/Distribution pros and cons, assess the profitability of trading with the A/D indicator, and give some tips on how to use the tool in Forex trading with maximum profit.
The article covers the following subjects:
- What Is the Accumulation/Distribution Indicator (A/D)?
- The Accumulation Distribution Formula
- What does the A/D indicator measure?
- How to Read Accumulation/Distribution Chart?
- How to Use Accumulation/Distribution Indicator?
- Accumulation/Distribution vs. On-Balance Volume (OBV)
- A/D vs. CMF (Chaikin Money Flow)
- Advantages and Disadvantages of the A/D Indicator
- Conclusion
- Accumulation/Distribution Indicator FAQs
What Is the Accumulation/Distribution Indicator (A/D)?
The Accumulation Distribution indicator is a technical momentum indicator that analyzes the relationship between price and volume changes. The A/D indicator was developed in the 1980s by Marc Chaikin, a stock analyst and CEO of Chaikin Analytics, LLC.
The accumulation distribution indicator is the basis of the Chaikin trading system and is part of another technical tool, the Chaikin oscillator.
Initially designed to trade in the stock exchange, it is widely used in other financial markets, including Forex.
Unlike the Accumulation/Distribution Index (WAD) by Larry Williams, which compares the opening and closing prices of the day, or the On Balance Volume OBV indicator by John Granville, which uses the previous and current closing prices, the A/D compares the closing price to the middle of the low to high range.
In his analysis, Chaikin could use the developments of Larry Williams. However, he needed the opening price data of the trading day. Since the information was spread through newspapers in the 1980s, these figures were difficult to obtain. Newspapers rarely listed the opening stock's price of the day, and the data was published belatedly. Therefore, to analyze financial instruments at that time, Chaikin had to develop his own methodology.
To understand how to trade the A/D accumulation distribution indicator, you need to understand the terminology.
What is Accumulation and Distribution?
Accumulation is a situation when market participants buy assets, counting on the asset’s price growth. First, there is an accumulation of positions, and then the price rises. It is on this principle that the accumulation distribution indicator is based.
Conversely, when the bull market reaches its maximum, the sale of assets begins, that is, their distribution among market participants. Then the price goes down. As soon as the distribution ends, the market returns to the initial cycle - accumulation. These two stages repeat alternating each other.
In the Forex market, the indicator works a little differently since a currency pair contains two currencies. The A/D line declines when sellers dominate the market and rises when buyers gain control.
The theory of the A/D indicator is a volume based indicator. It suggests the volume is more important than the price. Without trading volume, the price would stand still. To move the price, the asset must be bought (accumulation) or sold (distribution), which means a high volume is required.
What instruments and market does the indicator work in?
Chaikin's accumulation distribution indicator works in any market and can be employed in trading CFDs, stocks, commodities, currencies, or cryptocurrencies.
The best timeframe for analysis is D1 (daily). The indicator can also be used on H1, H4, and W1 timeframes. Using timeframes shorter than H1 makes no sense, as the market noise will generate a lot of false signals. It is possible to switch to periods longer than W1 in the case of long-term investment because the position holding period will be measured in years.
A/D indicator exterior
By default, the instrument is located under the trading instrument chart. There is only one colored line in the accumulation distribution indicator window, the color of which can be adjusted in the settings. It is called the accumulation/distribution line.
The accumulation distribution line is expressed in quantitative terms. It can be positive ("+") or negative ("-"), depending on the trend direction and the period's volume accumulated by buyers or sellers.
The situation when the line of the A/D indicator is growing characterizes a bullish trend. And when the line goes down, the trend is bearish.
What is Accumulation and Distribution Line?
The accumulation distribution line is a mathematical indicator of the market state based on the trading volume. It helps to confirm or refute the strength of the current trend.
The accumulation distribution line performs two tasks: confirming or refuting the ongoing trend. If the indicator line goes in the same direction as the price movement, the trend is confirmed. In this case, you can enter trades in the trend.
If the price chart moves in one direction, and the indicator line stands still or moves in the opposite direction, a divergence occurs; that is, the trend is not confirmed. In this case, you should be careful and prepare for possible price reversals.
The Accumulation Distribution Formula
As mentioned above, the Accumulation/Distribution oscillator analyzes whether an asset is accumulating or distributing at the moment. To do this, the tool estimates the cash flow that enters or exits the asset. To understand whether funds are flowing into an asset, the indicator analyzes the trading volume and trading range.
You do not have to memorize the indicator formula. Modern trading platforms will automatically carry out the necessary calculations. However, in order to understand how the A/D indicator works, it is useful to know the accumulation distribution formula and what components it consists of. The accumulation/distribution calculation consists of 3 steps.
Calculation of Close Location Value (CLV)
The closing position value acts as a parameter [1; -1], which is multiplied by the current trading volume. Chaikin, the author of the A/D indicator, proposed the following formula for calculating the close location value:
CLV = [(Close - Low) - (High - Close)] / (High - Low), where
Close — closing price;
High — maximum price for the period;
Low — minimum price for the period.
To describe the formula, let's take the Close price equal to 3. According to the formula, we can have five different outcomes, for each of which the CLV value will be in the range from 1 to - 1 inclusive:
- 3 = High; CLV = 1;
- 3 = Low; CLV = -1;
- 3 = the middle of the range; CLV = 0;
- 3 is in the upper half, below the High but higher than the middle of the range; CLV = (0;1);
- 3 above Low but below the middle of the range; CLV = (-1;0).
Define the money flow
After we have found the value of CLV, we need to determine the money flow multiplier by multiplying the CLV by the volume. A negative money flow means that money is leaving the asset. Positive - the money is coming.
Cash flow = CLV × volume
Sum up the values
Since Chaikin’s invention is a cumulative indicator, the current value of the A/D line is obtained by summing up the previous values. The first value of A/D is equal to the cash volume flow for the given period. Subsequent values of A/D are equal to the sum of the current money flow and the previous values.
A/D = previous A/D + cash flow
Thus, the accumulation/distribution line consists of the cumulative measure of money flows into or out of the asset. Accordingly, the value of the indicator can be positive if the money inflow is greater than the outflow. It will be negative if more money leaves the asset than comes in.
The ultimate indicator accumulation distribution formula looks like this:
A/Dn = ((Close - Low) - (High - Close) / (High - Low) × Volume) + A/Dn-1
What does the A/D indicator measure?
The A/D indicator measures the money flow volume for the current period, for example, one trading day, and compares it with the cumulative flow for the previous period. In other words, the tool marks the inflow and outflow of money.
The value is displayed in digital form and takes into account past performance. Based on this information, the trader sees how the instrument is currently being traded.
Money flow can be characterized in another way. If the volume increases and the price rises, then the market is dominated by bulls. Therefore, the trend is up, and you should buy. If the volume increases and the price falls, then the market is dominated by bears. In this case, the trend is down, and you should sell.
There are also situations when the period's money flow volume decreases, and the price rises. This usually indicates that the buyers are exhausted and that a correction may soon begin. Conversely, if the volume declines and the stock price continues to fall, sellers have probably lost strength. In this case, the market may go into an upward correction in the near future.
The Chaikin A/D indicator measures the balance of power between buyers and sellers in the market. The tool gauges the volume and the time during which this volume has passed. It also measures the result of trading operations: the price increased or decreased in relation to the middle of the period's range.
How to Read Accumulation/Distribution Chart?
The Accumulation Distribution line, like the price chart, can take three forms.
- The line is rising;
- The line is falling;
- The line is flat.
As a result, we get nine possible options, divided into three groups. Let's consider them in more detail and analyze the signals the indicator generates in each situation.
The A/D line is rising
The options probable when the A/D line is rising include:
- The A/D line is rising, the price is rising. It signals an uptrend supported by new purchases. This is a bullish trading signal; consider long positions. The A/D line is rising, the price is falling. There is a bullish divergence
- between the price and indicator charts, which often occurs in corrections. The positive divergence means the previous uptrend is likely to continue. Otherwise, the A/D line will turn down, and the trend will change downward.
- The A/D line is growing, the price is staying the same. The trader should be prepared for a continuation of the upward movement, as the indicator signals that purchases are taking place in the market. When participants accumulate the required volume, a strong price movement will begin.
The A/D is falling
The options probable when the A/D line is falling include:
- The A/D line is falling, and the price is falling. It signals a pronounced downtrend. The price is going down, supported by new sell trades. It is a bearish signal.
- The A/D line is falling while the price is rising. There is a bearish divergence between the price and indicator charts, which is usually characteristic of a correction. The negative divergence suggests that after the correction ends, the downtrend is likely to continue. Otherwise, the A/D line will reverse, and a new uptrend will begin.
- The A/D line is falling while the price is trading flat. It signals a likely continuation of the downtrend as the indicator signals active sales in the market. However, the Accumulation Distribution indicator is leading and will indicate the appearance of a sell signal.
A/D line remains still
- The A/D line is stagnant, as is the price. It means there is no clear trend in the market or liquidity is very low. Most likely, the market is trading flat. The indicator does not generate any signals. Trading using the accumulation/distribution indicator, in this case, is not recommended.
- The A/D line remains still while the price is rising. This signals divergence. The market is likely to head down in the near future, as the price increase is not confirmed by the increase in volumes.
- The A/D line remains still together with the falling price. It signals convergence. The price decline is not supported by trading volumes, so the price could start an upward movement soon. It is not recommended to enter sell trades; one should be prepared for a price increase.
How to Use Accumulation/Distribution Indicator?
The accumulation distribution indicator is used to confirm the trend and search for pivot points, which appear when the indicator line deviates from the price chart.
It is generally accepted that in an uptrend, most closing prices are formed near the high of the trading period. The arrival of new buyers to the market is accompanied by an increase in volume and, as a consequence, an increase in price.
In a downtrend, the situation is the opposite: most closing prices are formed near the low of the trading period. The emergence of new sellers in the market is also accompanied by an increase in volume, as a result of which the price falls.
Thus, using the accumulation/distribution indicator, one can note an increase in trading volume, which usually leads to a continuation of an upward or downward trend. It also helps characterize cash flow. If the indicator curve rises, the financial interest of buyers increases. If the curve declines, sellers begin to dominate the market.
The A/D indicator is used to generate the following signals:
- Trend confirmation;
- Divergence (deviation of the indicator from the price chart);
- Technical analysis patterns.
A/D Trend Confirmation
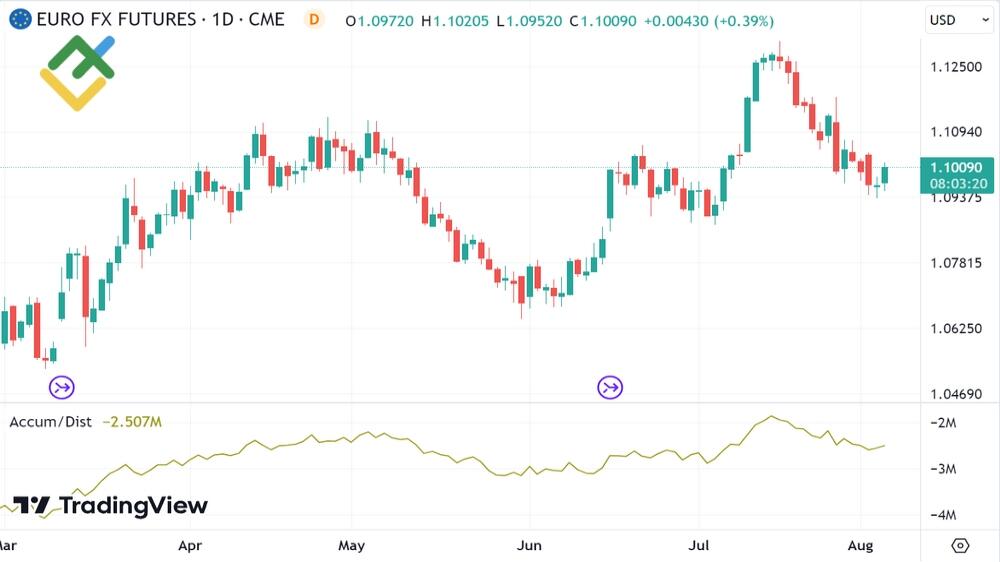
To confirm a trend using A/D, you first need to add an indicator to the chart. Then, determine whether the price movement has a clear direction. If the indicator line grows following the price and forms similar lows and highs, the trend is considered confirmed.
The example above displays the 4-hour #CL oil futures chart. Here, you can see that the price is growing and forming each new low and high higher than the previous ones. Now, let’s mark the same lows and highs on the A/D line.
In this case, the A/D line is growing, as well as the price chart. New lows and highs are also formed higher than the previous ones. Consequently, the upward trend in #CL oil futures has been confirmed, and you can open long positions.
A/D Trend Divergence
The divergence between the price chart and the indicator line will indicate a possible correction. To spot the differences, the directions of the charts are also compared, and then key highs and lows are noted on both.
If the price forms a new depression, and the A/D indicator chart forms a low above or at the level of the previous one, convergence occurs. In this case, a reversal signal is formed. The downtrend is not confirmed, and there is a chance of an upward correction or a trend change.
Let us consider another option for divergence in a downtrend. If the A/D line makes a new low below the previous one, and the price chart makes a new low above or at the same level as the previous one, a reversal signal appears. In this case, there is no confirmation of the trend; there is a risk of a correction or a trend change.

Look at the 4-hour timeframe in the #GC gold futures chart. Until the indicated point, the price was trading in a pronounced downtrend. The chart shows that the price has formed a low higher than the previous one, and the accumulation distribution line has set a minimum below the previous one. A divergence has appeared, and it is a sure signal to trade in the direction opposite to the trend, that is, to buy.

Here, you can see that after the divergence appears in a downtrend, it immediately appears in an uptrend. The price sets a new high above the previous one, while the A/D line sets the high at the level of the previous one.
If you mentally connect the highs on the price chart, as well as the highs on the A/D chart, with straight lines, you can see that the lines go in opposite directions. This means that a divergence has formed, a sure sign of an impending correction or a trend reversal. After a divergence has formed in an uptrend, the price falls and starts a descending correction.
A/D patterns
In addition to confirming the trend and forming divergences, the A/D indicator can draw patterns. At the same time, they are quite likely since they take into account the volume. The second advantage of accumulation/distribution patterns is that they tend to appear before similar signals in the price chart. This gives you the advantage of an early entry at better prices.
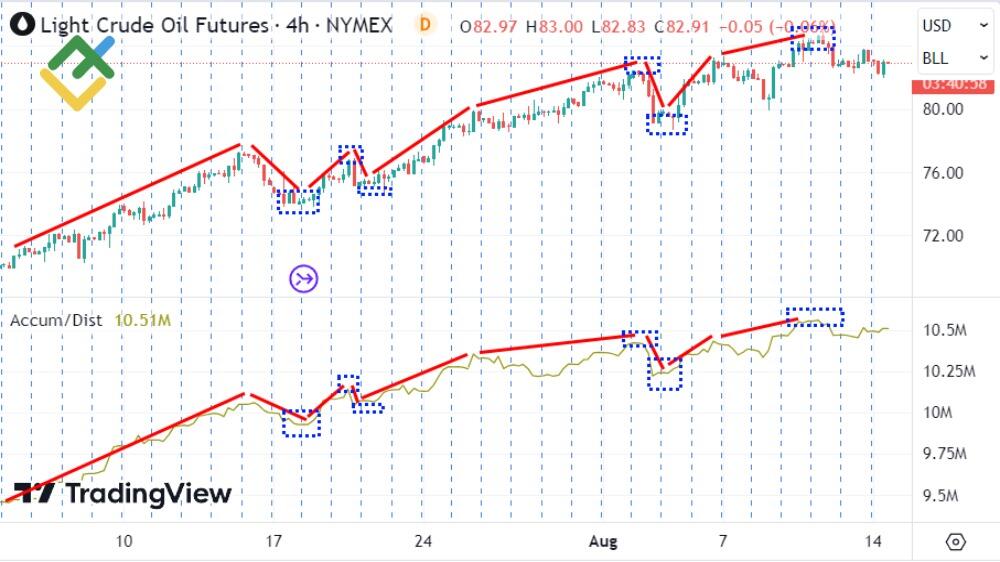
The chart above shows a false breakout pattern followed by a sharp price drop. Note that after the pattern had formed, the prices for selling the asset were the most profitable.
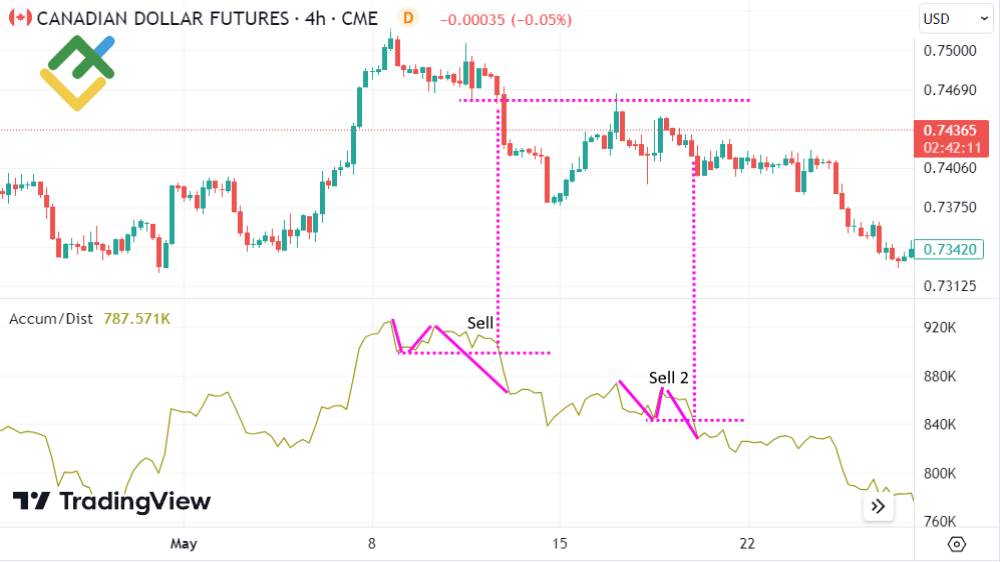
This screenshot shows two “1-2-3” patterns formed by the A/D line. As we see, in the first case, the appearance of the pattern led to a trend reversal, and in the second, to its continuation.
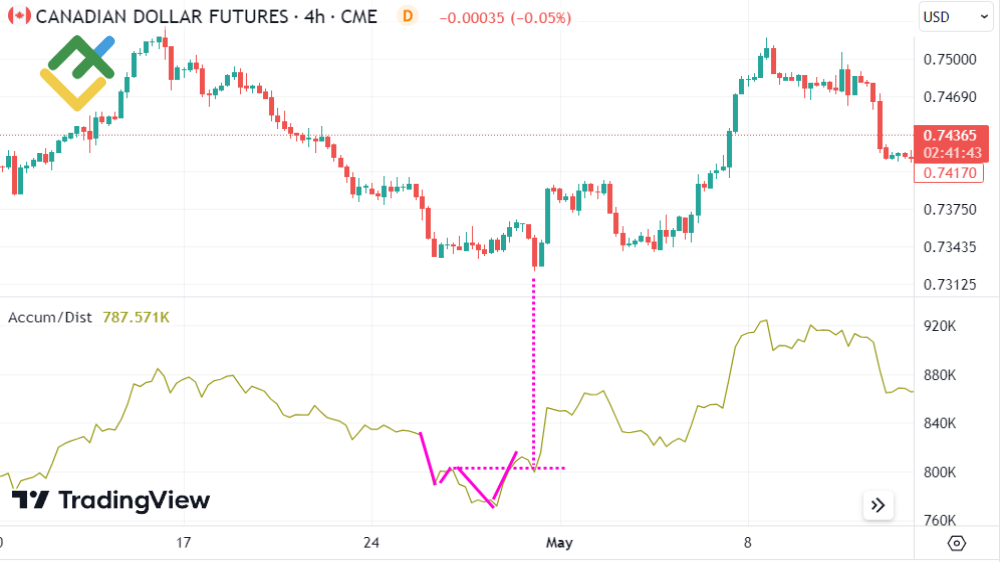
Above is an example of a false breakout pattern in a downtrend, which preceded an upward price reversal.
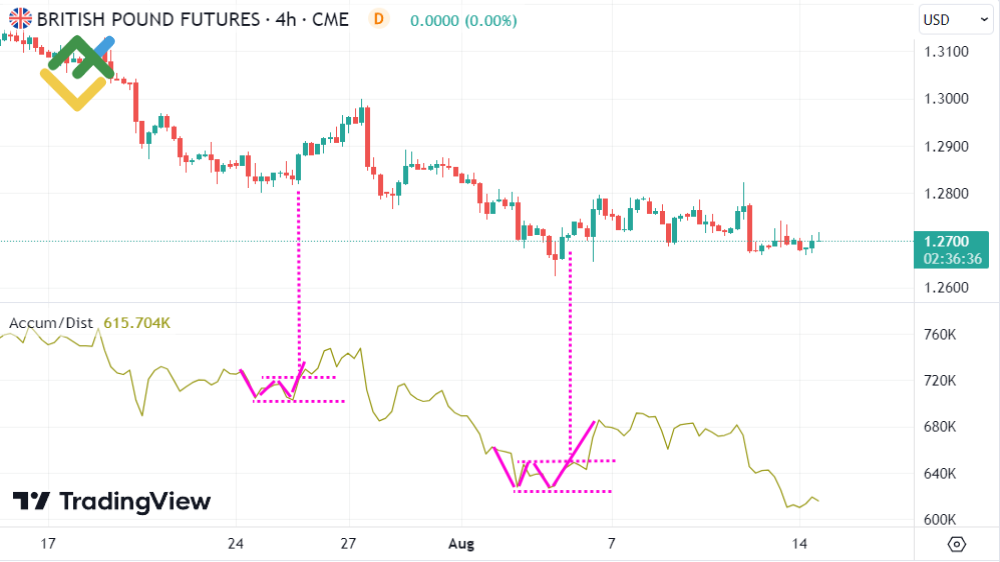
Finally, the above chart shows two double bottom patterns, which were formed in a downward trend and allowed one to trade in a correction.
Trading the A/D line patterns is no different from trading the price chart patterns. As a rule, you need to wait for a pattern to form. Then, when the key high or low is updated, it generates a buy or a sell signal, depending on the direction of the pattern formation.
Such technical analysis patterns as a triple bottom, a triple top, a pennant, a flag, various triangles, and others also work well with the accumulation/distribution chart.
Accumulation/Distribution vs. On-Balance Volume (OBV)
The On Balance Volume indicator, or OBV, is one of the first indicators designed to analyze cash flow. The OBV indicator was developed in 1963 by Joe Granville.
OBV works according to the following principle:
- if the current candlestick closes higher than the previous one, the volume of the current candle is added to the volume of the previous one;
- If the current close is lower than the previous one, the volume of the previous candlestick is subtracted from the preceding one; in this case, the trading volume can be negative.
Therefore, the OBV indicator sums volumes when prices rise and subtracts them when prices fall. The OBV line reflects the accumulated volume. As in the Accumulation/Distribution indicator, a rising line indicates an uptrend, and a falling line indicates a downward trend. Both tools are volume based indicators.
The OBV indicator measures buying and selling pressure and strength. It is calculated by adding the volume on rising days and subtracting it on falling days.
The A/D indicator has a more complex calculation formula and takes into account the closing price of the candlestick relative to its high and low. If the price of the candlestick closes around the high, then the closing position value will be positive. This means that in the future, the volume of this candle will be added to the running total. If the price of the candlestick closes near the low, the closing position value will be negative. This means that in the future results, the volume of this candle will be subtracted from the accumulated total.
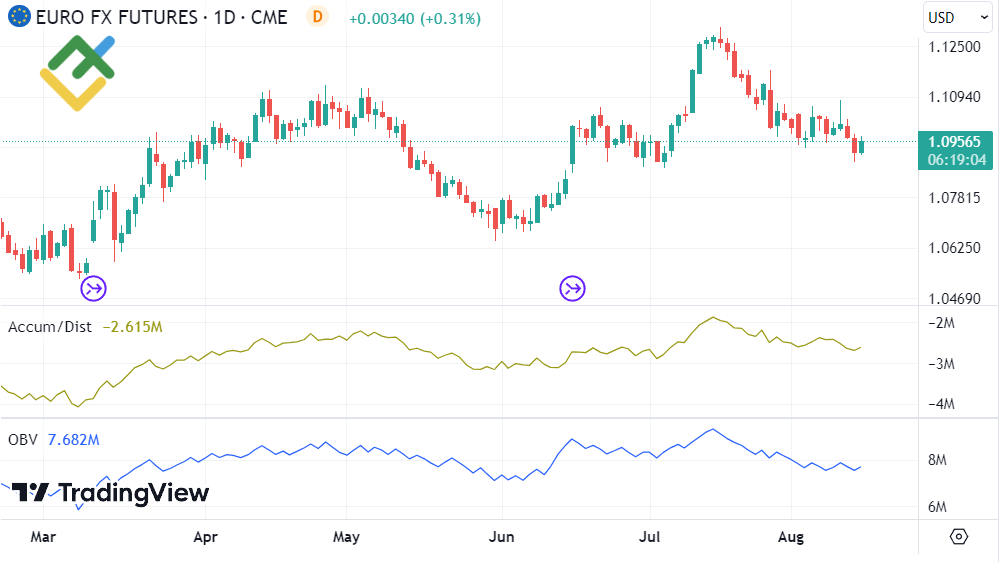
The A/D indicator analyzes the market differently, deeper than the OBV indicator. However, they are used in the same way, measuring buying and selling pressure. As can be seen from the chart above, their lines often repeat each other.
A/D vs. CMF (Chaikin Money Flow)
Chaikin Money Flow (CMF) was also created by trader and analyst Marc Chaikin; it belongs to complex instruments. Together with the Chaikin Accumulation Distribution Indicator and Oscillator, the cumulative money flow line makes up an independent trading system for the stock price analysis.
Chaikin Money Flow Index is a technical indicator of the oscillator category. Its value ranges from -1 to 1:
- -1 means maximum downtrend;
- 1 means maximum uptrend.
The indicator settings contain only one parameter - period. That is the number of days for which the indicator value is calculated. The default period is 20.
Since Chaikin analyzed price trends in the stock market, all of his inventions are designed for long time frames. Ideally - for a daily timeframe (D1).
The CMF formula looks like this:
Almost the same formula is used in the A/D indicator, only without the Period variable. It turns out that CMF is calculated for a strictly defined number of periods, and Accumulation/Distribution summarizes the entire cumulative volume. Thus, the value of CMF is limited to numbers from -1 to 1, and A/D can indicate any value.
There is also a difference in how these two indicators are displayed:
- A/D is a curve that rises or falls and often follows the price chart;
- The CMF is a curve that is bounded at the top and bottom and often fluctuates in a high low range, thereby resembling other oscillators.
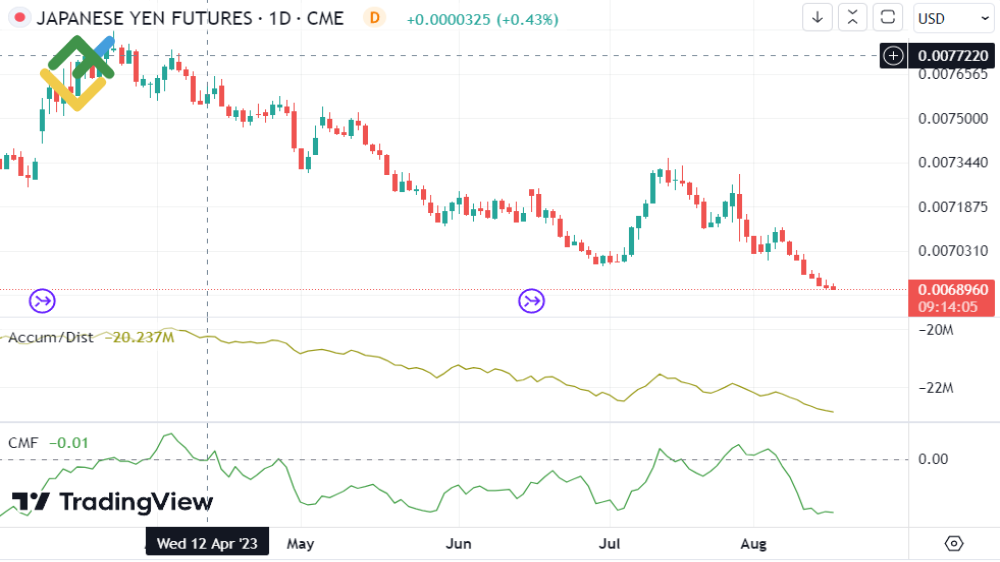
While the A/D indicator identifies and confirms trends, the CMF is more likely to detect the exhaustion of these trends, signaling that it is time to close a position. Just like A/D, CMF generates divergence signals that occur more frequently due to a preset period of 20 days.
Summing up, we can say that the A/D indicator is more suitable for trend trading since its main function is to confirm the trend and give a signal to enter a trade after the correction is completed. The CMF indicator is more suitable for range trading. Like any other oscillator, it shows critical points in the area where the momentum loses strength, and a reversal signal appears. Neither of the tools is a standalone indicator and should be supplemented by other technical indicators. Of course, no signals provided by a technical tool alone should not be considered investment advice. Traders must stick to risk management rules and handle personal finance wisely to avoid losing money rapidly from retail investor accounts.
Advantages and Disadvantages of the A/D Indicator
The A/D indicator is a useful tool in trading. It can confirm a trend and, in case of divergence, send an early signal that can indicate a correction or a continuation of the trend.
However, the accumulation distribution indicator has a number of drawbacks. For convenience, we describe the pros and cons of the tool in the table below.
A/D indicator | |
Advantages | Disadvantages |
In addition to prices, it considers trading volumes in its calculations. Thus, the signals are fundamentally reinforced. | It does not work well in Forex since the volumes of the foreign exchange market are unknown. A solution is to use the indicator in trading currency futures. |
It can confirm or deny the ongoing trend. | It does not record price changes between periods. It does not consider gaps. |
It indicates a possible correction. | Due to the similarity of the A/D line to the price chart, it can form implicit signals that are not noticeable at first glance. |
Due to divergences, it generates additional trading opportunities. | With strong trends, divergences may not work. |
It generates early signals. Due to trading volume analysis, you can read the market before the price movement. | It doesn’t work in a sideways trend. The indicator is not suitable for trading flat. |
You can use candlestick patterns in trading that are drawn by the indicator line. | Without supplementary tools, it doesn’t provide a specific entry point but only suggests the direction for trading (buy or sell). |
Visualization: at first glance at the chart, you can understand what the trend is in the market and whether the price is trending at all. | |
The A/D indicator is not a full-fledged trading system, but it can be a good auxiliary tool for choosing the direction for trading in a trend system. It is recommended to support A/D signals with other means of technical analysis. To use the indicator for Forex trading, it is better first to analyze currency futures charts and then transfer the results to the spot chart.
Conclusion
Marc Chaikin has developed a unique market analysis tool. In addition to prices, the indicator analyzes volumes, and volumes are the engine of the market.
Moreover, the indicator is easy to use and definitely worth trying.
If market participants accumulate buy positions, the A/D line will rise. If the period's total volume of sales increases, the indicator line will head down. Due to its simple interpretation, it is enough to look at the indicator chart once to understand in which direction it is profitable to enter trades.
If you master divergence signals, you will be able to understand that the trend is exhausting. In this case, you can trade the market during a correction. Also, upon the correction completion, the indicator usually generates a corresponding signal, which will indicate the continuation of the impulse.
Like any technical analysis tool, the A/D indicator has a number of disadvantages. However, if you clearly understand for what purposes it is used and also employ additional technical analysis tools (other indicators, support and resistance levels, Price Action patterns, and so on), you can create a profitable trading system based on A/D.
Accumulation/Distribution Indicator FAQs
Accumulation in the chart means that large market players have been opening buy positions during a particular period. The more traders buy, the higher the A/D line.
Distribution in the chart means that large market players have been opening sell positions during a particular period. The more traders sell, the lower the A/D line.
Accumulation, as a rule, characterizes strong buying pressure when the price rises and new buyers join. That is, accumulation signals a bullish market. The distribution characterizes a bearish market when the price falls, and new sellers step in.
The accumulation distribution indicator (A/D) was invented by the famous American analyst Marc Chaikin. He spent most of his career developing technical tools for stock market analysis. His most famous inventions are the A/D indicator, Chaikin Money Flow (CMF), and Chaikin Oscillator.
Accumulation is a bullish signal that causes prices to rise. The more market participants accumulate an asset, the less underlying supply of that asset becomes. According to the law of supply and demand, the price rises.
The accumulation distribution indicator and its formula are built into all popular platforms. After adding the indicator to the chart, you will see the Accumulation Distribution line.
The A/D indicator can be classified as a leading indicator. The tool considers the trading volume. When buying or selling volume accumulates, the indicator curve will rise or fall, but the price chart may remain flat. In this case, you should be prepared that the price consolidation will end soon.
The content of this article reflects the author’s opinion and does not necessarily reflect the official position of LiteFinance broker. The material published on this page is provided for informational purposes only and should not be considered as the provision of investment advice for the purposes of Directive 2014/65/EU.
According to copyright law, this article is considered intellectual property, which includes a prohibition on copying and distributing it without consent.