The Coppock Curve is considered a classical technical analysis tool that helps traders find optimal entry and exit points. This indicator was created for the stock market, but over time, it has also become widely applied in currency, commodity, and cryptocurrency trading. The Coppock method hinges on analyzing momentum and the rate of price change, which helps reduce market noise.
Today, the Coppock Curve is commonly used with other technical indicators and candlestick patterns. The indicator is particularly useful for traders focused on stock indices and investor sentiment. In this article, you will learn how the Coppock indicator works.
The article covers the following subjects:
Major Takeaways
- The Coppock Curve is a long-term technical analysis indicator designed to identify trend reversals.
- The Coppock indicator analyzes momentum and the rate of change in quotes, then smooths the data.
- The indicator was originally designed for the stock market, including the S&P 500 stock market index.
- The curve generates a trading signal when it crosses the zero line, which often indicates the start of a sustained price movement.
- The indicator works best on higher time frames and is suitable for investors and position traders.
- When using the Coppock Curve in a trading strategy, it is essential to confirm signals with other indicators.
- The indicator is ineffective in flat markets and is not designed for intraday trading.
What Is Coppock Curve Indicator?
The Coppock Curve indicator is a technical analysis tool designed to identify long-term market reversals and assess changes in market momentum. Unlike most oscillators, the indicator is focused on long-term price movements and is primarily used to analyze major market cycles.
The indicator analyzes the rate of price change, smoothed using a weighted moving average. Such an approach reduces the impact of market noise and focuses on broader market trends. That is why analysts often use the Coppock indicator to analyze the stock market, where investor behavior has a key role.
From a technical standpoint, the Coppock curve is a momentum oscillator. It is similar to indicators such as the momentum indicator, but it is designed for higher time frames. It can be useful for finding the bottom of the market after a prolonged bearish trend, especially when other technical indicators generate mixed signals.
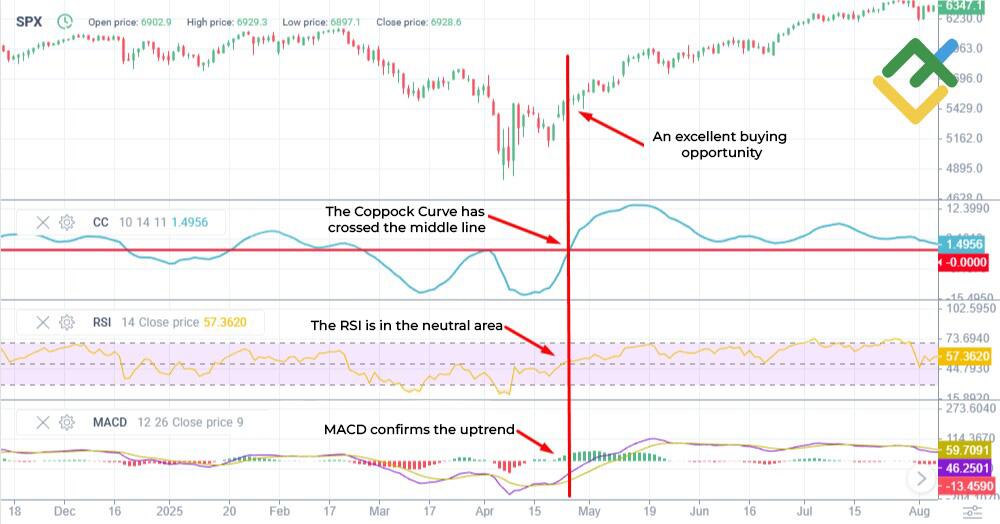
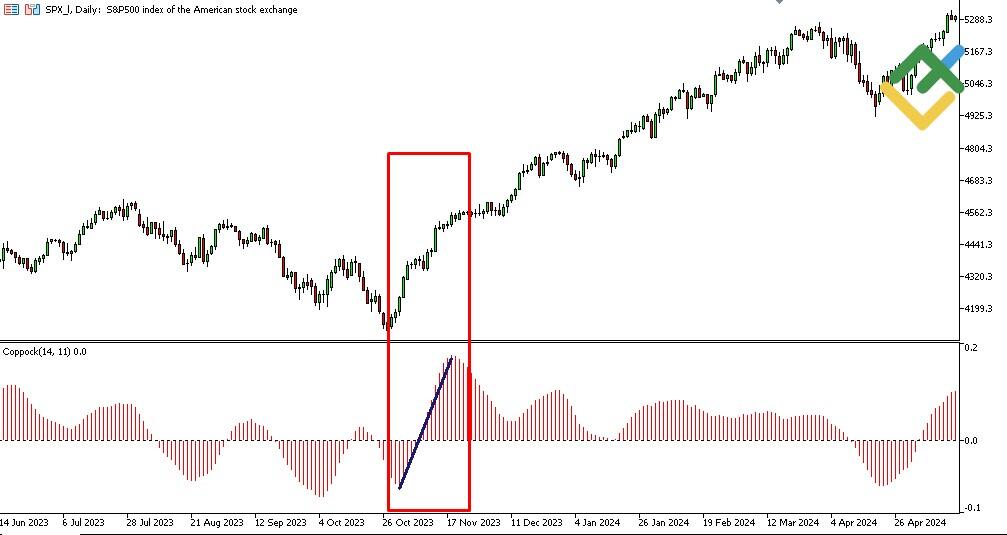
The Coppock Curve represents a line that fluctuates relative to the zero line and reflects changes in market momentum. A bottom-to-top crossing gives a buy signal. As part of a trading strategy using the Coppock Curve, other technical analysis tools are also employed to improve the forecast's accuracy.
History of Edwin Coppock and the Indicator's Creation
Economist and analyst Edwin Coppock created this tool in the 1960s. While researching the stock market, he noticed that investors do not make decisions immediately but wait for some time after a significant drop in asset value.
The idea for the indicator came from an attempt to quantify the psychological factor. Edwin Coppock suggested that market recovery after crises resembles the process of emotional recovery in people after losses.
As time passed, the Coppock indicator found broader application in various markets. Presently, it is employed in cryptocurrency, commodity, and other markets. Traders customize the settings to suit different financial instruments and market conditions, while the fundamental principle remains unchanged: pinpointing long-term reversal points.
Coppock Curve Formula and Calculation
The Coppock Curve is calculated using a combination of two Rate of Change (ROC) indicators followed by Weighted Moving Average (WMA) smoothing. This approach helps gauge market momentum and filter out short-term fluctuations.
The classic indicator formula is as follows:
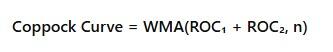
ROC — Rate of Change;
WMA — Weighted Moving Average.
The final value forms a line that moves relative to the zero mark and is used to find trading signals.
Rate of Change Components
The rate of change reflects the movement of an asset's price over a given period. It is calculated using the following formula:
![]()
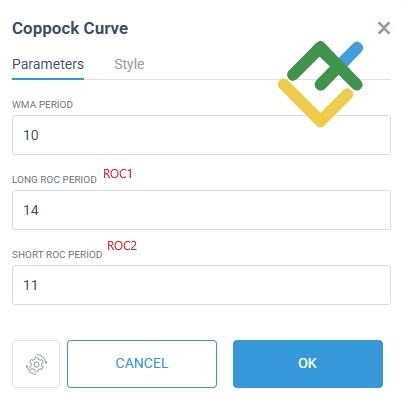
By default, the Coppock curve uses two ROC values calculated for different periods. Typically, these are 14 and 11.
The rates of change reflect the market's momentum. During a prolonged bearish trend, ROC values gradually stabilize, suggesting that selling pressure is easing and the market is about to bottom out. This is precisely what the indicator is designed to show.
Weighted Moving Average Application
After summing the two ROC values, the result is smoothed using a 10-period weighted moving average (WMA). The weighted moving average gives greater weight to the latest data, making the indicator more sensitive to momentum changes without sudden increases in market noise.
The WMA improves signal readability and analysis quality. The Coppock indicator responds to sustained changes in market trends rather than accidental price fluctuations. As a result, it has become an indispensable tool for position traders.
How to Read Coppock Curve Trading Signals
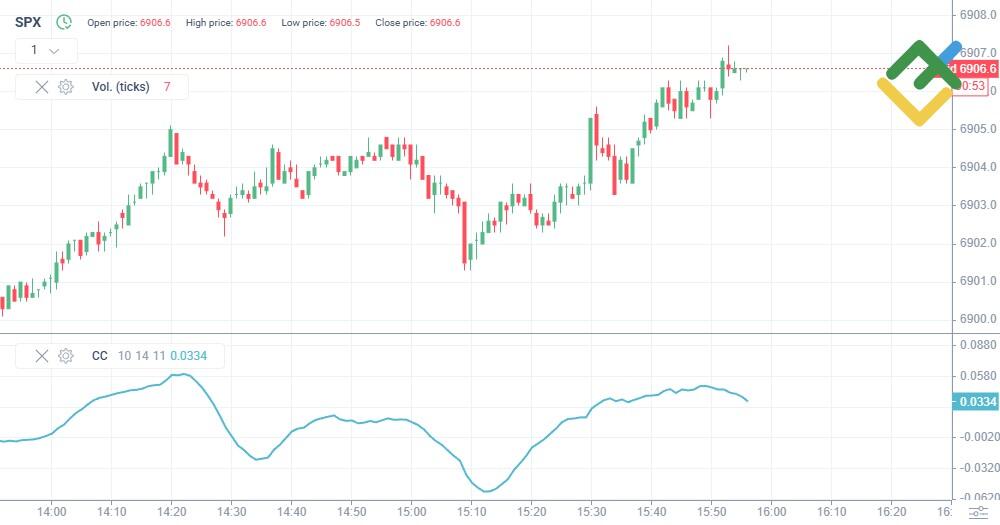
The Coppock curve is plotted in a separate window. Traders monitor the direction of the curve, marking the moments when it crosses the zero level.
The Coppock indicator is not suitable for fast-paced trading. It rarely generates signals, but when used correctly, it can help identify the start of a sustained market uptrend.
To obtain more accurate signals, the Coppock curve is often confirmed by other technical indicators. For example, the MACD indicator helps assess trend direction and momentum strength, while the RSI can be used to find optimal market entry points.
The tool is most effective in the stock market, with indices and assets that exhibit pronounced cyclical movements.
Zero Line Crossover Strategy
The classic trading strategy with this indicator focuses on zero line crossings. After a long decline, the Coppock curve turns upward and crosses the zero level, giving a buy signal. This means that the downtrend has likely ended and a growth phase has begun.
This approach is often used as part of a long-term trading strategy. Importantly, the crossings do not serve as an immediate signal to enter the market, but rather confirm a change in market momentum.
Bullish and Bearish Signal Identification
When the Coppock Curve begins to increase, a buy signal is generated. In this case, the indicator points to reinforced bullish momentum and increased investor demand for the asset. Against this backdrop, traders usually open long positions.
Meanwhile, a bearish signal is less pronounced. It may look like a slowdown in the curve's growth or a reversal to the downside after a long upward movement. However, the Coppock indicator is rarely used to pinpoint the exact moment for selling and is more often employed to confirm that a position should be closed.
Coppock Curve Strategy for Long-Term Trading
The Coppock curve signals long-term buying opportunities and is usually used in long-term trend-following trading strategies. The main goal is to determine the moment when the decline phase ends and steady growth begins. The indicator is especially useful for position trading and long-term investing, as it prioritizes capturing large multi-year trends over high-frequency trading.
The Coppock curve is rarely used as a standalone tool. Its signals are more accurate when combined with comprehensive market analysis, trend lines, and other technical analysis tools. Traders often use the Stochastic Oscillator with the Coppock curve, especially when trading currency pairs.
Entry and Exit Rules
The main rule for entering a long position is to wait for a bullish signal: after a prolonged decline, the Coppock curve should turn upward and cross the zero line.
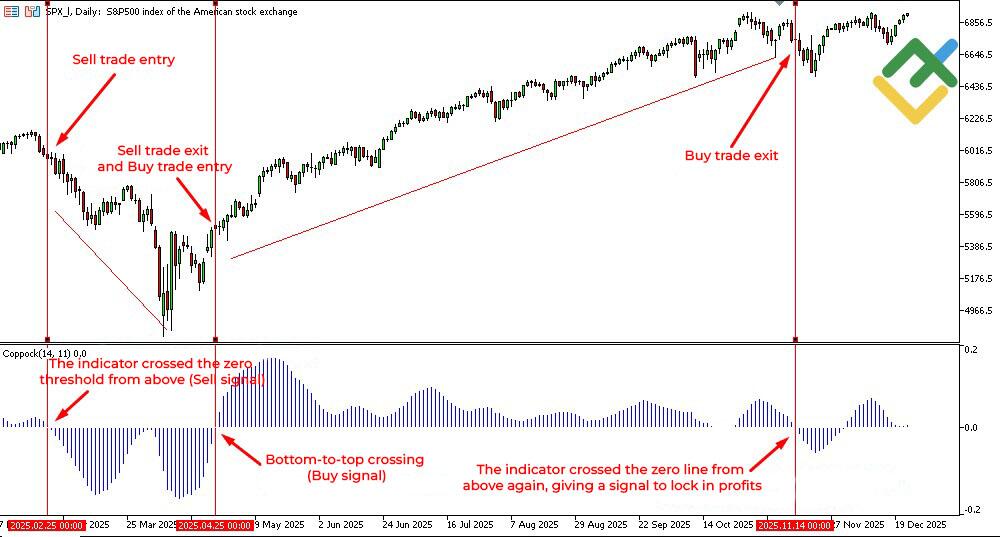
As a rule, a trade is not opened immediately, but only after a confirming candlestick has formed. The Coppock indicator is less commonly applied to exit positions. Traders more often focus on a slowdown in the curve's growth and other technical indicators that point to a weakening trend.
Best Market Conditions for Application
The Coppock curve performs better in markets with pronounced cycles of growth and decline. These include stocks, stock indices, and some commodity assets.
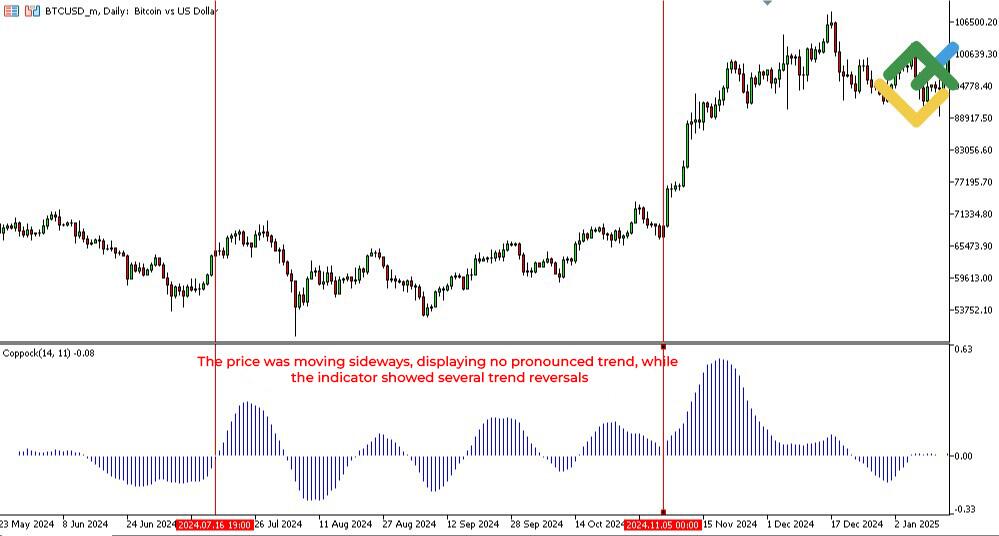
In flat markets, the indicator's accuracy decreases. High volatility without a clear trend leads to delayed or weak signals. Therefore, it is best to use the Coppock indicator when the market has already passed through a phase of sharp decline and is beginning to form a new upward trend.
Timeframe Selection Guidelines
The Coppock curve is usually employed on higher time frames, such as weekly or daily. This approach is consistent with the indicator's original concept and helps filter out market noise. On lower time frames, the signals become less reliable.
The indicator's calculation periods can be tailored to a specific financial instrument, but if you change the settings too drastically, it might affect the accuracy of your predictions. When using the Coppock curve in your trading strategy, you should keep the default indicator values or change them only slightly.
Advantages and Limitations of Coppock Curve
The Coppock curve has several advantages, but it is not flawless. Its drawbacks are important to consider when building your trading strategy.
Advantages:
The indicator helps identify long-term market reversals and determine market bottoms.
It effectively filters out market noise by smoothing data.
It is easy to interpret and does not oversaturate the chart with excessive details.
It is well-suited for analyzing the stock market and stock indices.
It is a valuable tool for position traders.
Disadvantages:
The curve gives lagging signals, so you may miss a significant part of the trend movement.
It performs poorly in flat markets.
It does not generate sell signals and is rarely used for opening sell trades.
It requires confirmation of signals with other technical analysis tools.
The indicator is not designed for short-term trading on lower time frames.
Common Mistakes and Risk Management
One of the most common mistakes is using the Coppock indicator for short-term trading. This tool was originally designed to analyze long-term market cycles, and its signals lose accuracy and lag on shorter timeframes.
Another mistake is using the indicator without considering the market context. The Coppock curve shows momentum changes but does not account for support and resistance levels, market structure, or the overall trend. Without additional analysis, a trader may open a position with the wrong timing.
Many traders also make the mistake of interpreting a line crossover as a signal for immediate entry. In practice, the Coppock curve requires confirmation from auxiliary technical indicators.
Finally, another common mistake is trying to spot divergences between the market price and the indicator values. This method does not work with the Coppock indicator. Instead, it performs better as a tool for finding entry points rather than exit points. Other analytical and risk-management methods should be used to manage positions.
Conclusion
The Coppock curve is a technical analysis tool best suited for assessing long-term market trends and identifying reversals after a prolonged bearish trend. The indicator is based on momentum and the rate of change, filtering out market noise.
The indicator is particularly effective in the stock market, where investor behavior shapes cycles of growth and decline. It can be used as part of your strategy, confirming its signals with other technical indicators. Following this approach, you can increase the accuracy of your forecasts and avoid mistakes.
Coppock Curve FAQs
The Coppock curve does not have a fixed range of values. It fluctuates around the zero line, and its amplitude depends on market volatility and time frame. In practice, it often ranges from approximately -20 to +20.
The Coppock indicator generates signals based on changes in the curve's direction and zero-line crossovers. A signal occurs when momentum reverses after a prolonged market decline, confirming the onset of a growth phase.
The Coppock Curve is most effective in stock markets with clear long-term cycles of ups and downs. It can also be applied to other markets when analyzing and trading assets with stable trends.
The Coppock curve is considered reliable for identifying long-term market bottoms, but it does not provide accurate price levels and tends to lag behind price movements, so it is best used in conjunction with other indicators and trend analysis.
The content of this article reflects the author’s opinion and does not necessarily reflect the official position of LiteFinance broker. The material published on this page is provided for informational purposes only and should not be considered as the provision of investment advice for the purposes of Directive 2014/65/EU.
According to copyright law, this article is considered intellectual property, which includes a prohibition on copying and distributing it without consent.