Levels are one of the most frequently used technical analysis tools. Strong levels allow you to identify potential pivot points and levels to put stop losses. Algorithms of trend and channel indicators are based on the mathematical calculation of key levels, making it possible to earn money on a level breakout and determine the corrective price movement. Having read this article, you will get familiar with the original forex levels indicators and learn how to trade with key levels.
The article covers the following subjects:
Overview of Forex levels indicators
Levels trading is a group of strategies based on the combination of technical analysis with trader psychology. The psychology here means that most traders think to some extent in the same way. They employ the most popular indicators and receive similar trading signals, set stop loss and take profit orders at the same levels (for example, at the local extreme levels), and so on.
The accumulation of stop-loss orders actually forms the critical levels at which the price stops, starts trading flat, or changes the trend direction. Everyone has heard of trading using support and resistance levels, moving averages, Fibonacci levels, and other elements of technical analysis used in financial markets. This article will briefly consider three original indicators that build levels according to a particular algorithm. You will also find links to download indicators for MT4 and MT5.
Price levels indicators and forex trading strategies based on levels
The principle of trading strategies based on price levels suggests you build the levels and estimate their significance:
- The breakout of a weak level means the price movement should continue and reach the next key level.
- The price pivot (rebound) from the strong level means the trend reversal.
It is not reliable to build the levels manually along with the visible extremes, especially when the deviation of 3-5 pips is vital in terms of potential profit/loss.
1. Rabbit and Rabbit TT indicator
The Rabbit indicator has many modifications, the tool has been many times upgraded according to traders’ comments. The Rabbit is the author’s indicator that draws price levels calculated according to the algorithm based on Fibonacci ratios and daily price extremes.
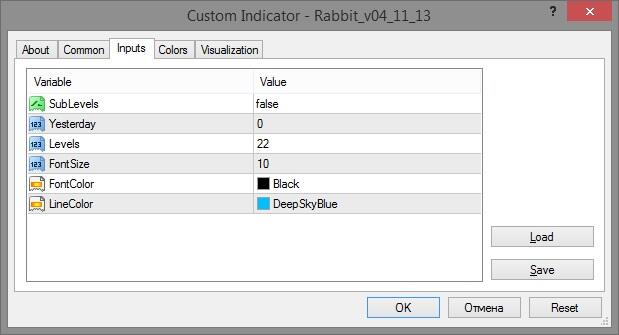
Rabbit settings:
- SubLevels display sub-levels between primary levels. At first acquaintance, it is better to set the value False not to overload the chart with unnecessary lines. Besides, the meaning of these sub-levels is not clear, as well as their purpose.
- Yesterday displays the time shift. The default value "0" shows the levels of the current day, that is, plotted according to the current high/low. If the value is "1", the indicator shows the previous day’s levels, and so on. You can also set the value "-1"; then, the indicator will show the forecast levels for the next day. However, it is not clear according to what parameters the projected levels are constructed. Therefore, the values "0" and "1" are optimal, the rest of the levels will be outdated.
- Levels mean the number of levels. The less is the number of levels, the more they are significant, as they are drawn according to the most recent extreme prices.
The rest of the parameters are auxiliary, including the size and color of the font, the color of the levels.
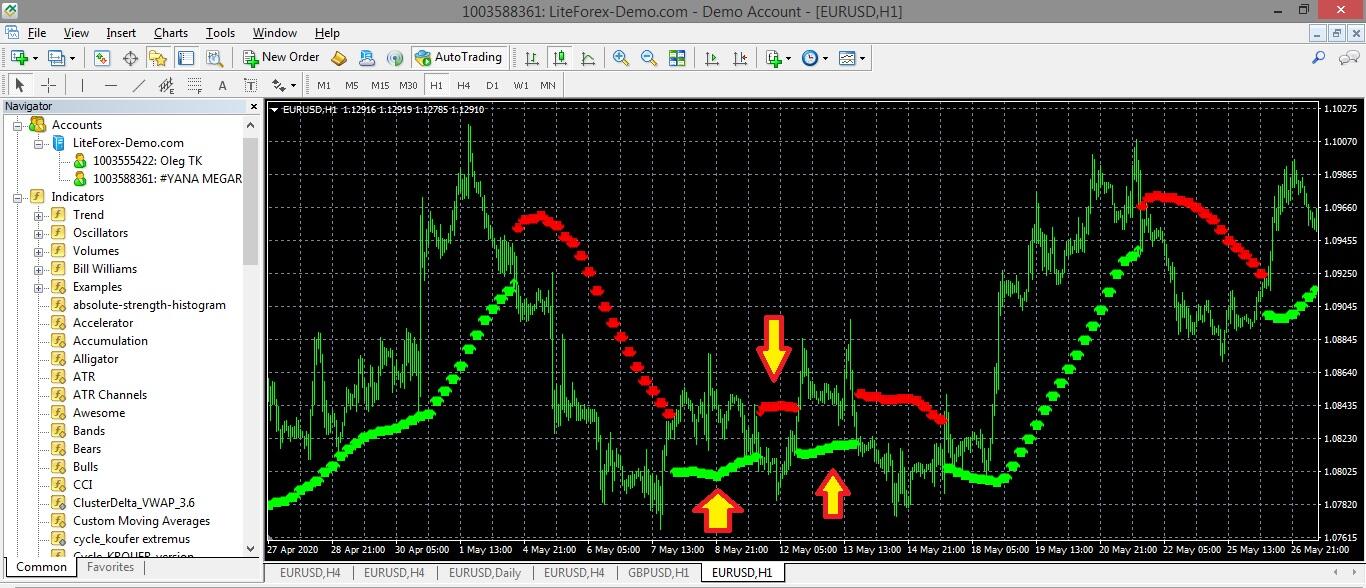
That is how the Rabbit indicator looks like:
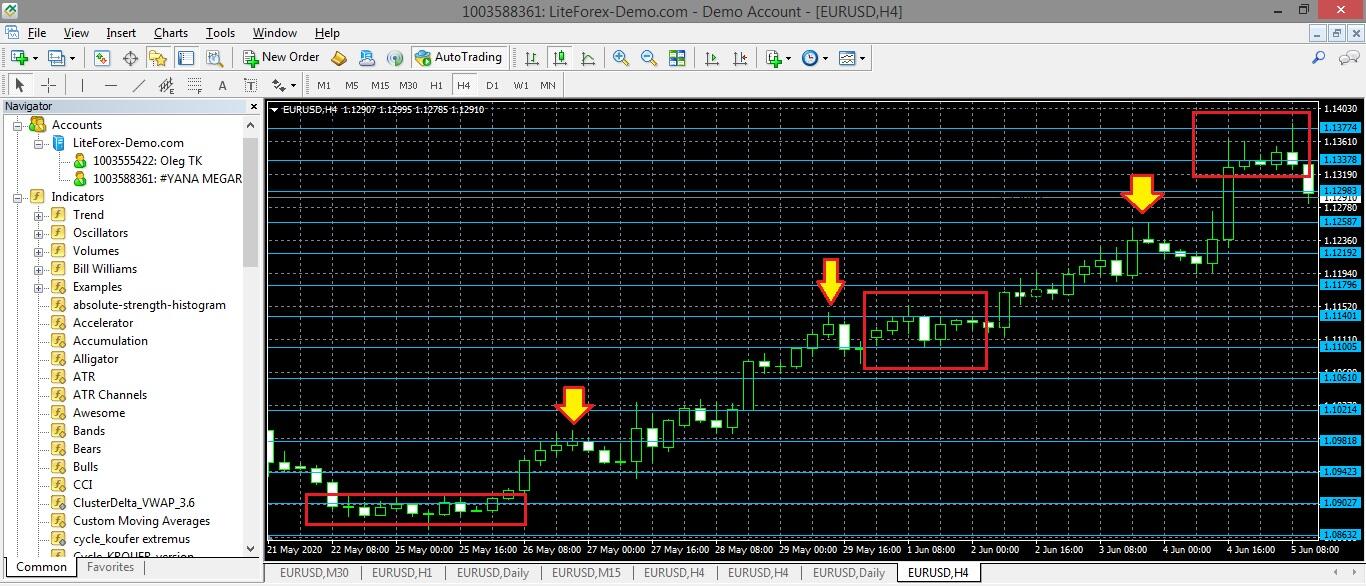
The chart clearly displays flat sections, price swings within narrow ranges limited by indicator levels. There are also clear price rebounds.
Another popular modification is the Rabbit TT indicator. It constructs the Fibo grid in the specified ratio, taking into account the High/Low of the chosen timeframe. You can use the Rabbit TT to trade with the level breakout or price rebound strategies. You can also calculate the stop loss levels and pending orders with the Rabbit TT.

Listed below, there are a few trading strategies with the Rabbit and Rabbit TT indicators:
- The pending order trading strategy is one of the most common. You define the main trend direction and put pending orders so that you will catch the local corrections from key levels, also holding the trades entered in the primary trend direction. The indicator developer, (JonKatana), recommends trading the GBPUSD pair. Early in the morning, it is recommended to put reverse pending orders, buy/sell limit orders. You set buy/sell stop orders (the level breakout strategy) at the more distant levels, with a take profit at the next level, and a stop loss is one level further.
- Level breakout strategy. After the price breaks out the level drawn by the indicator, you need to make a pause. If the price goes back to the level and continues moving in the break-out direction, the level is true. If, following a reversal to the level, the market continues moving in its direction, the breakout is false, and you enter a trade in the reversal direction.
Example. In the first two cases, the price breaks out the level but goes back and moves down. We make sure that the breakout is false and enter short trades below the level. In the third case, the price breaks out the level upside. Next, it goes sideways and continues rising after that, confirming the primary trend direction. We open a long position with a take profit at the next level.
You can download the Rabbit indicator template for the MT4 via this link, for MT5- via this link. The Rabbit TT indicator template can be downloaded here.
How to set up the Rabbit level indicators in MT4 or MT5. You download the template via the offered link. Click on the File/Open Data Folder in the MT4. In the Data Folder, click on the MQL/Indicators and upload the indicator to the directory, and restart the platform. The indicator will be displayed in the Insert/Indicators/Custom tab.
2. Trend Arrows indicator
The Trend Arrows indicator is an interesting combination of trend indicator and mathematical levels. For beginner traders, it could be useful because of its accurate, straight-forward signals:
- It is an arrow indicator. The Trend Arrows shows the trend direction (red or green color in default settings). The candlestick, recommended to enter a trade at, is marked by an arrow. However, it doesn’t mean that you should enter a trade according to the arrow alone. In other modifications,
- The indicator doesn’t repaint. The Trend Arrows indicator paints an arrow only after the current candlestick closes.
- Signals are pretty rare but accurate. You have to wait for a signal in an hourly time frame (H1) for at least 2 or 3 days. So, it makes sense to set up an alert.
The indicator algorithm is based on the key level breakout, which most often means the beginning of a new trend. The indicator code defines the levels according to the analysis of the local price extremes over the period specified in the settings.
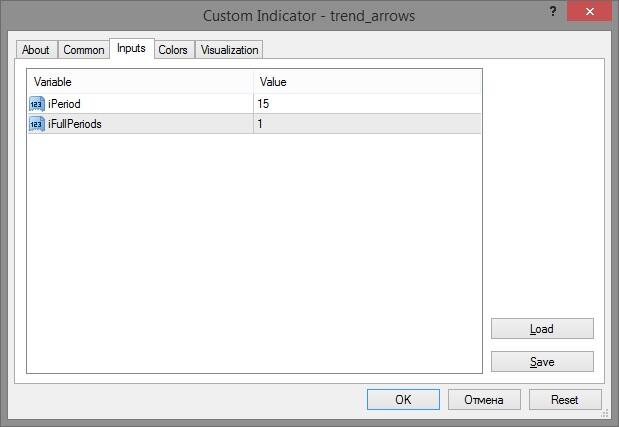
Trend Arrows indicator settings:
- Iperiod is the number of candlesticks taken into account in the analysis. The more candlesticks are analyzed, the less frequent are the signals, and the more accurate they are. It is because more extremes are analyzed for the levels construction.
- Ifull-Period is the averaging of the moving average. It is an additional smoothing filter, the value is set for each pair, based on practical experience.
Depending on the modification, the two major parameters may be called CandlePeriod and ArrowPeriod, but the principle is the same.
You can download the Trend Arrows indicator template for the MT4 here. In this version, you enter trades at the next candlestick after the indicator has changed the color. An aggressive trader could set the target profit of at least 20 pips, insuring the trade with the trailing stop of 20 pips (if there is a possibility of the Internet disconnection, you can use rent a VPS). A stop loss is set at a distance of 30-40 pips, or beyond the local extreme.
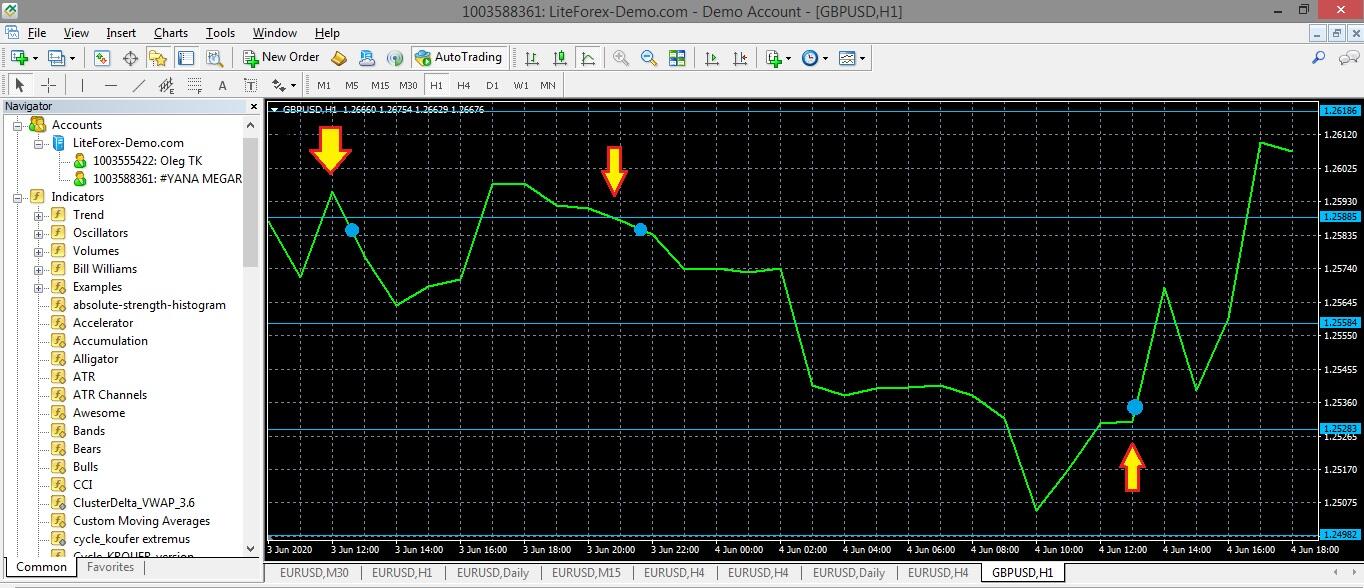
The above screen displays the frequency of signals and their performance. It is also clear why you need to use a trailing stop to exit a trade without waiting until the indicator changes the color. The arrows highlight unstable, volatile sections of the price chart.
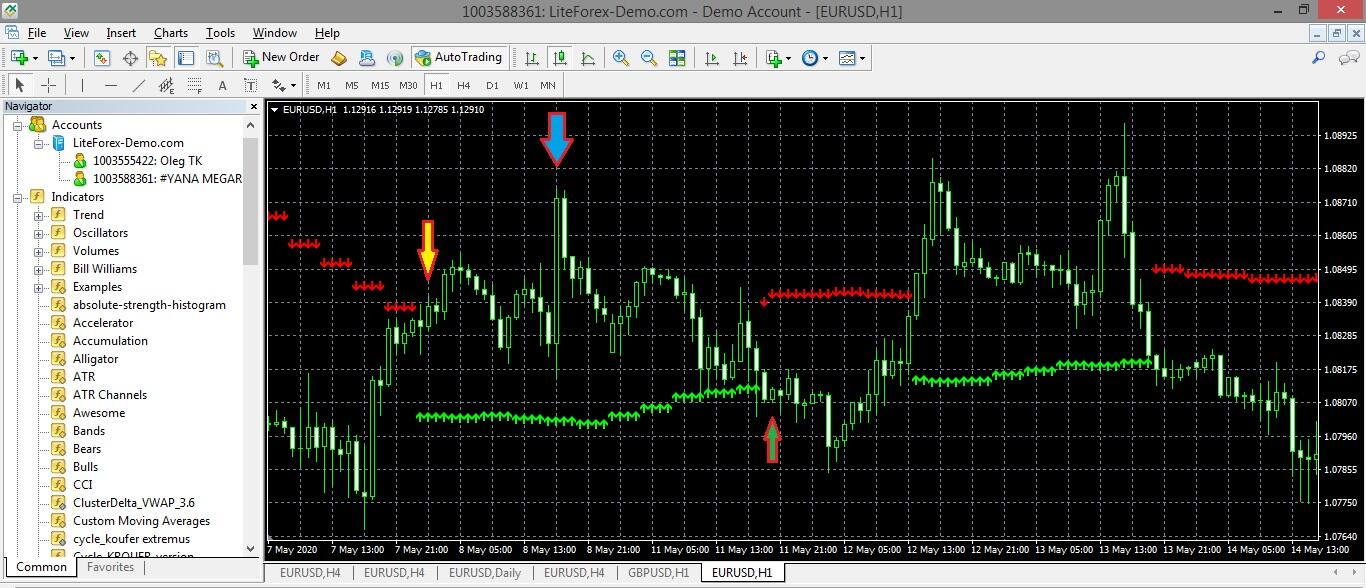
The above figure displays two volatile sections of the price chart scaled up. In the first case, the position is opened at level 1.08314. The highest point of the section (blue arrow) is 1.08756, which corresponds to 44 pips in a four-digit quote. If the trade is hedged with a trailing stop, the profit will be 24 pips. In the second case, the situation is less beneficial. If a short trade is entered at the candlestick marked with the green arrow and exited with a trailing stop, the profit would be only 3.6.
I should note that this screenshot suggests we examine in detail the most difficult situations from the previous one. In other cases, one could have made much more of profit from the trend. However, do not forget about swap costs!
The indicator advantage is that it provides quite accurate signals, the stop loss would not have worked out in any of the described market situations. The disadvantage of the Trend Arrows is that it could be late. However, this is the problem of many technical analysis indicators with a long analyzing period.
3. Indicator London Breakout
The London Breakout trading system is a number of trading strategies, both using indicators and without them. The strategies have a common underlying principle. You trade the GBPUSD at the opening of the London trade session when the pair’s volatility increases, and you could pick up a strong momentum during the first trading hours. The primary London Breakout indicators are based on the mathematical algorithm that constructs so-called boxes, highlighting separate sections of the trend. If the box is of the needed color, you set pending orders and stop losses at the edges of the box. That is a general description of trading with the London Breakout V9.1 indicator. However, it has been difficult to find a working template of the indicator.
Another variant of the London Breakout strategy is based on the ERXGen Filter indicator. You can find the template and description of the indicator on the MetaQuotes website – MQL5. The London Breakout trading strategy without indicators sets a grid of limit orders at an exact time with the target to pick up a strong trend movement up or down.
3 Tier London Breakout is another popular indicator, which can be used to build multiple trading strategies. One of the modifications of the 3 Tier London Breakout can be downloaded here. It looks like this.
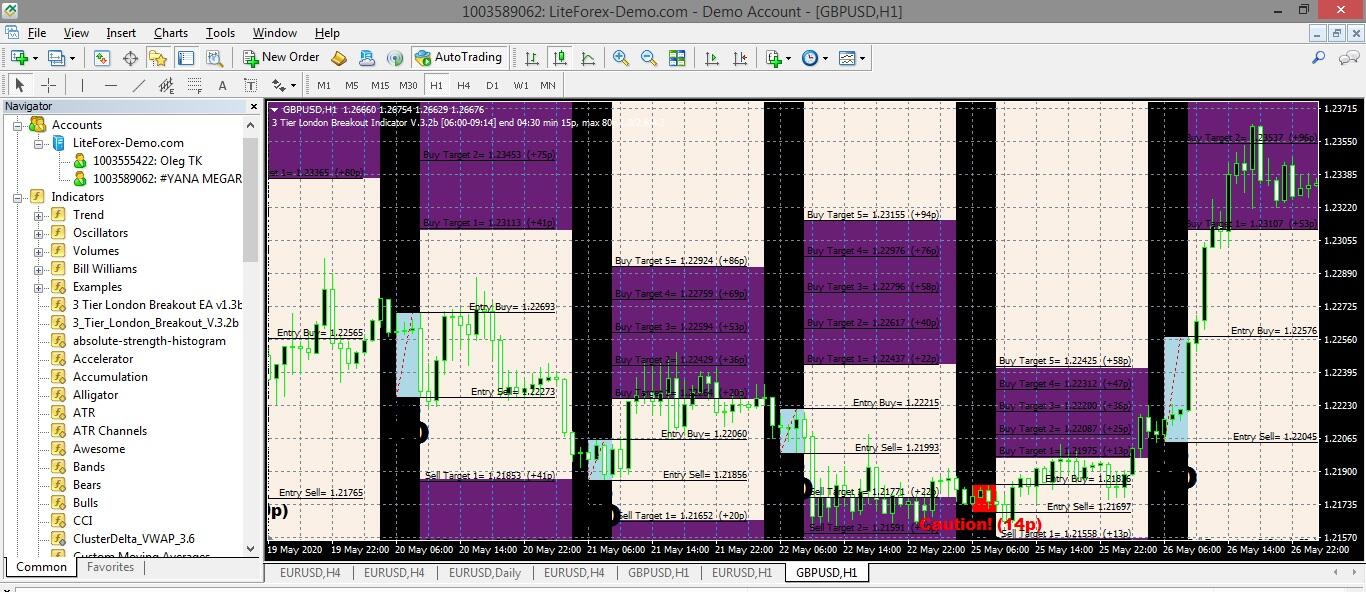
At the first sight, it seems a chaotic set of unknown functions and charts, preventing even from the price study. In fact, it is quite simple, and if you set a good combination of colors of the chart background, candlesticks, and separate zones.
3 Tier London Breakout paints boxes (like in London Breakout the strategy). According to the signals of boxes’ breakouts by the price, the trader makes a decision to buy or sell. The range (box) starts plotting at a fixed time specified in the indicator settings (Start / EndTime). The optimal range of the box is 15-45 pips. As soon as the price breaks the upper border of the box, a long position is opened. When the price breaks out the lower edge – you open a short.
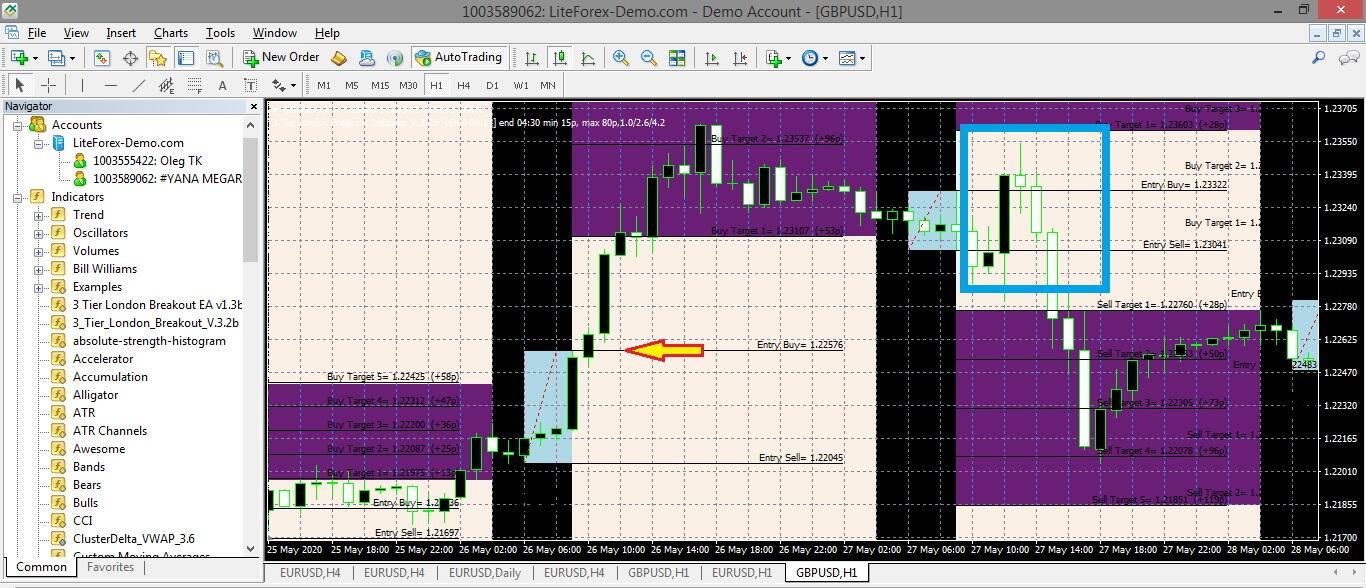
The indicator suggests the level to buy or sell, although the accuracy of the signals sometimes leaves much to be desired. For example, in this screenshot, in the first case, a successful entry point is shown. However, in the second case (blue rectangle) the range of the box turned is too narrow, which provides two false signals, and only the third signal (breakout of the lower border) is true. However, in the case of the first signals, trades would be closed manually when the price reached the opposite edge of the box.
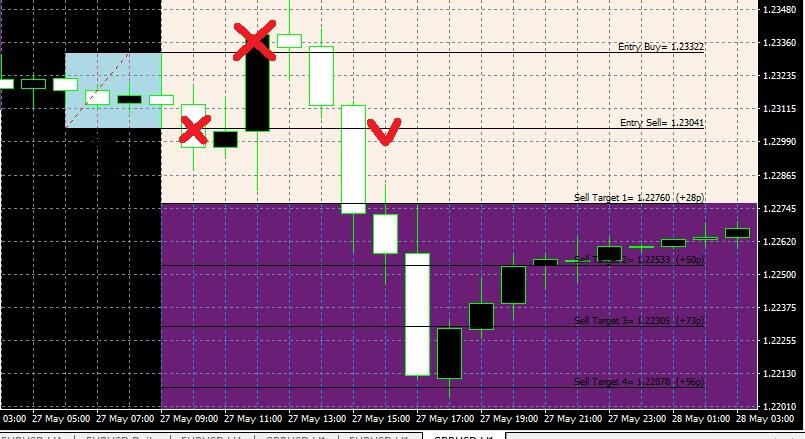
The third trade has fully compensated for the loss yielded by the first two. Buy/Sell Target is the planned take profit level. For example, you can close a part of the position at Sell Target 1 and set a trailing stop for the rest of the position.
Summary
Key takeaways on Forex levels indicators:
- Level indicators can be applied to any currency pair in any timeframe. However, you should choose individual parameters for each particular case.
- The level indicators are additional tools, confirming the target breakout points or the trend reversals. They are used to supplement trend indicators and oscillators. In some cases, you can use the indicators of forex levels as a primary tool, but it is a matter of the individual approach of each trader.
- There are no ideal indicators. You should always test all tools on historical data!
In conclusion, I will add that you can test all the indicators covered in the article on the demo account in the MT4 and MT5 LiteFinance. You do not need any verification to open a LiteFinance demo account, and the registration with the MetaTrader installation will take less than ten minutes. If you have any questions concerning indicators or trading systems, write them in the comments, I will be glad to answer!
P.S. Did you like my article? Share it in social networks: it will be the best "thank you" :)
Useful links:
- I recommend trying to trade with a reliable broker here. The system allows you to trade by yourself or copy successful traders from all across the globe.
- Use my promo code BLOG to get a 50% deposit bonus on the LiteFinance platform. Simply enter this code in the appropriate field when funding your trading account.
- Telegram chat for traders: https://t.me/litefinancebrokerchat. We are sharing the signals and trading experience.
- Telegram channel with high-quality analytics, Forex reviews, training articles, and other useful things for traders https://t.me/litefinance
Price chart of GBPUSD in real time mode

The content of this article reflects the author’s opinion and does not necessarily reflect the official position of LiteFinance broker. The material published on this page is provided for informational purposes only and should not be considered as the provision of investment advice for the purposes of Directive 2014/65/EU.
According to copyright law, this article is considered intellectual property, which includes a prohibition on copying and distributing it without consent.