Nvidia (#NVDA) is one of the leading technology companies specializing in the development of graphics processing units (GPUs), artificial intelligence solutions, and cloud computing. The company's stock has grown rapidly in recent years, driven by the fast-paced development of AI technologies and the increasing demand for high computing power.
In 2026, investors continue to closely monitor NVDA's performance, analyzing fundamental and technical factors. This article will explore expert predictions for Nvidia's stock price in the coming years and examine the key factors influencing its value. We will conduct technical and fundamental analysis to determine whether this asset is promising for long-term investment.
The article covers the following subjects:
- Major Takeaways
- Nvidia Real-Time Market Status
- Nvidia Stock Price Forecast for 2026 Based on Technical Analysis
- Analysts' NVDA Price Projections for 2027
- Analysts' NVDA Price Projections for 2028
- Analysts' NVDA Price Projections for 2029
- Analysts' NVDA Price Projections for 2030
- Analysts' NVDA Price Projections until 2050
- NVDA (Nvidia) Market Sentiment on Social Media
- Nvidia (#NVDA) Price History
- Nvidia Shares Fundamental Analysis
- More Facts About Nvidia
- How We Make Forecasts
- Conclusion: Is Nvidia (#NVDA) a Good Investment?
- Nvidia Stock Price Prediction FAQs
Major Takeaways
- The Nvidia stock price is $226.06 as of 02.06.2026.
- Nvidia reached its all-time high of $236.37 on 14.05.2026. The all-time low of $0.33 was set on 26.04.1999.
- By the end of 2026, Nvidia's stock price may settle at $236.33. However, an increase toward $274.33–$284.00 cannot be ruled out.
- Nvidia faces competition primarily from AMD, Intel, and Qualcomm. To trade effectively, it is wise to keep an eye on their financial performances and the latest news. The wins and losses of these companies can indirectly affect the NVDA stock price.
- Nvidia regularly pays dividends to its shareholders. The company's dividend yield is around 0.02%.
- Institutional investors like Vanguard and BlackRock hold 68% of the shares. Their large-scale buying or selling activity can significantly impact the stock's value.
- Nvidia's market capitalization exceeds $4 trillion, making it one of the largest companies in the world.
- Experts highlight NVDA's strong position in AI, its increasing investments in cloud computing, and the expansion of its product ecosystem as key opportunities.
- Key risks include the company's dependence on demand for AI solutions and data centers, competition from new chip manufacturers, including Chinese state initiatives, as well as export restrictions imposed by the US, and potential geopolitical conflicts.
Nvidia Real-Time Market Status
The Nvidia stock price is $226.06 as of 02.06.2026.
To monitor Nvidia's stock price efficiently, consider the key metrics that inform investors of the company's financial performance and trends.
Metric | Value |
Market capitalization | $5.38 trillion |
24-hour trading volume | 170.55 million shares |
One-year change | 65.53% |
All-time high | $236.37 |
All-time low | $0.33 |
Shares outstanding | 24.22 billion |
Dividend yield | 0.02% |
Nvidia Stock Price Forecast for 2026 Based on Technical Analysis
Let's take a look at the weekly chart to conduct a technical analysis and forecast NVIDIA's stock price for the coming year.
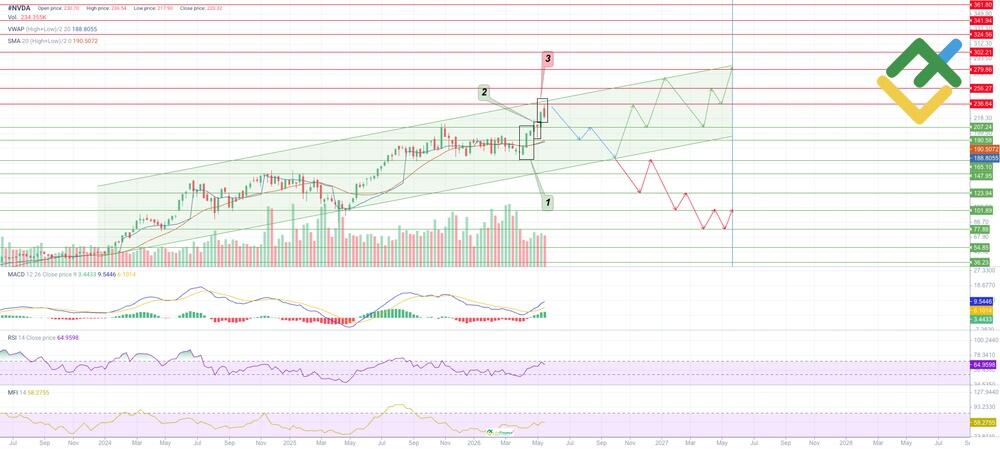
Since early April 2026, Nvidia's stock price has resumed its upward trend, reaching a new all-time high of $236.54. Technical indicators and candlestick patterns are giving mixed signals:
A Three White Soldiers candlestick pattern (1) formed in the range of $165.10–$207.24, after which the price rose to $236.64. A Hammer (2) pattern can also be observed near the $207.24 level; its small body and long wick indicate buying pressure. However, a Bearish Meeting Line (3) pattern has formed near the key resistance level of $236.64, suggesting a possible decline in NVDA prices.
MACD values are gradually rising in the positive zone, and bullish momentum is strengthening.
The RSI has turned downward near the overbought zone and is holding at 64.
The MFI is gradually rising, indicating an inflow of liquidity into the asset.
The VWAP and SMA20 are below the market price, indicating a continuing bullish trend.
The table below shows the 12-month forecast for the NVDA stock price.
Month | Minimum, $ | Average, $ | Maximum, $ |
June 2026 | 211.04 | 224.49 | 237.94 |
July 2026 | 188.53 | 202.29 | 216.05 |
August 2026 | 187.90 | 200.10 | 212.30 |
September 2026 | 169.14 | 186.02 | 202.91 |
October 2026 | 167.87 | 197.62 | 227.37 |
November 2026 | 205.42 | 222.61 | 239.81 |
December 2026 | 204.17 | 232.00 | 259.83 |
January 2027 | 249.20 | 260.14 | 271.09 |
February 2027 | 221.68 | 237.62 | 253.57 |
March 2027 | 207.29 | 220.11 | 232.93 |
April 2027 | 204.17 | 230.12 | 256.07 |
May 2027 | 243.57 | 263.58 | 283.59 |
Long-Term Trading Plan for #NVDA for 2026
The technical analysis helped identify key support and resistance levels that can serve as reference points for trading strategies over the next 12 months.
Yearly Trading Plan
The price is highly likely to correct to the $165.10 level over the next 3–4 months.
Key support levels: $207.24, $190.58, $165.10, $147.95, $123.94, $101.89, $77.88, $54.85, $36.23.
Key resistance levels: $236.64, $256.27, $279.86, $302.21, $324.56, $341.94, $361.80.
Base scenario: Open long positions above the key resistance level of $236.64 or upon a reversal from the $165.10 level on increased volume, with targets in the $256.27–$361.80 range. Implementation period: 12 months.
Alternative scenario: Open short positions below the key support level of $207.24 on increased volume, with short-term targets in the $190.58–$165.10 range. It is also possible to open short trades from the $165.10 level with long-term targets in the $147.95–$36.23 range.
Analysts' NVDA Price Projections for 2026
Analysts are divided on the outlook for NVDA's stock price in 2026. Some expect gradual growth driven by the expansion of the AI sector and the launch of Blackwell Ultra, while others anticipate continued high volatility due to trade restrictions and fluctuating demand.
LongForecast
Price range: $208.00–$307.00.
LongForecast expects NVDA's price to rise moderately. In June, it could reach around $250.00, and by July, it could climb to $282.00. Following a correction in September, the price could hit a high of $307.00 by December.
Month | Open, $ | Min–Max, $ | Close, $ |
June | 236.00 | 208.00–270.00 | 250.00 |
July | 250.00 | 250.00–305.00 | 282.00 |
August | 282.00 | 258.00–302.00 | 280.00 |
September | 280.00 | 239.00–281.00 | 260.00 |
October | 260.00 | 245.00–287.00 | 266.00 |
November | 266.00 | 254.00–298.00 | 276.00 |
December | 276.00 | 261.00–307.00 | 284.00 |
WalletInvestor
Price range: $223.80–$243.67.
According to WalletInvestor, NVDA shares are expected to trade within a relatively narrow range. The average price in June could be $232.94, rising to $234.63 by September. By the end of the year, a moderate increase to $236.33 is expected.
Month | Open, $ | Close, $ | Minimum, $ | Maximum, $ |
June | 232.40 | 232.94 | 223.80 | 241.56 |
July | 232.96 | 233.51 | 226.20 | 240.28 |
August | 233.53 | 234.08 | 226.52 | 241.1 |
September | 234.10 | 234.63 | 228.95 | 239.8 |
October | 234.65 | 235.21 | 226.21 | 243.67 |
November | 235.22 | 235.76 | 230.29 | 240.71 |
December | 235.78 | 236.33 | 228.47 | 243.66 |
CoinCodex
Price range: $181.93–$280.93.
CoinCodex anticipates high volatility in NVDA shares. In the first six months, the average price could drop to $195.65, but a recovery may follow. By December, the NVDA stock could reach a high of $280.93.
Month | Minimum, $ | Average, $ | Maximum, $ |
June | 188.04 | 195.65 | 203.43 |
July | 189.05 | 201.31 | 213.13 |
August | 181.93 | 202.09 | 224.44 |
September | 206.61 | 218.31 | 227.27 |
October | 209.63 | 219.08 | 226.67 |
November | 217.02 | 236.15 | 260.04 |
December | 263.39 | 274.33 | 280.93 |
Analysts' NVDA Price Projections for 2027
Most forecasts for 2027 remain upbeat. Stock prices could be supported by the expansion of AI infrastructure, advances in robotics, and growing demand for graphics processors for data centers. However, some analysts warn of the risks posed by increased competition from AMD and ASIC solutions.
Note: The price ranges reflect the asset's expected volatility throughout the year. Lows and highs may not be shown in the summary tables.
LongForecast
Price range: $282.00–$573.00.
LongForecast suggests that NVDA may see steady growth. In the first quarter, the average price may trade near $331.00, and by the third quarter, it could rise to a high of $531.00. After that, a correction is possible, with prices settling around $471.00 by December.
Quarter | Open, $ | Min–Max, $ | Close, $ |
Q1 | 284.00 | 282.00–357.00 | 331.00 |
Q2 | 331.00 | 331.00–528.00 | 489.00 |
Q3 | 489.00 | 455.00–573.00 | 531.00 |
Q4 | 531.00 | 424.00–531.00 | 471.00 |
WalletInvestor
Price range: $228.49–$251.95.
WalletInvestor forecasts moderate growth for NVDA. In the first quarter, the price may reach $237.99, and by the end of the year, it could rise to a yearly high of $251.95. Volatility is expected to stay relatively low.
Quarter | Open, $ | Close, $ | Minimum, $ | Maximum, $ |
Q1 | 236.35 | 237.99 | 228.87 | 245.49 |
Q2 | 238.01 | 239.67 | 228.49 | 248.09 |
Q3 | 239.69 | 241.37 | 231.68 | 250.54 |
Q4 | 241.39 | 243.06 | 232.52 | 251.95 |
CoinCodex
Price range: $280.28–$617.00.
CoinCodex expects NVDA prices to surge significantly. In the first quarter, the stock may soar to $412.69, and by the third quarter, it could peak at $617. By December, the price is expected to hover around $543.11.
Quarter | Minimum, $ | Average, $ | Maximum, $ |
Q1 | 280.28 | 412.69 | 433.69 |
Q2 | 358.86 | 447.65 | 519.16 |
Q3 | 497.10 | 540.77 | 617.00 |
Q4 | 455.26 | 543.11 | 584.46 |
Analysts' NVDA Price Projections for 2028
The outlook for 2028 is rather mixed. Many analysts expect AI chips to continue to gain widespread adoption. However, they do not rule out a correction due to market oversaturation and a potential slowdown in the global economy.
LongForecast
Price range: $471.00–$720.00.
LongForecast predicts that NVDA's price will likely rise in the first half of the year. By June, the price could reach $614.00, after which a correction is possible. By the end of the year, the price may drop to $574.00.
Quarter | Open, $ | Min–Max, $ | Close, $ |
Q1 | 471.00 | 471.00–642.00 | 594.00 |
Q2 | 594.00 | 534.00–720.00 | 614.00 |
Q3 | 614.00 | 537.00–636.00 | 584.00 |
Q4 | 584.00 | 498.00–620.00 | 574.00 |
WalletInvestor
Price range: $118.43–$240.63.
WalletInvestor offers a more cautious forecast. In the first quarter, the average price could reach $131.46, and by the end of the year, it could jump to $177.03. Volatility is expected to remain elevated.
Quarter | Minimum, $ | Average, $ | Maximum, $ |
Q1 | 126.04 | 131.46 | 240.63 |
Q2 | 118.43 | 142.55 | 161.04 |
Q3 | 135.67 | 179.80 | 198.21 |
Q4 | 167.16 | 177.03 | 197.94 |
CoinCodex
Price range: $428.43–$682.91.
CoinCodex anticipates NVDA prices to decline gradually. By the third quarter, the stock may drop to a yearly low of $428.43. Prices are then expected to recover, with the average price reaching $633.33 by the end of the year.
Quarter | Minimum, $ | Average, $ | Maximum, $ |
Q1 | 557.04 | 648.66 | 676.91 |
Q2 | 534.75 | 593.43 | 682.91 |
Q3 | 428.43 | 496.56 | 643.05 |
Q4 | 444.92 | 633.33 | 655.62 |
Analysts' NVDA Price Projections for 2029
Forecasts for 2029 vary considerably. Optimistic scenarios point to further stock price growth driven by the commercialization of artificial intelligence and advances in autonomous transportation technologies. More conservative projections, however, suggest that share prices could come under pressure due to export restrictions and rising operating costs for data centers.
LongForecast
Price range: $469.00–$963.00.
LongForecast predicts continued growth in NVDA's share price. In the first quarter, the average price could reach $594.00, and by the third quarter, it could climb to a maximum of $963.00. By the end of the year, the price is expected to settle at $711.00.
Quarter | Open, $ | Min–Max, $ | Close, $ |
Q1 | 574.00 | 469.00–642.00 | 594.00 |
Q2 | 594.00 | 547.00–826.00 | 765.00 |
Q3 | 765.00 | 724.00–963.00 | 787.00 |
Q4 | 787.00 | 654.00–885.00 | 711.00 |
WalletInvestor
Price range: $151.97–$232.77.
WalletInvestor offers a mixed outlook for NVDA shares. By the third quarter, stock prices may slide to a low of $151.97. However, the downtrend will likely reverse, and by the end of the year, the average price will likely settle at $180.51.
Quarter | Minimum, $ | Average, $ | Maximum, $ |
Q1 | 171.78 | 194.55 | 215.98 |
Q2 | 154.77 | 159.68 | 229.23 |
Q3 | 151.97 | 203.33 | 210.75 |
Q4 | 175.09 | 180.51 | 232.77 |
CoinCodex
Price range: $650.98–$947.30.
CoinCodex expects NVDA's price to rise steadily. In the first quarter, the average price could reach $814.31, and by the end of the year, it might climb to $851.08. The highest price of $947.30 is expected in the third quarter.
Quarter | Minimum, $ | Average, $ | Maximum, $ |
Q1 | 650.98 | 814.31 | 833.81 |
Q2 | 763.91 | 847.19 | 880.24 |
Q3 | 799.19 | 825.70 | 947.30 |
Q4 | 796.27 | 851.08 | 876.03 |
Analysts' NVDA Price Projections for 2030
The outlook for 2030 is largely bullish. NVDA could be supported by the expansion of AI infrastructure and the adoption of novel technologies. However, antitrust policies and competitors could limit the stock's growth.
WalletInvestor
Price range: $177.47–$357.44.
WalletInvestor expects NVDA's share price to rise gradually. In the first quarter, the average price could reach $218.61, and by the end of the year, it could climb to $335.14. The yearly high of $357.44 is expected in the third quarter.
Quarter | Minimum, $ | Average, $ | Maximum, $ |
Q1 | 177.47 | 218.61 | 236.52 |
Q2 | 211.22 | 265.09 | 275.16 |
Q3 | 262.17 | 326.77 | 357.44 |
Q4 | 254.24 | 335.14 | 352.87 |
CoinCodex
Price range: $762.12–$1,092.63.
CoinCodex predicts an upward trend. High volatility is expected at the beginning of the year. However, in the second quarter, the average price could reach $1,040.90, and by December, it could hit a high of $1,079.10.
Quarter | Minimum, $ | Average, $ | Maximum, $ |
Q1 | 762.12 | 822.32 | 905.50 |
Q2 | 905.54 | 1,040.90 | 1,066.85 |
Q3 | 1,028.01 | 1,051.46 | 1,057.08 |
Q4 | 1,043.84 | 1,079.10 | 1,092.63 |
Gov Capital
Price range: $1,151.10–$2,715.23.
Gov Capital offers the most optimistic forecast. In the first quarter, the average price could reach $1,358.78, and by the end of the year, it could rise to $2,715.23. High volatility is expected.
Quarter | Least price possible, $ | Average, $ | Best price possible, $ |
Q1 | 1,162.23 | 1,358.78 | 1,524.53 |
Q2 | 1,151.10 | 1,706.20 | 1,876.82 |
Q3 | 1,541.34 | 2,168.42 | 2,385.26 |
Q4 | 1,980.49 | 2,468.39 | 2,715.23 |
Analysts' NVDA Price Projections until 2050
The long-term outlook for NVIDIA stock is extremely difficult to predict. The stock price could be driven by developments in AI, changes in the global semiconductor industry, intense competition, and geopolitical factors.
CoinPriceForecast anticipates moderate growth. According to analysts, the price may reach $748.00 by 2035 and rise to $826.00 by 2037.
StockScan is more optimistic. By 2040, the stock price could exceed $37,489.98, and by 2050, it could rise to $45,762.65.
Year | CoinPriceForecast, $ | StockScan, $ |
2035 | 748.00 | 28,690.77 |
2040 | - | 37,489.98 |
2045 | - | 43,128.34 |
2050 | - | 45,762.65 |
NVDA (Nvidia) Market Sentiment on Social Media
Media sentiment surrounding NVDA could influence the stock's short-term performance. Positive coverage—such as high demand for AI chips or the opening of new data centers—could boost the company's share price. Negative sentiment, on the other hand, could lead to significant volatility and corrections.
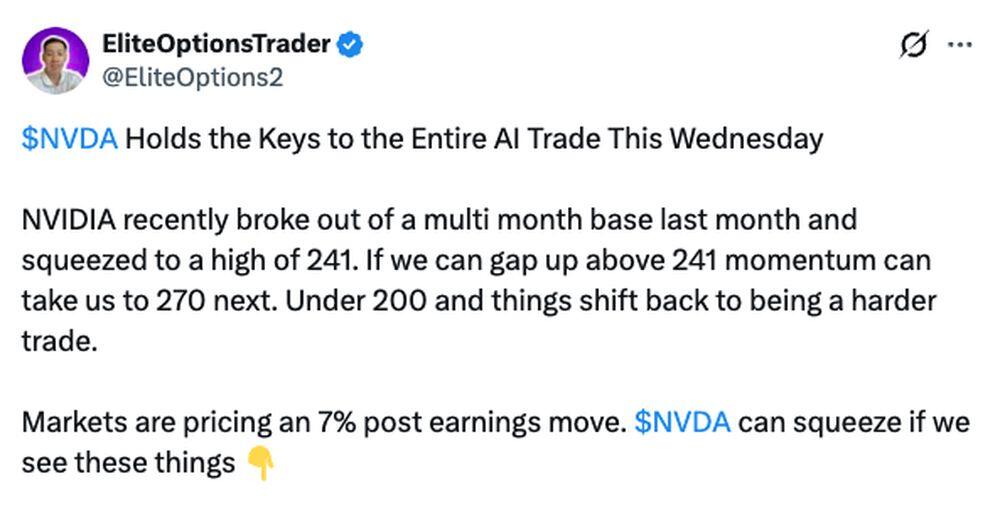
@EliteOptions2 predicts that NVIDIA will rise to $270 if the price holds above $241 in the near future.
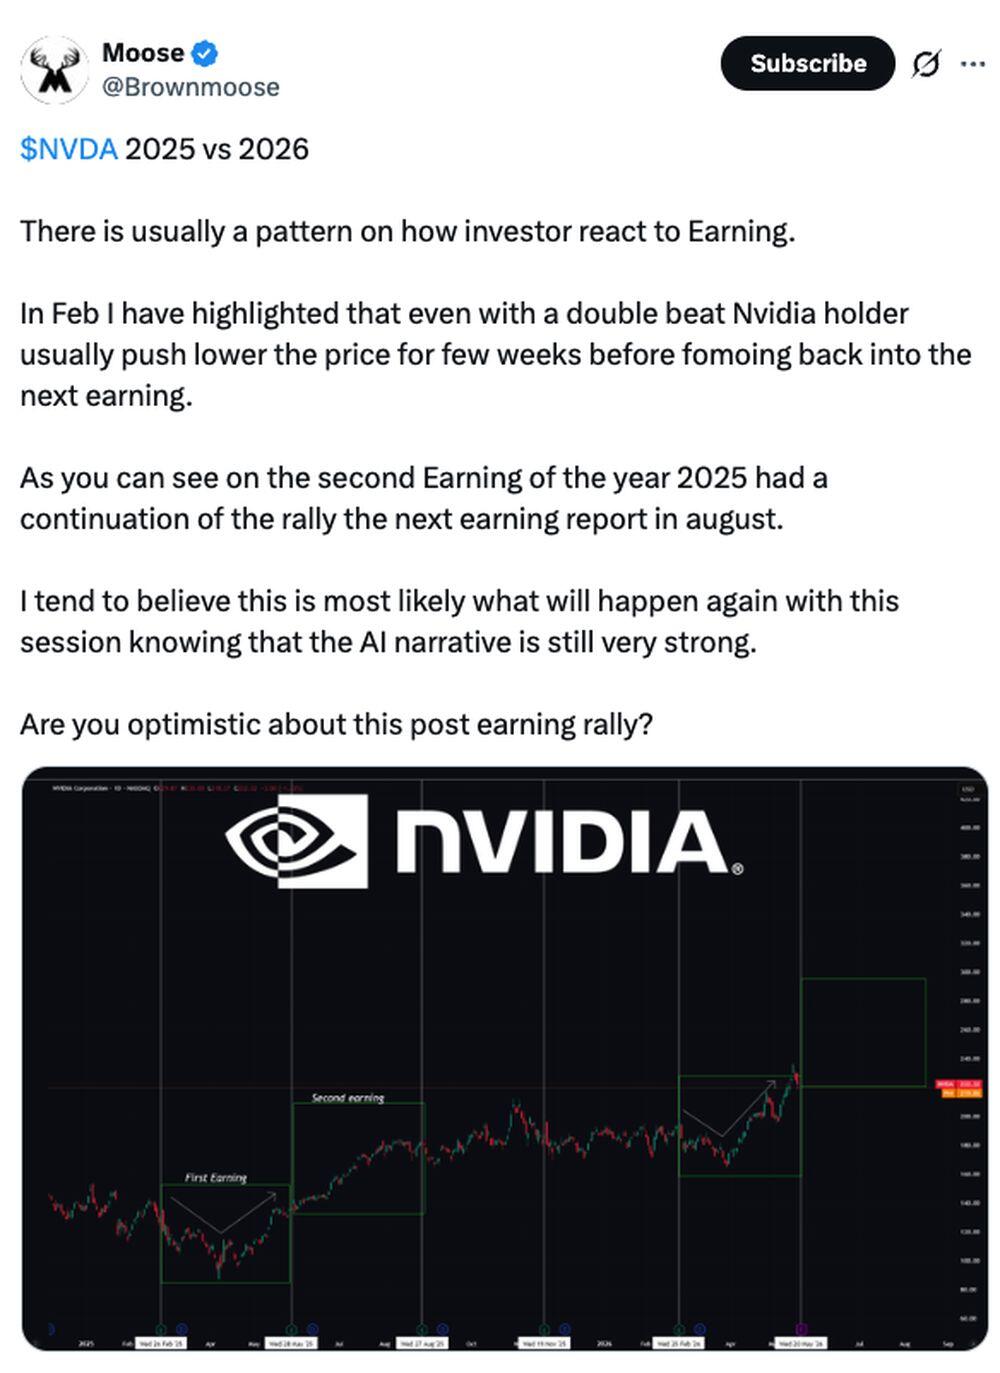
Independent analyst @Brownmoose believes Nvidia's stock price will rise to the $240.00–$300.00 range in the medium term.
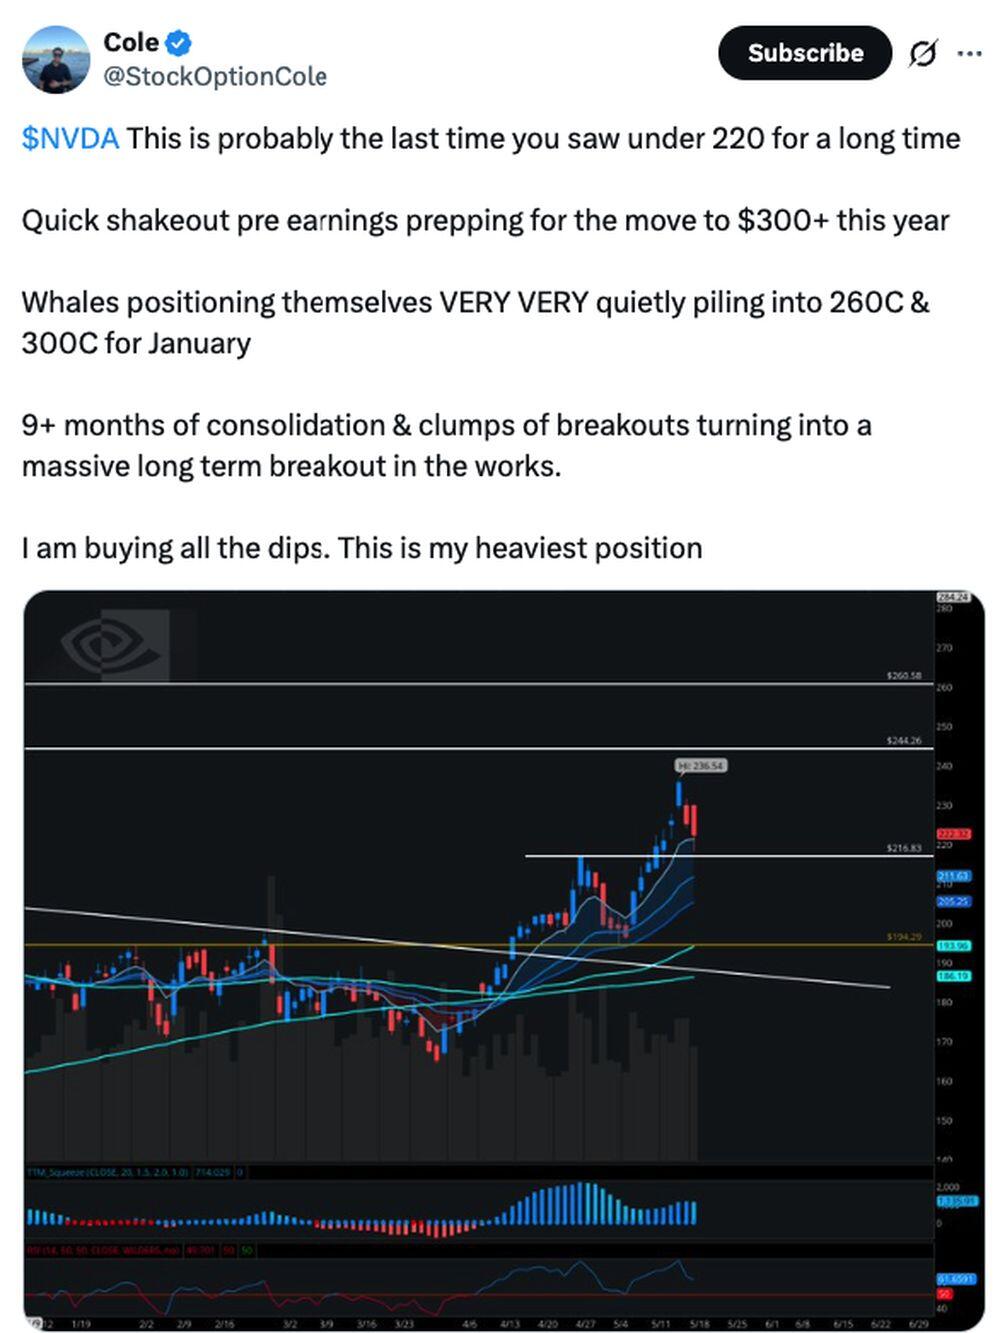
Trader @StockOptionCole also forecasts that Nvidia's stock price will rise to $300.00 and higher in 2026.
Most investors and traders view Nvidia's stock outlook positively. Prices are expected to rise; however, before making trading or investment decisions, it is necessary to conduct technical and fundamental analysis and review current expert analysis.
Nvidia (#NVDA) Price History
The highest Nvidia (NVDA) price was recorded on 14.05.2026 at 236.37 USD. The lowest Nvidia (NVDA) price was recorded on 26.04.1999, when the stock declined to 0.33 USD.
Below is the chart of NVDA covering the past 10 years. To make our forecasts as accurate as possible, it's important to analyze historical data.
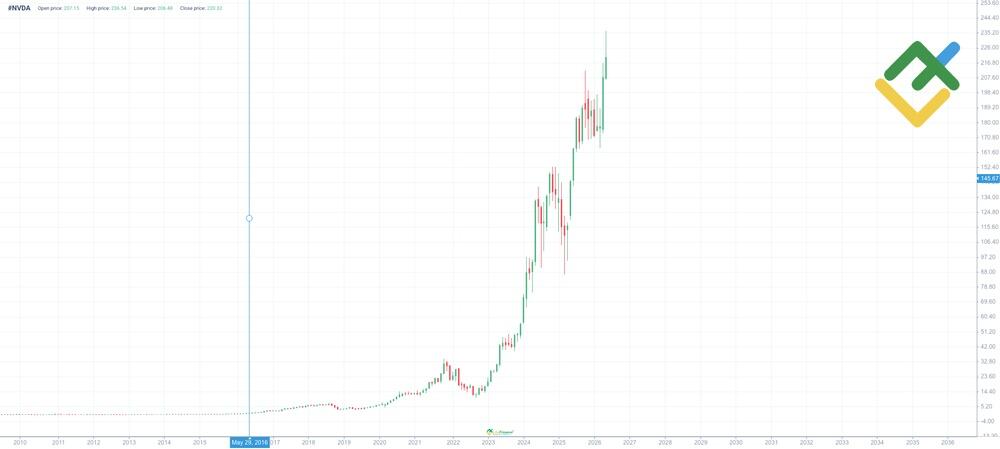
- 1999–2015: After the IPO, the company entered a long consolidation phase. During this period, Nvidia established itself in the discrete GPU market.
- 2016–2018: NVDA's stock price rose sharply amid the growth of the gaming, AI, and crypto-mining industries. The company also expanded its GeForce/CUDA ecosystem.
- 2020–2021: A bullish rally driven by increasing demand for data centers, cloud technologies, and high-performance computing (HPC).
- 2022: A correction triggered by tighter monetary policy and weaker demand for Nvidia's products.
- 2023: The AI boom boosted demand for A100 and H100 accelerators. The company also expanded its data center infrastructure.
- June 10, 2024: A 10-for-1 stock split increased NVDA's accessibility, followed by price consolidation and a rise in market capitalization.
- 2025: Nvidia's share price experienced high volatility. The price opened the year at $135.80 and hit a high of $212.15 in October. After that, a downward correction started, and the NVDA stock price reached $187.78 by year-end.
- Early 2026: The stock price stood at $188.30. Through the end of March, the stock traded within a range of $164.28 to $197.62. Starting in early April, the price began to rise again, reaching a new all-time high of $236.54. The growth was driven by a contract with Amazon to supply approximately one million chips and a contract with the US Department of Defense to use Nvidia's AI technology for various government needs.
Nvidia Shares Fundamental Analysis
The fundamental analysis of Nvidia (NVDA) stock considers a wide range of factors that determine its market value. The company leads the GPU segment, advancing in artificial intelligence, data centers, and next-generation automotive technology. Revenue growth, innovation, and global demand for products make NVDA one of the key tech companies. However, the influence of competition, macroeconomic factors, and market expectations can lead to high stock volatility.
What Factors Affect the Nvidia price?
The price of Nvidia's stock is determined by various fundamental factors, including the company's internal metrics and external market conditions.
- Financial Performance: Revenue growth, net profit, margins, and free cash flow. High revenue growth drives stock price increases.
- Artificial Intelligence Development: The demand for graphics processors (GPUs) for machine learning and cloud computing strengthens the company's position.
- Competition: Rivalry with Intel, AMD, and Chinese chip makers affects Nvidia's market share.
- Macroeconomic Conditions: Inflation, interest rates, and the stock market situation influence capital inflows.
- Government Regulation: Export restrictions, sanctions, and antitrust measures can limit growth opportunities.
- Gaming Industry: Nvidia's share in the gaming graphics card market remains a key growth factor.
- Data Centers: Companies working with cloud computing are major clients of Nvidia.
- Innovation: New GPU architectures, reduced power consumption, and improved performance.
- Mergers and Acquisitions: Strategic deals expanding Nvidia's business can influence its stock price.
- Investor Expectations: Market sentiment, analyst recommendations, and earnings forecasts shape stock price movements.
More Facts About Nvidia
Nvidia Corporation is one of the largest technology companies in the world, specializing in the development of graphics processing units (GPUs) and artificial intelligence solutions. It was founded in 1993 by Jensen Huang, Chris Malachowsky, and Curtis Priem, with its headquarters in Santa Clara, California.
Initially, Nvidia focused on developing graphics cards for the gaming industry, launching the GeForce series in 1999, which quickly became the standard for gamers. Over time, the company expanded its influence into professional visualization, scientific computing, data centers, and automotive technology.
Today, Nvidia's main focus areas include artificial intelligence, cloud computing, autonomous vehicles, robotics, and supercomputing. The H100 and A100 series graphic accelerators dominate the machine learning and big data processing sectors. Nvidia is also actively developing its Omniverse platform for creating digital twins.
The company remains a leader in high-performance computing, strengthening its position in autonomous systems, 5G, and quantum computing, ensuring long-term business growth.
Advantages and Disadvantages of Investing in Nvidia
Nvidia (#NVDA) attracts many investors due to its high growth rates, dominant position in the GPU market, and cutting-edge technologies in artificial intelligence. However, despite its strengths, the company's stock is highly volatile and depends on global economic trends.
Advantages
- Industry Leadership: Nvidia holds a dominant position in the GPU and AI computing solutions market.
- High Demand for Products: The growth of cloud computing, gaming, data centers, and machine learning supports strong demand for Nvidia products.
- Innovation and Development: The company actively invests in new technologies, including quantum computing and digital twins.
- Financial Stability: Nvidia has stable revenue, high profitability, and strong cash flow.
- Presence Across Multiple Sectors: Nvidia operates in gaming, automotive, healthcare, robotics, and defense technologies.
- Capitalization Growth: Nvidia ranks among the top 5 largest companies in the world, with its stock price consistently rising.
- Long-Term Prospects: The development of artificial intelligence and high-performance computing opens up new markets.
Disadvantages
- High Volatility: Nvidia's stock is subject to significant fluctuations, especially during market downturns.
- Competition: Companies like Intel, AMD, Qualcomm, and others are actively developing their own GPU and AI solutions.
- Dependence on China: A significant portion of Nvidia's sales comes from the Chinese market, which carries geopolitical risks.
- Technical Limitations: The complexity of manufacturing and the long development cycle of new processors pose challenges.
- Regulatory Risk: Potential antitrust regulations could hinder growth.
- Vulnerability to a Downturn in the Gaming Industry: Gaming remains an important part of Nvidia's business.
Nvidia remains a key player in the tech sector and a leader in high-performance computing. It offers promising investment opportunities, but potential investors should consider market risks, competition, and the possibility of overvalued stocks before investing.
How We Make Forecasts
Forecasting Nvidia's stock price (NVDA) is based on a comprehensive analysis of three key timeframes: short-term, medium-term, and long-term. We use a combination of fundamental, technical, and sentiment analysis while also considering macroeconomic and geopolitical factors.
Short-Term Forecast (up to 6 months)
- Technical Analysis: Support and resistance levels, RSI, MACD, and Bollinger Bands indicators.
- Market Sentiment: Investor sentiment, social media analysis, and earnings reports.
- Volatility: Response to macroeconomic events and news in the semiconductor market.
Medium-Term Forecast (6 months – 3 years)
- Fundamentals: Revenue growth, earnings growth, market capitalization, and P/E ratio.
- Industry Development: Increased demand for AI, cloud computing, and supercomputers.
- Competitor Dynamics: Analysis of Intel's, AMD's, and Qualcomm's strategies.
Long-Term Forecast (3 years and beyond)
- Company Strategy: Investments in R&D, new technologies, and partnerships.
- Global Trends: Advancements in quantum computing, 6G, and autonomous vehicles.
- Financial Stability: Debt load, cash flow, and growth prospects.
This comprehensive analysis method allows us to provide the most accurate forecasts for investors.
Conclusion: Is Nvidia (#NVDA) a Good Investment?
Nvidia is definitely a leader in AI tech and graphics processors. Its products are in high demand across different industries, from game development to data centers. However, investing in NVDA is risky because of strong volatility.
If you are risk-tolerant and prefer long-term investments, NVDA can bring significant returns. However, it is essential to closely monitor the macroeconomic situation and industry trends. Remember, past performance does not guarantee future results.
Nvidia Stock Price Prediction FAQs
The current price of Nvidia shares as of 02.06.2026 is $226.06.
The decision to sell, buy, or hold NVDA shares depends on your investment goals and risk tolerance. Given the current market conditions and the company's long-term prospects, it may be worth buying the stock. A long-term bullish trend is expected.
Most analysts expect NVDA's price to rise to $275.83 within 12 months, reflecting optimism about the company's long-term prospects. These forecasts take into account the current market conditions, and they may change at any time.
Yes, most experts predict steady growth. Nvidia remains a dominant force in the AI and chip industries, maintaining high investment appeal and positive share price momentum.
The outlook for Nvidia stock in 2026 is bullish, though volatility may increase. Analysts expect continued growth due to strong demand for the company's AI and data center solutions. The stock price could rise to between $274.33 and $284.00 by year-end.
According to various estimates, Nvidia's stock could rise to between $1,079.10 and $2,468.39 over the next five years. Key factors will include advancements in AI technology, the expansion of sales markets, and the competitive landscape. Nvidia's successful diversification could also positively impact its stock price.
According to optimistic forecasts, Nvidia's stock price could rise to $1,079.10 or higher by 2030. Some experts anticipate significant growth toward $2,468.39. However, high volatility is expected due to intense competition in the sector.
Nvidia continues to be at the forefront of the AI and chip industries. Long-term projections for the next 5–10 years suggest that the stock may multiply several times. The company remains one of the most resilient and promising players in the tech sector, offering substantial potential for ongoing growth.
Price chart of NVDA in real time mode
The content of this article reflects the author’s opinion and does not necessarily reflect the official position of LiteFinance broker. The material published on this page is provided for informational purposes only and should not be considered as the provision of investment advice for the purposes of Directive 2014/65/EU.
According to copyright law, this article is considered intellectual property, which includes a prohibition on copying and distributing it without consent.