The S&P 500 Index has long been regarded as a reliable barometer of US economic health, and its forecasting is a critical component of strategic decision-making for institutional and retail investors. The index is influenced by a myriad of evolving factors, including the introduction of new technologies, shifts in global trade relations, and the advancement of world economies.
Given the volatility of financial markets, predicting the S&P 500 index's performance for 2026, 2027, 2028, and beyond necessitates a comprehensive analysis of numerous factors, ranging from macroeconomic data to corporate reports. This review analyzes key trends and factors that shape the SPX's trajectory, providing investors with data-driven forecasts.
The article covers the following subjects:
- Major Takeaways
- S&P 500 Real-Time Market Status
- S&P 500 Price Forecast for 2026 Based on Technical Analysis
- Analysts' S&P 500 Price Projections for 2027
- Analysts' S&P 500 Price Projections for 2028
- Analysts' S&P 500 Price Projections for 2029
- Analysts' S&P 500 Price Projections for 2030
- Analysts' S&P 500 Price Projections until 2050
- S&P 500 (SPX) Market Sentiment on Social Media
- S&P 500 Price History
- S&P 500 Index Fundamental Analysis
- More Facts About S&P 500
- How We Make Forecasts
- Conclusion: Is the S&P 500 a Good Investment?
- S&P 500 Price Prediction FAQs
Major Takeaways
- The current price of the S&P 500 index is $7 489.7 as of 19.06.2026.
- The S&P 500 price reached its all-time high of $7616.2 on 02.06.2026. The index's all-time low of $336.91 was recorded on 04.06.1982.
- The 500 largest publicly traded US companies included in the S&P 500 account for around 80% of the total capitalization of the US stock market, providing broad sector exposure and diversification.
- Since 1970, the index has delivered an average annual total return of approximately 11.2% (with dividends reinvested), making it a benchmark for long-term portfolio strategies.
- The S&P 500 composition is reviewed quarterly, and the index is weighted by market capitalization.
- The index is mainly made up of companies in IT (about 30%), healthcare (about 13%), finance (around 13%), consumer goods (about 11%), and other sectors.
- The largest ETF, SPY, has an expense ratio of 0.09%, while the ES futures contract on the CME provides nearly 24-hour liquidity for trading and hedging.
- Over the past 40 years, the average intra-year drawdown has been about 14%; the largest annual decline was 37% (in 2008), and the biggest single-day drop was 20.5% (in 1987).
- By the end of 2026, the SPX price is expected to range between $6,105.85 and $8,328. The uptrend is anticipated to continue.
- High volatility is expected to persist in 2027. According to forecasts, the index will trade between $6,078.69 and $18,313. Some experts predict rapid growth.
- The outlook for 2028 is mixed. Analysts expect the SPX to trade between $7,070.89 and $12,472. Periods of correction are possible.
- Most experts forecast continued gains for the SPX in 2029. The index is expected to trade within a range of $7,266.40–$13,088.
- Forecasts for 2030 vary widely. The SPX index is projected to trade between $9,559.16 and $29,313. Most analysts expect the bullish trend to continue.
- Long-term forecasts suggest that the S&P 500 index will keep growing. According to various estimates, the index may reach $12,649 by 2033, $13,839 by 2035, $38,115 by 2040, and $98,820 by 2050.
S&P 500 Real-Time Market Status
The S&P 500 Index is trading at $7 489.7 as of 19.06.2026.
It is imperative for investors to monitor the following key metrics of the S&P 500 Index to ensure profitable investing:
- Market capitalization is a measure of the total value of the stocks that make up the index.
- EPS is a measure of the total earnings per share of the S&P 500 Index, a metric provided by Standard & Poor's that indicates the total earnings per share (EPS) of the largest US companies within the S&P 500 index.
- The P/E ratio is the price-to-earnings ratio of the companies included in the S&P 500 index.
- The S&P 500 Shiller CAPE ratio, also known as the cyclically adjusted price-to-earnings ratio, measures the current price of the S&P 500 relative to the 10-year inflation-adjusted average earnings.
- The S&P 500 Dividend Yield is calculated by dividing the dividends per share of the S&P 500 over the past 12 months by the closing price of the S&P 500 for the month, and it reflects the dividend yield for the S&P 500 index only.
- The VIX Index, also known as the Volatility Index, measures the implied expected volatility of the US stock market.
Metric | Value |
Market capitalization | $67.56 trillion |
EPS | $233 |
P/E ratio (q/q) | 31.83 |
Shiller CAPE ratio | 41.02 |
S&P 500 Dividend Yield (m/m) | 1.15% |
VIX | 18.04 |
S&P 500 Price Forecast for 2026 Based on Technical Analysis
The S&P 500 index continues to climb. Following the spring correction, the uptrend has resumed.
The index is trading above SMA50 and SMA200. In recent weeks, the price has approached a key support level, where traders began taking profits.
Following a strong rally, the MACD has entered a corrective phase, while the RSI has retreated to neutral territory, indicating that overbought conditions have eased. As long as the price trades above $7,000–$7,200, the long-term trend remains bullish.
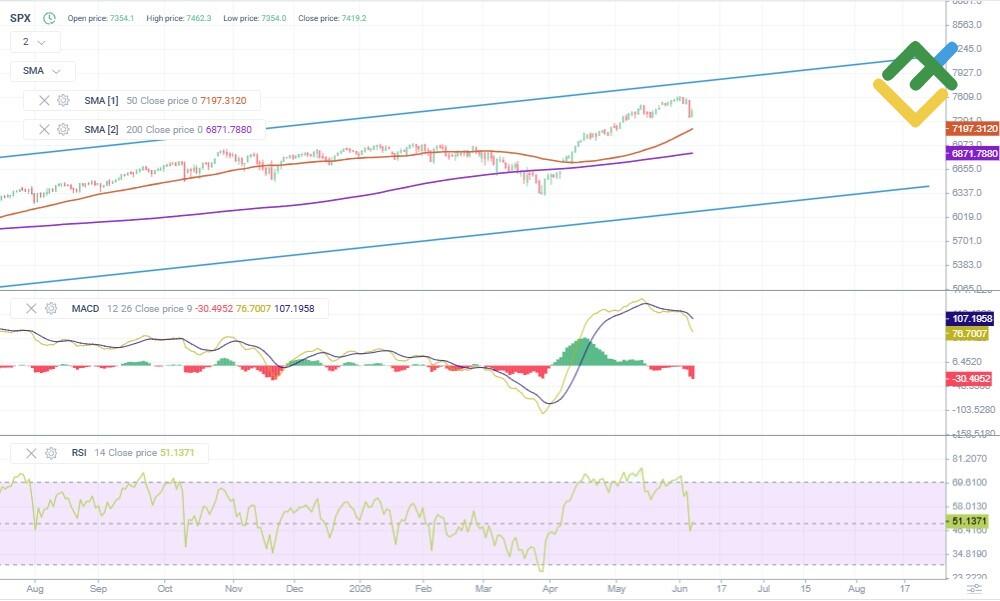
The table below shows the 12-month forecast for the S&P 500 index.
Month | Minimum, $ | Average, $ | Maximum, $ |
June 2026 | 7,050 | 7,350 | 7,650 |
July 2026 | 7,100 | 7,400 | 7,750 |
August 2026 | 7,000 | 7,300 | 7,700 |
September 2026 | 7,200 | 7,500 | 7,850 |
October 2026 | 7,250 | 7,600 | 7,900 |
November 2026 | 7,350 | 7,700 | 8,000 |
December 2026 | 7,400 | 7,800 | 8,100 |
January 2027 | 7,250 | 7,600 | 7,900 |
February 2027 | 7,350 | 7,700 | 8,000 |
March 2027 | 7,450 | 7,800 | 8,100 |
April 2027 | 7,550 | 7,900 | 8,200 |
May 2027 | 7,650 | 8,000 | 8,300 |
Long-Term Trading Plan for SPX for 2026
Once the correction ends, consider long trades at the support of $7,000–$7,200. The first profit target is the $7,600–7,800 range. After that, the asset may reach $8,000 or higher.
You can take profits gradually and add to long positions during pullbacks. If the price drops below $7,000, temporarily refrain from buying.
Analysts' S&P 500 Price Projections for 2026
The outlook for 2026 is ambiguous. Some analysts expect a correction following the rise at the start of the year, while others predict the uptrend will persist. The S&P 500's performance may be influenced by the Fed's policy, the US economy, and investor sentiment.
CoinCodex
Price range: $5,459.39–$7,417.82.
CoinCodex expects high volatility. The index is predicted to reach a high of $7,417.82 in June and then start to decline. The average price is projected to fall to $5,718.59 by September and recover to $6,182.26 by December.
Month | Minimum, $ | Average, $ | Maximum, $ |
June | 5,530.76 | 6,138.18 | 7,417.82 |
July | 5,799.98 | 6,063.74 | 6,237.72 |
August | 5,833.89 | 5,991.33 | 6,199.10 |
September | 5,459.39 | 5,718.59 | 5,926.81 |
October | 5,707.09 | 5,823.82 | 5,918.16 |
November | 5,882.10 | 6,083.60 | 6,288.07 |
December | 6,105.85 | 6,182.26 | 6,258.41 |
LongForecast
Price range: $6,663–$8,628.
According to LongForecast, the index will maintain a moderate bullish trend. The asset is expected to average at $7,359 in June and reach a high of $8,628 in August. By the end of the year, the average price is forecast to stabilize at $7,783.
Month | Minimum, $ | Average, $ | Maximum, $ |
June | 6,663 | 7,359 | 7,932 |
July | 6,759 | 7,334 | 8,036 |
August | 7,334 | 8,064 | 8,628 |
September | 7,168 | 7,708 | 8,248 |
October | 7,106 | 7,641 | 8,176 |
November | 7,203 | 7,745 | 8,287 |
December | 7,238 | 7,783 | 8,328 |
Meyka
Price range: $6,617.74–$7,955.96.
Meyka predicts a gradual rise in the SPX index. The average value is estimated to reach $6,617.74 in June and rise to $7,056.02 by December. The highest price, $7,955.96, is expected in December.
Month | Minimum, $ | Average, $ | Maximum, $ |
June | 5,799.94 | 6,617.74 | 7,482.67 |
July | 5,804.05 | 6,735.86 | 7,545.92 |
August | 5,914.23 | 6,807.94 | 7,677.14 |
September | 5,923.97 | 6,752.82 | 7,634.97 |
October | 6,127.51 | 6,873.53 | 7,757.90 |
November | 6,132.90 | 7,010.99 | 7,858.34 |
December | 6,193.25 | 7,056.02 | 7,955.96 |
Analysts' S&P 500 Price Projections for 2027
Forecasts for 2027 vary widely. Some analysts predict the SPX will keep going up, while others expect a correction after it hits new highs. The index's movement may be affected by interest rates, the financial performance of the index's companies, and the overall state of the US economy.
Note: The price ranges reflect the asset's expected volatility throughout the year. Lows and highs may not be shown in the summary tables.
CoinCodex
Price range: $6,078.69–$18,313.00.
CoinCodex forecasts strong volatility. The index is projected to average at $9,097.56 and reach a high of $18,313 in Q1. In the second half of the year, the index is anticipated to decline, with the average value reaching $11,584.67 by year-end.
Quarter | Minimum, $ | Average, $ | Maximum, $ |
Q1 | 6,078.69 | 9,097.56 | 18,313.00 |
Q2 | 11,794.00 | 14,171.00 | 16,315.00 |
Q3 | 9,571.10 | 11,109.33 | 12,784.00 |
Q4 | 9,872.45 | 11,584.67 | 12,664.00 |
LongForecast
Price range: $7,246–$10,642.
According to LongForecast, the index will continue to appreciate. The average price is expected to reach $7,994 in Q1. By Q4, the asset is projected to climb to a high of $10,642. Moderate volatility is anticipated.
Quarter | Minimum, $ | Average, $ | Maximum, $ |
Q1 | 7,246 | 7,994 | 8,828 |
Q2 | 7,946 | 8,719 | 9,646 |
Q3 | 8,844 | 9,560 | 10,326 |
Q4 | 9,006 | 9,775 | 10,642 |
Meyka
Price range: $6,133.55–$8,508.56.
Meyka anticipates a moderate uptrend. The average value is predicted to reach $7,064.35 at the start of the year and advance to $7,595.78 by year-end. In December, the asset may hit a high of $8,508.56.
Quarter | Minimum, $ | Average, $ | Maximum, $ |
Q1 | 6,153.01 | 7,064.35 | 7,967.24 |
Q2 | 6,133.55 | 7,124.97 | 8,092.85 |
Q3 | 6,423.41 | 7,382.15 | 8,316.80 |
Q4 | 6,592.05 | 7,595.78 | 8,508.56 |
Analysts' S&P 500 Price Projections for 2028
The outlook for 2028 is mixed. Some experts predict a correction after hitting new highs, while others expect the long-term uptrend to remain intact. The index's performance may be influenced by the pace of US economic growth, corporate earnings reports, and the Fed's monetary policy.
CoinCodex
Price range: $7,070.89–$12,263.
According to CoinCodex, the index may decrease after rising strongly in previous years. The average value is expected to reach $10,911.33 in Q1, drop to $7,834.18 by Q3, and stabilize at $7,658.46 by year-end.
Quarter | Minimum, $ | Average, $ | Maximum, $ |
Q1 | 9,287.71 | 10,911.33 | 12,263.00 |
Q2 | 8,505.66 | 9,079.81 | 9,806.15 |
Q3 | 7,070.89 | 7,834.18 | 8,882.80 |
Q4 | 7,292.01 | 7,658.46 | 8,203.50 |
LongForecast
Price range: $8,818–$12,472.
LongForecast suggests the bullish trend will carry on. The price is predicted to average at $10,271.33 in Q1 and peak at $12,472 by summer. In the second half of the year, a correction may take place.
Quarter | Minimum, $ | Average, $ | Maximum, $ |
Q1 | 9,496 | 10,271 | 11,081 |
Q2 | 10,113 | 11,204 | 12,472 |
Q3 | 8,818 | 10,354 | 11,936 |
Q4 | 9,187 | 9,952 | 10,714 |
CoinPriceForecast
Price range: $8,483–$8,951.
CoinPriceForecast anticipates moderate growth with no dramatic fluctuations. The price is projected to reach $8,483 by mid-year and advance to $8,951 by year-end.
Year | Mid-Year, $ | Year-End, $ |
2028 | 8,483 | 8,951 |
Analysts' S&P 500 Price Projections for 2029
The outlook for 2029 is generally positive. Analysts expect the stock market to continue rising, though projected estimates vary significantly.
CoinCodex
Price range: $7,266.40–$10,244.
CoinCodex believes the index will continue its uptrend. The average price is expected to stay around $7,645 in the first half of the year and surge above $9,600 in the second half. The asset is projected to hit a high of $10,244 by December.
Quarter | Minimum, $ | Average, $ | Maximum, $ |
Q1 | 7,353.23 | 7,644.97 | 8,279.42 |
Q2 | 7,266.40 | 7,645.89 | 8,200.52 |
Q3 | 7,522.26 | 8,696.60 | 10,208.00 |
Q4 | 9,150.11 | 9,653.42 | 10,244.00 |
LongForecast
Price range: $9,320–$13,088.
According to LongForecast, the index will keep climbing. The average value is estimated to be $10,098.67 in Q1 and may rise to $11,998.67 by Q3. High volatility is expected.
Quarter | Minimum, $ | Average, $ | Maximum, $ |
Q1 | 9,320 | 10,098 | 10,929 |
Q2 | 9,868 | 10,886 | 11,834 |
Q3 | 10,783 | 11,998 | 13,088 |
Q4 | 10,554 | 11,505 | 12,471 |
CoinPriceForecast
Price range: $9,394–$9,711.
CoinPriceForecast projects a steady uptick in the SPX index. The price is expected to reach $9,394 by mid-year and climb to $9,711 by December.
Year | Mid-Year, $ | Year-End, $ |
2029 | 9,394 | 9,711 |
Analysts' S&P 500 Price Projections for 2030
The outlook for 2030 is largely optimistic. Many analysts expect the long-term uptrend to continue, though growth estimates vary widely. The index's trajectory may be influenced by the economic cycle, corporate earnings growth, and investment activity.
CoinCodex
Price range: $9,559.16–$29,313.
CoinCodex forecasts the SPX to increase further. The average price is predicted to reach $9,857.87 in Q1. In the second half of the year, the index is set to accelerate, hitting a high of $29,313 by December.
Quarter | Minimum, $ | Average, $ | Maximum, $ |
Q1 | 9,559.16 | 9,857.87 | 10,260.00 |
Q2 | 10,006.00 | 12,021.67 | 13,842.00 |
Q3 | 11,773.00 | 13,200.67 | 14,836.00 |
Q4 | 14,840.00 | 20,703.00 | 29,313.00 |
CoinPriceForecast
Price range: $9,724–$10,275.
According to CoinPriceForecast, the index will continue to grow moderately. The price is predicted to reach $9,724 by mid-year and go up to $10,275 by December.
Year | Mid-Year, $ | Year-End, $ |
2030 | 9,724 | 10,275 |
Analysts' S&P 500 Price Projections until 2050
Long-term forecasts for the S&P 500 index remain highly uncertain. Economic growth, technological advancements, inflation, and monetary policy changes may influence market trends over the coming decades.
CoinPriceForecast expects the SPX index to rise to $12,649 by 2033 and to $13,839 by 2035.
CoinCodex takes a more optimistic view. According to the platform, the price may reach $38,115 by 2040 and $98,820 by 2050.
Year | CoinPriceForecast, $ | CoinCodex, $ |
2033 | 12,649 | – |
2035 | 13,839 | – |
2040 | – | 38,115 |
2050 | – | 98,820 |
S&P 500 (SPX) Market Sentiment on Social Media
Media sentiment surrounding the S&P 500 can influence the index's short-term performance. Positive expectations regarding the US economy, corporate earnings, and monetary policy can support demand for the SPX. Negative news, on the other hand, can increase volatility and trigger corrections.
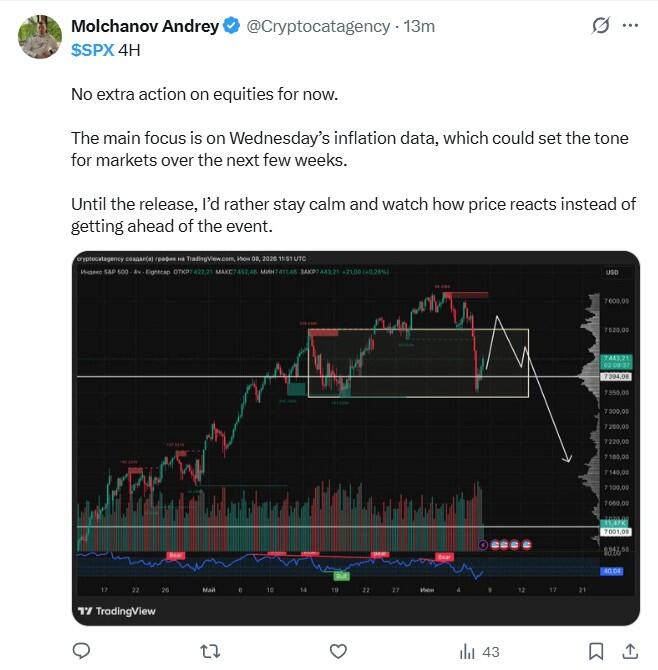
User @Cryptocatagency takes a cautious stance, stating that the future price movement will largely depend on macroeconomic indicators, particularly inflation.
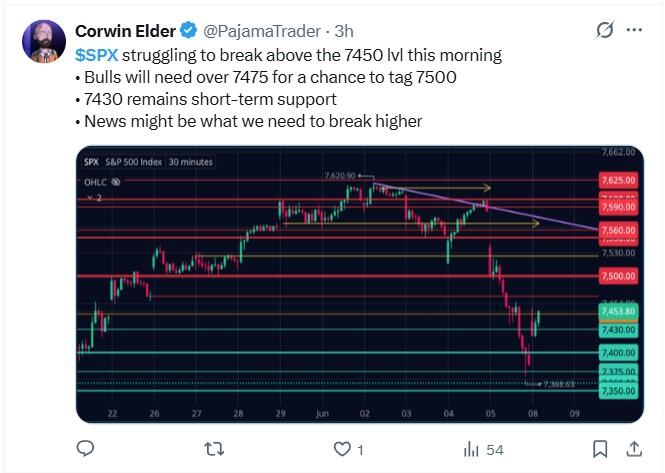
@PajamaTrader highlights the nearest support and resistance levels and believes that bulls need to push the price back above $7,475 for the upward trend to continue.
Overall, sentiment regarding the SPX remains moderately positive. However, market participants are awaiting new macroeconomic signals before opening positions. It is essential to conduct technical and fundamental analysis and review the latest expert insights before making trading or investment decisions.
S&P 500 Price History
The S&P 500 (SPX) index reached its all-time high of $7616.2 on 02.06.2026.
The lowest price of the S&P 500 (SPX) index was recorded on 04.06.1982 when the index declined to $336.91.
Below is a chart showing the performance of SPX over the last ten years. In this connection, it is important to evaluate historical data to make predictions as accurate as possible.
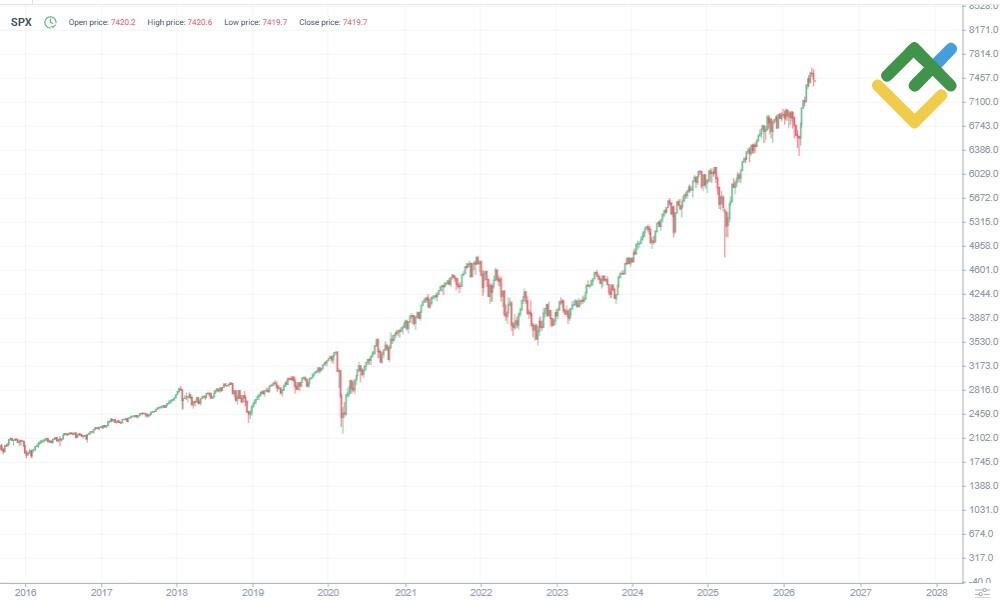
- March 2020. The index crashed due to the COVID-19 pandemic and the global economic shutdown. Concerns about corporate earnings, supply chain disruptions, and rising unemployment led to a massive sell-off and a spike in volatility.
- October–November 2022. The price reached a swing low amid the Fed's aggressive monetary policy tightening. Elevated inflation and rising interest rates weighed on stocks, after which the market began to gradually stabilize.
- November 2021–January 2022. The downward reversal followed the historic highs, when investors began to factor in the winding down of stimulus measures and the upcoming rise in interest rates.
- April 2025. A short-term correction occurred amid fears of an economic slowdown and uncertainty regarding regulatory policy. Profit-taking exacerbated the decline, but the losses were quickly recovered.
- In January–February 2026, the index reached a high of $7,010.60 following the release of positive US GDP data. In March, the price pulled back to $6,315.10 due to the conflict in the Middle East and rising oil prices. In June, the index reached an all-time high of $7,616.20.
S&P 500 Index Fundamental Analysis
A fundamental analysis of the S&P 500 Index provides investors with a detailed understanding of its real market value. This analysis encompasses evaluating economic data, corporate reports, and other macroeconomic factors that influence the index's movement. Investors employ fundamental analysis to assess the index's long-term growth potential and determine its current price.
What Factors Affect the SPX Price?
Before making any investment decisions, investors should scrutinize the following factors to gain a strategic advantage in managing their investments in the S&P 500 Index.
- Economic climate. The overall economic indicators, including GDP, employment rates, and inflation, can have a substantial impact on the returns of companies included in the index.
- Political landscape. Shifts in tax policy, trade agreements, or political stability can lead to significant fluctuations in value.
- Corporate reports and earnings. The financial results of major companies, particularly those with substantial weighting in an index, play a crucial role in shaping the index's price.
- Investor sentiment. Market optimism or pessimism can trigger significant changes in stock prices, even if the fundamentals remain unchanged.
- Monetary policy. Central bank decisions on rates or other measures to stimulate the economy directly affect the value of the index.
- Global factors. Global economic trends, including supply and demand, directly affect companies and their value.
More Facts About S&P 500
The S&P 500 is widely regarded as the best single gauge of large-cap US equities. Developed by Standard & Poor's in 1957, it encompasses 500 prominent US companies listed on public exchanges. The index's primary objective is to offer investors a comprehensive view of the US stock market and the broader economy. The index's selection criteria, which include market capitalization, liquidity, and industry affiliation, contribute to its reliability as an indicator of broader market trends.
A key feature of the S&P 500 is its diversification. It includes companies from various sectors of the economy, such as information technology, healthcare, financials, and consumer staples. This diversification helps mitigate volatility and reduce risk for investors.
The index plays a key role in investment strategies, often serving as a benchmark for funds, including index funds and ETFs. The index's influence on global financial markets is significant, and its performance is frequently highlighted in economic news and analyses.
Advantages and Disadvantages of Investing in the S&P 500
The S&P 500 Index is an attractive investment vehicle for a wide range of investors, from novice to experienced, seeking sustainable capital growth. However, it is essential to carefully consider the potential benefits and risks associated with trading this instrument.
Advantages
- Diversification. The S&P 500 Index includes the 500 largest US companies, providing broad diversification that reduces dependence on the position of one or a few companies.
- Long-term growth. Historically, the index has shown steady growth over decades, making it attractive to long-term investors.
- Transparency and accessibility. The index is open to analysis due to readily available information, and a low entry threshold allows even beginner investors to participate in trading.
- Passive investing. This approach utilizes funds that track the performance of the index, allowing investors to benefit from market movements without the hassle of manual trading.
Disadvantages
- Market risks. The general state of the market, which is subject to volatility and crises, can affect returns.
- Limited growth in the short term. Investing in the index is not suitable for those seeking immediate profits, as its trading strategy is oriented towards long-term goals.
- Lack of control over individual stocks. Investors cannot customize a portfolio by excluding inefficient companies.
- Geography. The index focuses on the US market, which may not reflect global economic trends.
How We Make Forecasts
The following factors are important for predicting both short- and long-term changes in trading instruments such as the S&P 500 index:
1. Fundamental analysis, which includes:
- evaluation of forecasts from leading analytical firms;
- assessment of companies included in the index, e.g., their market cap, revenues and expenditures, earnings per share, business profitability, return on investment, etc.;
- estimates of the S&P 500 index market cap, total EPS, P/E ratio, S&P 500 dividend yield, and the volatility index (VIX);
- evaluation of news and statements related to the index;
- analysis of geopolitical and macroeconomic risks.
2. An analysis of market sentiment and public opinions on social media.
3. Technical analysis. The most effective and conservative research model includes a combination of candlestick, chart, and indicator analysis. This method has been proven effective in identifying price reversals. It allows investors and traders to determine optimal entry points and profit targets while eliminating risks.
Conclusion: Is the S&P 500 a Good Investment?
The S&P 500 remains one of the most reliable long-term investments. Its historical average annual return is around 10–11%, outperforming inflation and other asset classes. The index covers a wide range of sectors and includes leading US companies.
However, potential corrections cannot be ruled out. Investors should consider the S&P 500 index as part of a diversified portfolio rather than allocating all their funds solely to this index. Short-term speculation involves significant risks, especially amid ongoing geopolitical tensions and uncertainty surrounding the Federal Reserve's monetary policy.
S&P 500 Price Prediction FAQs
The current price of SPX is $7 489.7 as of 19.06.2026.
According to long-term forecasts, the S&P 500 is expected to maintain its long-term uptrend, driven by the growth of major US companies, rising corporate profits, and continued investor interest in the US stock market.
Forecasts for 2026 vary significantly. According to analysts, the index will range between $5,459 and $8,628. Some experts anticipate moderate growth throughout the year, though a correction may occur once the asset reaches swing highs.
The outlook for 2027 is mostly positive. The index is expected to trade between $6,079 and $18,313 and hit new all-time highs. However, short-term corrections cannot be ruled out.
According to forecasts, the S&P 500 index will trade between $9,559 and $29,313 in 2030. Although estimates vary significantly, most scenarios suggest that the long-term uptrend will persist.
Over the past 10 years, the S&P 500 index has returned approximately +250% excluding dividends, or +314% including reinvested dividends. This corresponds to a compound annual growth rate (CAGR) of about 13.4% and 15.3%, respectively.
The decision depends on your investment goals, time horizon, and risk tolerance. Many market participants view the S&P 500 as a long-term investment. The index is broadly diversified across sectors, which also appeals to conservative investors.
Price chart of SPX in real time mode

The content of this article reflects the author’s opinion and does not necessarily reflect the official position of LiteFinance broker. The material published on this page is provided for informational purposes only and should not be considered as the provision of investment advice for the purposes of Directive 2014/65/EU.
According to copyright law, this article is considered intellectual property, which includes a prohibition on copying and distributing it without consent.