Traditionally considered a safe-haven currency, the yen has faced significant challenges in recent years. As a result, the USDJPY pair, representing the balance of power between the US and Japanese economies, has turned into a battleground for bulls and bears. Given these developments, what lies ahead for this currency pair? Which factors are likely to exert the most influence on its trajectory?
This article provides predictions for the USDJPY exchange rate for 2026, 2027, 2028, and beyond. These forecasts are shaped by various factors, including macroeconomic trends, geopolitical developments, and technological innovation.
The article covers the following subjects:
- Major Takeaways
- USDJPY Real-Time Market Status
- USDJPY Price Forecast for 2026 Based on Technical Analysis
- Analysts' USDJPY Price Projections for 2027
- Analysts' USDJPY Price Projections for 2028
- Analysts' USDJPY Price Projections for 2029
- Analysts' USDJPY Price Projections for 2030
- Analysts' USDJPY Price Projections up to 2050
- USDJPY Market Sentiment on Social Media
- USDJPY Price History
- USDJPY Price Fundamental Analysis
- More Facts About USDJPY
- How We Make Forecasts
- Conclusion: Is USDJPY a Good Investment?
- USDJPY Price Prediction FAQs
Major Takeaways
The current price of the pair is ¥157.835 as of 03.08.2026.
The USDJPY pair reached its all-time high of ¥358.4 on 10.01.1971. Its all-time low of ¥75.57 was recorded on 31.10.2011.
The uptrend is expected to continue in the second half of 2026. According to analysts' forecasts, USDJPY could rise to ¥167.00–¥175.35.
Experts estimate that the pair could climb to ¥190.74–¥201.71 by the end of 2027. However, some analysts believe USDJPY could stabilize near ¥165.00.
Forecasts for 2028–2030 vary considerably. Some analysts expect USDJPY to advance significantly toward ¥196.35–¥265.46. Others anticipate a more moderate appreciation, with the pair reaching ¥179.27 by the end of 2030.
Between 2040 and 2050, USDJPY will likely be influenced by global economic shifts, technological progress, and geopolitical developments. The pair may experience fluctuations due to changes in interest rates, trade disputes, and political instability. The long-term trend will be shaped by the strength of the U.S. and Japanese economies, as well as innovation in the financial sector.
USDJPY Real-Time Market Status
The USDJPY currency pair is trading at ¥157.835 as of 03.08.2026.
The key metrics below will help traders assess the current state of the USDJPY pair in the market.
Interest rate is the cost of borrowing money, expressed as a percentage of the loan amount. It influences both investment and consumer spending.
The national consumer price index (CPI) (YoY) measures inflation by tracking yearly changes in the cost of a standard basket of goods and services.
Economic growth (GDP) (YoY) gauges the increase in a country's goods and services over a year.
The employment rate reflects the proportion of the working-age population that is employed. A high employment rate indicates a healthy economy.
The unemployment rate is the share of the working-age population that is unemployed but actively looking for work. A low unemployment rate indicates a strong labor market.
Balance of trade is the difference between exports and imports of goods and services.
Foreign exchange reserves refer to the holdings of foreign currencies and gold that a country uses to stabilize its currency and finance imports.
External debt is the total amount a country owes to foreign lenders.
Metric | Value (Japan) | Value (US) |
Interest rate | 1.00% | 3.75% |
Consumer price index (CPI) | 1.5% | 4.2% |
Economic growth (GDP) | 2.1% | 2.1% |
Employment rate | 62.6% | 59.3% |
Unemployment rate | 2.5% | 4.3% |
Trade balance | -1.71 trillion JPY | -$901.5 billion |
Gold reserves | 846.0 tonnes | 8,133.5 tonnes |
External debt | 761.469 trillion JPY | $29.448 trillion |
USDJPY Price Forecast for 2026 Based on Technical Analysis
To assess the USDJPY outlook for the next 12 months, we will analyze the weekly chart.
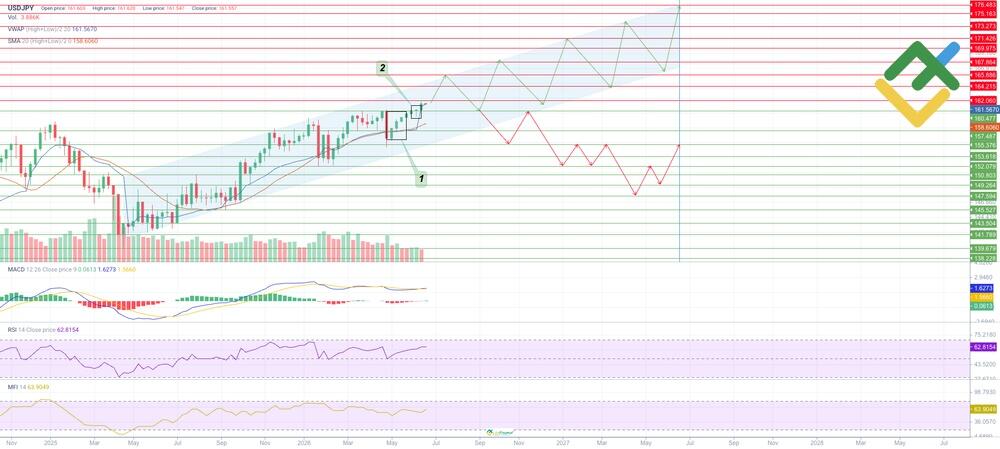
Since early May, USDJPY has resumed its upward movement within a long-term uptrend. Technical indicators and candlestick patterns point to a bullish outlook:
A Three White Soldiers candlestick pattern (1) formed within the ¥155.37–¥160.47 range, signaling the potential for further upside. A Hammer pattern (2) formed near ¥160.47, suggesting that buyers remain in control of the market.
The MACD values are near the zero line, indicating a gradual increase in bullish momentum.
The RSI is holding at 62 and could rise further.
The MFI is gradually rising, indicating capital inflows into the asset.
The VWAP and SMA20 are below the current market price, highlighting the strength of the bullish trend.
The table below presents a 12-month forecast for USDJPY.
Month | Low, ¥ | Average price, ¥ | High, ¥ |
July 2026 | 161.62 | 163.71 | 165.81 |
August 2026 | 161.33 | 163.75 | 166.18 |
September 2026 | 160.28 | 163.30 | 166.33 |
October 2026 | 165.73 | 167.15 | 168.57 |
November 2026 | 162.07 | 163.75 | 165.43 |
December 2026 | 161.40 | 164.46 | 167.52 |
January 2027 | 166.70 | 169.05 | 171.41 |
February 2027 | 165.36 | 167.19 | 169.02 |
March 2027 | 164.16 | 166.96 | 169.76 |
April 2027 | 168.79 | 171.51 | 174.24 |
May 2027 | 166.56 | 169.06 | 171.56 |
June 2027 | 166.33 | 171.14 | 175.96 |
Long-Term Trading Plan for USDJPY for 2026
The technical analysis has allowed us to identify key support and resistance levels that can be used in a trading strategy.
Trading Plan for the Year
The uptrend is highly likely to continue.
Key support levels: ¥160.47, ¥157.48, ¥155.37, ¥153.61, ¥152.07, ¥150.80, ¥149.26, ¥147.59, ¥145.52, ¥143.50, ¥141.78, ¥139.67, ¥138.22.
Key resistance levels: ¥162.06, ¥164.21, ¥165.88, ¥167.86, ¥169.97, ¥171.42, ¥173.27, ¥175.16, ¥176.48.
Base scenario: open long positions above the ¥162.06 resistance level on increased volume, with potential targets at ¥164.21–¥176.48.
Alternative scenario: open short positions below the ¥160.47 support level on increased volume, targeting ¥157.48 in the short term. For longer-term trades, take-profit targets may be set in the ¥155.37–¥138.22 zone.
Analysts' USDJPY Price Projections for 2026
Analysts expect the US dollar to continue strengthening against the Japanese yen in 2026, supported by ongoing geopolitical tensions and sustained demand for the USD as a safe-haven currency. At the same time, the gradual normalization of the Bank of Japan's monetary policy and potential Federal Reserve rate cuts could limit further gains in the pair.
LongForecast
Price range (JPY): 160.00–172.00.
According to LongForecast estimates, USDJPY could stabilize around ¥164.00 in July. The pair is projected to reach a high of ¥172.00 by November. By December, the exchange rate is expected to correct to around ¥167.00.
Month | Opening price, ¥ | Low/High, ¥ | Closing price, ¥ |
July | 163.00 | 160.00-166.00 | 164.00 |
August | 164.00 | 164.00-170.00 | 167.00 |
September | 167.00 | 163.00-167.00 | 165.00 |
October | 165.00 | 165.00-171.00 | 168.00 |
November | 168.00 | 166.00-172.00 | 169.00 |
December | 169.00 | 164.00-170.00 | 167.00 |
WalletInvestor
Price range (JPY): 157.43–180.78.
According to WalletInvestor analysts, USDJPY is expected to rise gradually throughout the year. The exchange rate is projected to stand at around ¥164.30 in July. By the end of September, the pair could climb to ¥168.70. The highest level of the year is expected in December at ¥180.78.
Month | Opening price, ¥ | Closing price, ¥ | Low, ¥ | High, ¥ |
July | 162.13 | 164.30 | 157.43 | 169.06 |
August | 164.37 | 166.54 | 159.44 | 171.53 |
September | 166.61 | 168.70 | 162.94 | 172.41 |
October | 168.78 | 170.94 | 162.70 | 177.10 |
November | 171.01 | 173.11 | 167.42 | 176.74 |
December | 173.18 | 175.35 | 167.81 | 180.78 |
CoinCodex
Price range (JPY): 161.35–170.96.
According to CoinCodex estimates, USDJPY is expected to maintain a moderate upward trend. The average price could reach ¥163.75 in July. By September, the pair is projected to rise to ¥166.33. By December, prices may reach an annual high of ¥170.96.
Month | Low, ¥ | Average price, ¥ | High, ¥ |
July | 161.77 | 163.75 | 165.69 |
August | 161.35 | 163.43 | 164.88 |
September | 164.76 | 166.33 | 168.65 |
October | 164.75 | 167.43 | 168.74 |
November | 164.32 | 166.51 | 167.92 |
December | 167.81 | 169.26 | 170.96 |
Analysts' USDJPY Price Projections for 2027
Forecasts for 2027 vary significantly. USDJPY's performance will largely depend on monetary policy decisions by the Federal Reserve and the Bank of Japan. A more hawkish stance from the Fed could support the US dollar, while US rate cuts or a slowdown in economic growth may strengthen the Japanese yen.
Note: The price ranges reflect the asset's expected volatility throughout the year. Lows and highs may not be shown in the summary tables.
LongForecast
Price range (JPY): 163.00–181.00.
According to LongForecast, USDJPY could continue its advance during the first half of the year. The exchange rate may climb to ¥177.00 by June. A correction is possible in the second half of the year, with the pair potentially retreating to around ¥165.00 by year-end.
Quarter | Opening price, ¥ | Low/High, ¥ | Closing price, ¥ |
Q1 | 167.00 | 165.00-178.00 | 175.00 |
Q2 | 175.00 | 169.00-180.00 | 177.00 |
Q3 | 177.00 | 170.00-181.00 | 173.00 |
Q4 | 173.00 | 163.00-175.00 | 165.00 |
WalletInvestor
Price range (JPY): 171.62–207.25.
According to WalletInvestor analysts, USDJPY is expected to continue rising. At the beginning of the year, the exchange rate could stand at ¥175.42. By summer, the pair is projected to climb to ¥188.42. By December, the price will likely reach a high of ¥207.25.
Quarter | Opening price, ¥ | Closing price, ¥ | Low, ¥ | High, ¥ |
Q1 | 175.42 | 181.85 | 171.62 | 187.49 |
Q2 | 181.92 | 188.42 | 174.64 | 193.89 |
Q3 | 188.50 | 195.07 | 184.35 | 202.48 |
Q4 | 195.14 | 201.71 | 189.29 | 207.25 |
CoinCodex
Price range (JPY): 164.16–194.24.
According to CoinCodex, USDJPY could rise to ¥173.23 by summer. A correction toward ¥167.59 is possible by autumn. The uptrend is then expected to resume, with the pair potentially reaching a yearly high of ¥194.24 by December.
Quarter | Low, ¥ | Average price, ¥ | High, ¥ |
Q1 | 166.23 | 173.04 | 174.68 |
Q2 | 166.96 | 173.23 | 176.53 |
Q3 | 164.16 | 167.59 | 176.12 |
Q4 | 166.44 | 190.74 | 194.24 |
Analysts' USDJPY Price Projections for 2028
Analysts expect USDJPY to remain in an uptrend in 2028, supported by steady demand for the US dollar and the divergence in monetary policy between the United States and Japan. However, some analysts anticipate periods of correction and elevated volatility.
LongForecast
Price range (JPY): 158.00–181.00.
According to LongForecast estimates, the pair could reach approximately ¥165.00 at the beginning of the year. By summer, the exchange rate may decline to ¥160.00. In the fourth quarter, USDJPY could reach a high of ¥181.00.
Quarter | Opening price, ¥ | Low/High, ¥ | Closing price, ¥ |
Q1 | 165.00 | 164.00-175.00 | 172.00 |
Q2 | 172.00 | 158.00-172.00 | 160.00 |
Q3 | 160.00 | 160.00-171.00 | 168.00 |
Q4 | 168.00 | 166.00-181.00 | 178.00 |
WalletInvestor
Price range (JPY): 172.96–204.09.
WalletInvestor analysts expect USDJPY to decline gradually. The average exchange rate is projected to peak at ¥204.09 in the first quarter. However, according to the forecast, the average price could fall to ¥180.08 by the third quarter. A modest recovery is expected by December.
Quarter | Low, ¥ | Average price, ¥ | High, ¥ |
Q1 | 184.84 | 194.52 | 204.09 |
Q2 | 177.06 | 183.20 | 202.57 |
Q3 | 172.96 | 180.08 | 187.78 |
Q4 | 173.50 | 179.70 | 193.00 |
CoinCodex
Price range (JPY): 176.86–194.14.
CoinCodex analysts forecast that USDJPY will trade largely sideways. By summer, the average exchange rate could reach ¥182.20. By December, the pair may rise to ¥185.51.
Quarter | Low, ¥ | Average price, ¥ | High, ¥ |
Q1 | 181.16 | 185.48 | 194.14 |
Q2 | 177.95 | 182.20 | 187.65 |
Q3 | 176.86 | 181.97 | 187.84 |
Q4 | 182.43 | 185.51 | 187.86 |
Analysts' USDJPY Price Projections for 2029
According to expert forecasts, USDJPY is expected to trade within a broad range of ¥166.00–¥202.55 in 2029. By then, the Bank of Japan's policy normalization may be largely complete. The pair's performance will depend on the pace of economic growth in both the United States and Japan.
LongForecast
Price range (JPY): 166.00–196.00.
According to LongForecast, USDJPY could stabilize around ¥178.00 by summer. Further gains are expected afterward. In the fourth quarter, USDJPY could reach a high of ¥196.00.
Quarter | Opening price, ¥ | Low/High, ¥ | Closing price, ¥ |
Q1 | 178.00 | 166.00-178.00 | 172.00 |
Q2 | 172.00 | 172.00-184.00 | 178.00 |
Q3 | 178.00 | 178.00-195.00 | 192.00 |
Q4 | 192.00 | 184.00-196.00 | 192.00 |
WalletInvestor
Price range (JPY): 175.03–202.55.
WalletInvestor analysts expect the US dollar to strengthen moderately against the Japanese yen. By the end of the first quarter, the average exchange rate could reach ¥183.60. By mid-year, USDJPY is projected to climb to ¥190.84, likely reaching a high of ¥202.55 by December.
Quarter | Low, ¥ | Average price, ¥ | High, ¥ |
Q1 | 175.03 | 183.60 | 190.95 |
Q2 | 176.47 | 190.84 | 196.62 |
Q3 | 182.94 | 194.08 | 200.29 |
Q4 | 183.06 | 193.62 | 202.55 |
CoinCodex
Price range (JPY): 172.02–187.93.
According to CoinCodex forecasts, the average exchange rate could reach ¥180.87 by June. Further gains are expected in the second half of the year. By December, the price will likely reach a high of ¥187.93.
Quarter | Low, ¥ | Average price, ¥ | High, ¥ |
Q1 | 172.02 | 174.12 | 186.00 |
Q2 | 173.89 | 180.87 | 182.84 |
Q3 | 180.64 | 184.23 | 187.21 |
Q4 | 179.93 | 184.01 | 187.93 |
Analysts' USDJPY Price Projections for 2030
Forecasts for 2030 remain mixed. The future direction of USDJPY will depend on inflation trends, central bank monetary policy, and the overall state of the global economy.
WalletInvestor
Price range (JPY): 185.15–213.28.
According to WalletInvestor estimates, a correction is expected after the strong gains seen in previous years. The average exchange rate could reach ¥204.73 by March. By December, the average rate is projected to decline to ¥196.35.
Quarter | Low, ¥ | Average price, ¥ | High, ¥ |
Q1 | 185.15 | 204.73 | 211.02 |
Q2 | 191.56 | 198.48 | 213.28 |
Q3 | 187.99 | 194.64 | 207.61 |
Q4 | 188.02 | 196.35 | 205.53 |
Gov Capital
Price range (JPY): 212.51–295.91.
Gov Capital analysts maintain a more optimistic outlook. By the end of the first quarter, the average exchange rate could reach ¥242.76. According to the forecast, USDJPY could climb to a high of ¥295.91 by the end of the year.
Quarter | Lowest possible price, ¥ | Average price, ¥ | Highest possible price, ¥ |
Q1 | 212.51 | 242.76 | 269.04 |
Q2 | 217.34 | 247.36 | 274.67 |
Q3 | 221.99 | 254.77 | 280.54 |
Q4 | 228.69 | 265.46 | 295.91 |
CoinCodex
Price range (JPY): 172.69–184.14.
According to CoinCodex, USDJPY is not expected to establish a clear trend in 2030. After rising to a peak of ¥184.14 by summer, the pair may enter a correction phase. By the end of the year, the average exchange rate could stabilize around ¥179.27.
Quarter | Low, ¥ | Average price, ¥ | High, ¥ |
Q1 | 176.39 | 182.51 | 183.93 |
Q2 | 175.76 | 177.53 | 184.14 |
Q3 | 172.69 | 176.67 | 179.31 |
Q4 | 175.43 | 179.27 | 180.13 |
Analysts' USDJPY Price Projections up to 2050
Long-term USDJPY forecasts remain highly uncertain. The exchange rate could be influenced by changes in the global economy, shifts in US and Japanese monetary policy, as well as demographic trends and technological developments.
Additional factors that may affect USDJPY include changes in the structure of the global financial system, geopolitical developments, and the pace of economic growth in the world's largest economies. Forecasts over such a long time horizon should be viewed as possible scenarios rather than precise predictions.
USDJPY Market Sentiment on Social Media
Social media sentiment can influence short-term fluctuations in USDJPY. Positive expectations for the US economy typically support USDJPY, while stronger economic growth in Japan may put downward pressure on the pair.
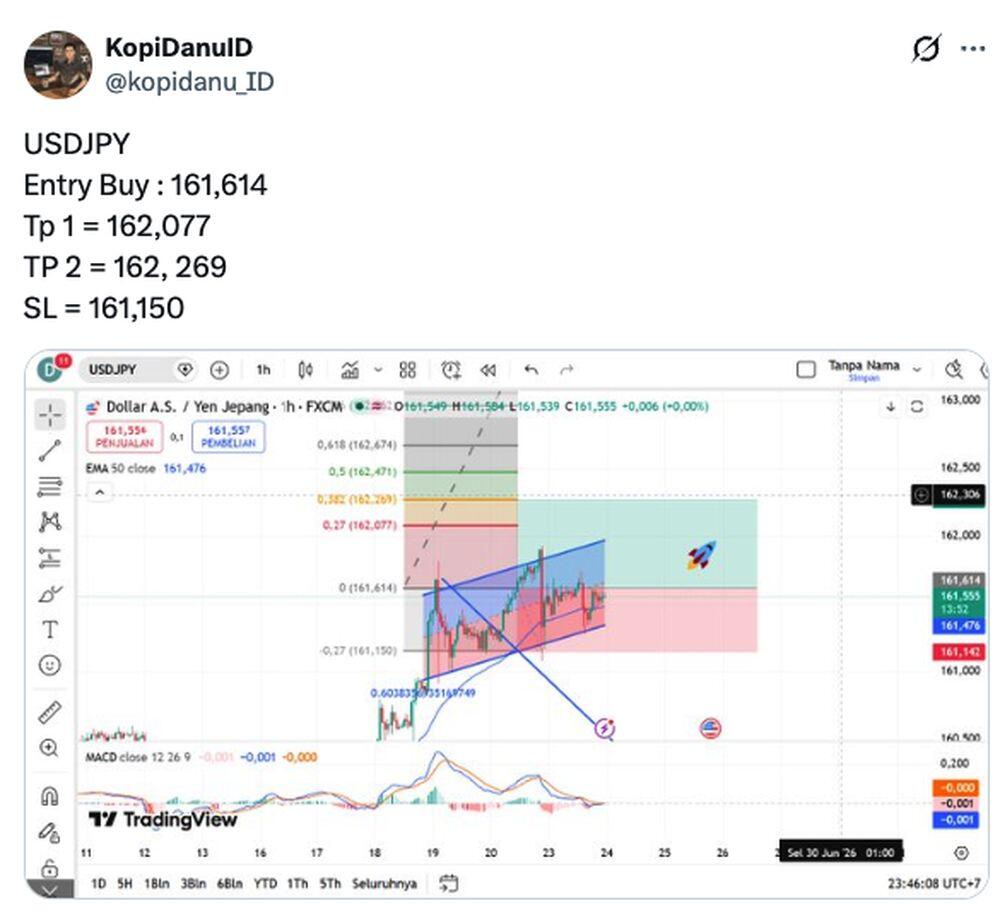
According to @kopidanu_ID, USDJPY could rise to ¥162.26 in the near term.
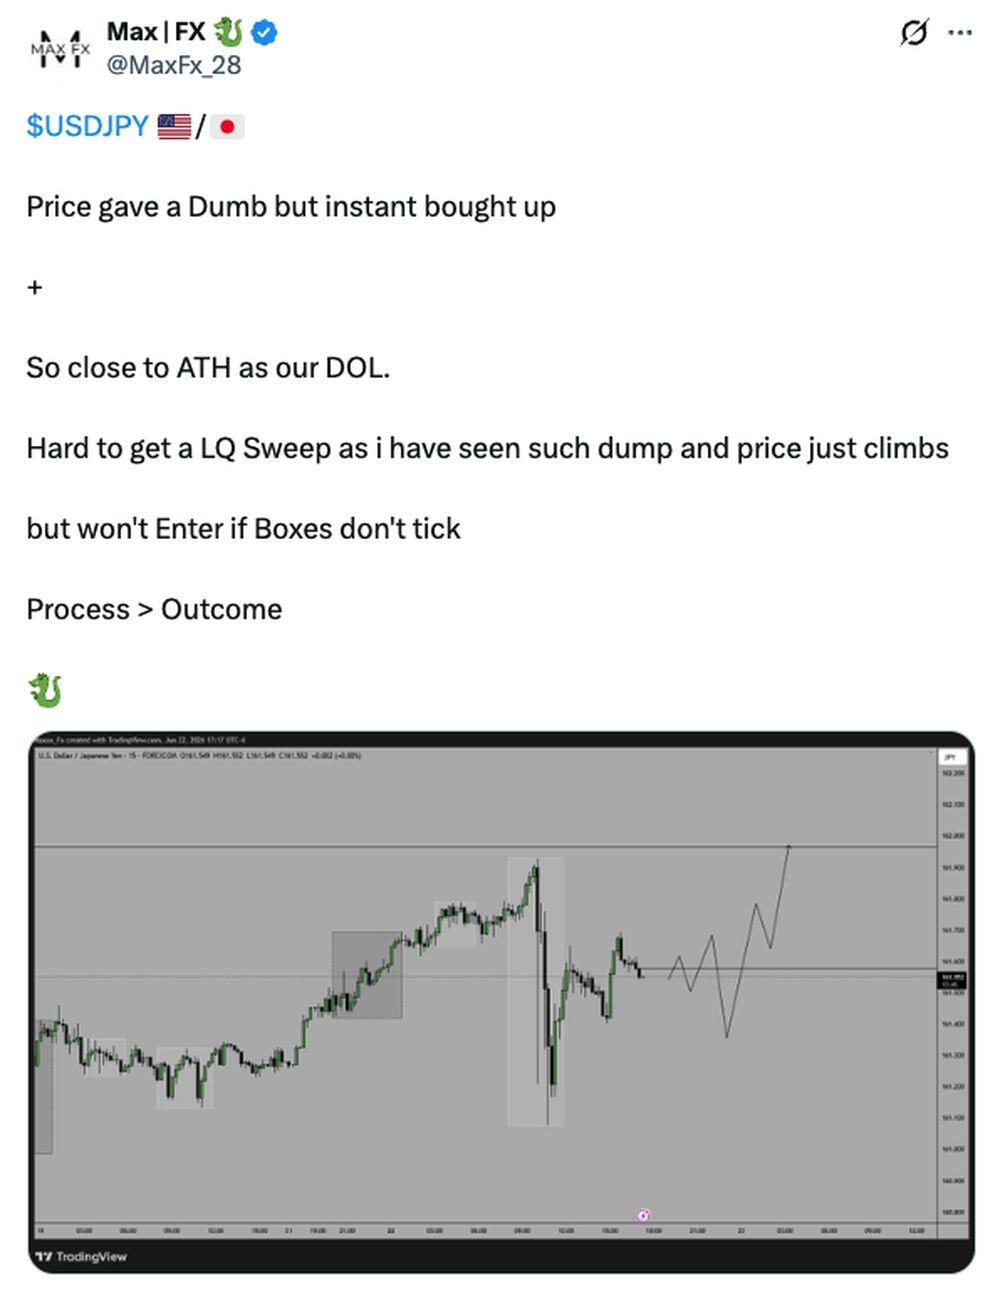
Independent analyst @MaxFX_28 also expects the pair to climb to ¥162.00 in the short term.
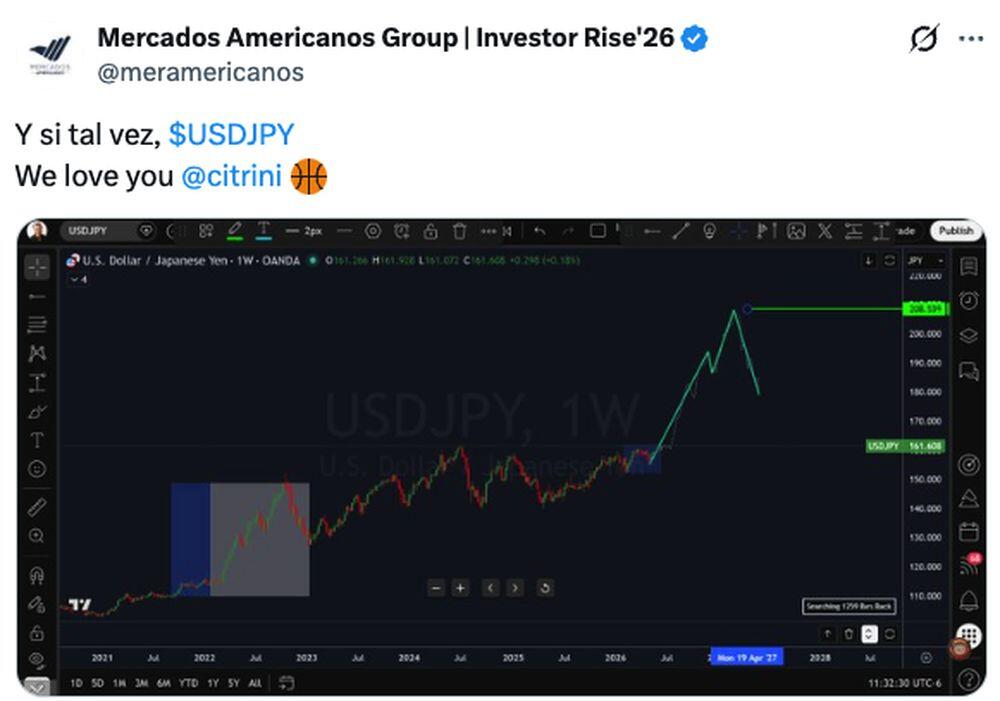
Independent trader @meramericanos forecasts that USDJPY could reach ¥208.53 over the long term.
Most traders and investors expect the USDJPY uptrend to continue. Before making trading or investment decisions, it is important to conduct both technical and fundamental analysis and review the latest expert opinions.
USDJPY Price History
The USDJPY pair reached its all-time high of 358.4 JPY on 10.01.1971.
The lowest price of the USDJPY pair was recorded on 31.10.2011 and reached 75.57 JPY.
The chart below shows the USDJPY pair performance over the last ten years. Evaluating historical data is crucial for making accurate forecasts.
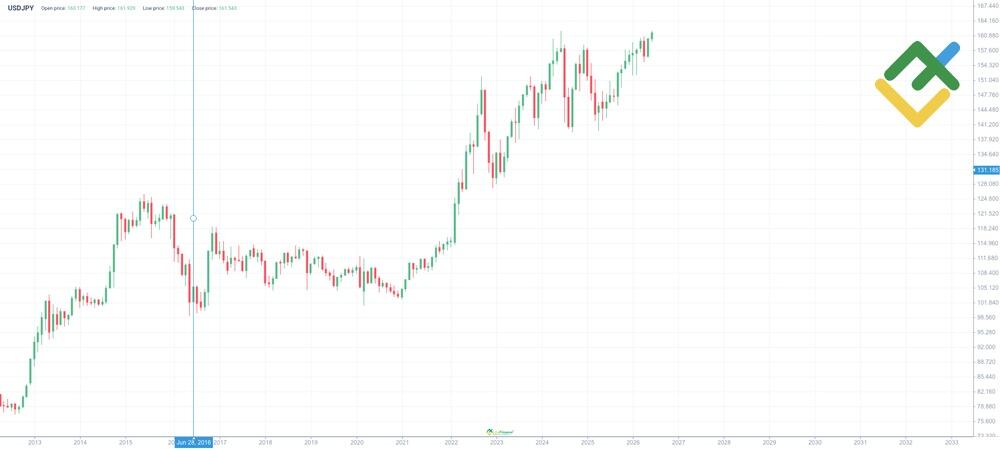
From 2020 to early 2025, the USDJPY exchange rate has experienced significant swings, influenced by global economic and political factors:
In early 2020, with the onset of the COVID-19 pandemic, the yen strengthened as a safe-haven currency, pushing the pair towards ¥102.00. However, with extensive stimulus measures in the US and a global economic recovery in 2021, the yen started to weaken, resulting in an upward trend for the USDJPY.
In 2022, US inflation began to increase rapidly, prompting the US Fed to tighten its monetary policy. This decision led to a further strengthening of the US dollar and propelled the USDJPY exchange rate to reach multi-year highs by the year's end. Meanwhile, the Bank of Japan's ultra-loose policy only exacerbated the situation.
In 2023, US inflation growth decelerated, but the Fed continued to elevate rates. The BOJ started to adjust its policy, allowing bond yields to rise, which resulted in a correction in the USDJPY pair.
In 2025, the USDJPY pair showed highly volatile but predominantly upward movement. After the yen weakened in the spring, the dollar gradually strengthened, and by the fall, the exchange rate had returned to the upper levels of the range. The increase was supported by the interest rate differential and expectations that the Fed would maintain its strict monetary policy. The pair remained sensitive to central bank actions and global economic shifts, which sparked elevated volatility in the market.
In January 2026, USDJPY stood at ¥156.67, before falling sharply to ¥152.27 by mid-February. By April, the pair had climbed to ¥160.47 amid geopolitical uncertainty, but by the end of the month, it had dropped back to ¥155.04. The uptrend later resumed, with the exchange rate rising to ¥161.92 by mid-June.
USDJPY Price Fundamental Analysis
Fundamental analysis of the USDJPY exchange rate is based on the assessment of macroeconomic indicators of the US and Japan. The key factors affecting the pair's performance include the interest rates of the Fed and the Bank of Japan and the geopolitical situation, among others. The combination of these factors determines the long-term trends of the USDJPY exchange rate.
What Factors Affect the USDJPY Price?
Interest rates. The difference in interest rates set by the US Fed and the Bank of Japan significantly affects the appeal of the USDJPY pair. High interest rates in the US make the greenback more attractive for investors, which leads to the appreciation of the USDJPY pair.
Economic indicators. Important economic data such as GDP, inflation, unemployment rate, and retail sales figures signal the state of the economy in both countries. Positive economic data from the US usually leads to a stronger US dollar, while negative data tends to weaken its value.
Geopolitical risks. Political instability, trade wars, and international conflicts can be harmful to the USDJPY exchange rate. During periods of uncertainty, investors often seek safety in more stable currencies, such as the Japanese yen, which causes the USDJPY pair to weaken.
Monetary policy. The decisions made by the US Fed and the Bank of Japan, including measures like monetary policy easing or tightening, significantly influence the USDJPY exchange rate.
Balance of trade. The difference between exports and imports of the US and Japan can also affect the USDJPY exchange rate. Countries with a large trade surplus usually have a stronger currency.
Market sentiment. General market sentiment and risk appetite can also influence the USDJPY exchange rate. During periods of optimism, investors tend to take risks and buy the US dollar, while during pessimistic periods, they prefer safer assets such as the Japanese yen.
More Facts About USDJPY
The USDJPY pair represents the value of the US dollar in relation to the Japanese yen and is among the most traded currency pairs globally, known for its high liquidity and volatility.
As a barometer of global market sentiment, the USDJPY pair reflects investor confidence. Typically, when investors are confident, they tend to buy the US dollar, leading to an increase in the pair's value. Conversely, when investors are apprehensive, they turn to the Japanese yen, causing the USDJPY pair to fall.
Notably, the USDJPY is a complex currency pair that is influenced by many factors. Thus, traders need to carefully analyze all available data before making any decisions. Understanding the relationship between these factors is the key to successful trading in the USDJPY market.
Advantages and Disadvantages of Investing in USDJPY
Investing in the USDJPY currency pair, as with any other asset, comes with certain advantages and disadvantages. Therefore, it is crucial to carefully weigh the pros and cons before making an investment decision.
Advantages
High liquidity. The USDJPY pair is one of the most traded currency pairs in the world, which ensures high liquidity and makes it easy to buy and sell currency at any time.
Volatility. The volatility of the USDJPY pair provides traders with opportunities to profit on both upward and downward movements.
Transparency. Data on factors affecting the USDJPY exchange rate is widely available, allowing traders to conduct fundamental and technical analyses.
Portfolio diversification. Investing in USDJPY can help diversify an investment portfolio and reduce overall risk.
Disadvantages
Heightened risk. The volatility of the USDJPY pair also means that investing in this currency pair involves a high risk of loss.
Influence of macroeconomic factors. The USDJPY exchange rate is influenced by many macroeconomic factors, such as interest rates, inflation, and geopolitical risks, which require traders to constantly monitor and analyze the market.
Requires knowledge and experience. Successful USDJPY trading demands in-depth knowledge of the currency market, as well as experience in technical and fundamental analyses.
Leverage risk. Using leverage can boost potential profits, but it can also increase potential losses.
Spread. The spread between the buy and sell price can reduce the profitability of short-term trades.
How We Make Forecasts
In order to forecast the USDJPY currency pair performance in the short and long term, it is essential to use a comprehensive approach that includes the following elements:
1. An in-depth fundamental analysis that involves:
analyzing expert forecasts from reputable analytical companies;
examining the US and Japanese economies, including economic growth rates, economic stability, GDP, interest rates, and inflation rates;
assessing current monetary policy, particularly monetary policy easing and tightening;
analyzing trade relations between the two countries, including the balance of exports and imports, existing trade agreements, and other relevant aspects;
studying geopolitical and macroeconomic risks that could affect the exchange rate.
2. Estimating prevailing market sentiment and public opinion expressed on social media and other platforms.
3. Technical analysis. The movement of currency pairs often follows certain cycles, and many factors are already factored into the current value. The price chart reflects not only statistical data but also the psychology of market participants. Technical analysis uses a wide range of methods and tools. The most effective and safe approach involves the complex use of candlestick analysis, chart patterns, and technical indicators. This method helps traders identify optimal moments to enter the market with minimal risk and determine potential profit-taking levels in advance.
Conclusion: Is USDJPY a Good Investment?
The answer to this question depends on an investor's time horizon and risk tolerance. USDJPY reflects the interaction between the world's two largest economies: the United States, with its relatively tight Federal Reserve policy, and Japan, which maintains some of the lowest interest rates in the world.
During the first half of 2026, the pair experienced exceptionally high volatility. Therefore, short-term traders should remain highly cautious and be prepared for sharp market moves. The Bank of Japan could also intervene in the foreign exchange market, potentially leading to a sharp decline in USDJPY.
USDJPY may be attractive to investors if the Japanese yen continues to weaken. However, the pair could also decline abruptly if the Bank of Japan makes a significant shift in its monetary policy. As a result, USDJPY may be better suited to short-term trading and hedging strategies than to long-term investment.
USDJPY Price Prediction FAQs
The currency pair is trading at ¥157.835 as of 03.08.2026.
According to long-term forecasts, USDJPY is expected to remain in an uptrend. The exchange rate could range from ¥196.35 to ¥265.46 over the next several years. More conservative forecasts suggest a more moderate rise, with USDJPY reaching ¥179.27 by the end of 2030.
According to consensus forecasts, USDJPY is expected to trade within a range of ¥167.00–¥175.35 in 2026. The pair could reach a high of ¥180.78, although periods of correction cannot be ruled out.
Forecasts suggest that the US dollar will maintain its long-term upward trend against the Japanese yen in 2027. USDJPY is expected to advance toward ¥190.74–¥201.71. However, some analysts believe the pair could trade closer to ¥165.00.
Most analysts expect USDJPY to move higher over the medium and long term. However, periods of decline remain possible, particularly if the Federal Reserve adopts a more accommodative monetary policy.
The outlook for the USDJPY pair is impacted by a range of factors, including the interest rates set by the US Fed and the Bank of Japan, inflation in both countries, geopolitical risks, the balance of trade, and the overall economic health of the US and Japan.
The economic backdrop has a direct impact on the USDJPY exchange rate. Federal Reserve and BOJ policy decisions, interest rate changes, and key economic indicators all help shape the pair's direction. For example, rate hikes in the US tend to strengthen the dollar. Global economic conditions can fuel market volatility.
USDJPY movements will be heavily influenced by Fed and BOJ rate decisions, inflation data, and GDP growth. Volatility may increase in response to geopolitical tensions, trade negotiations, and shifts in the global economy. Elections and market-moving political events deserve special attention.
Price chart of USDJPY in real time mode
The content of this article reflects the author’s opinion and does not necessarily reflect the official position of LiteFinance broker. The material published on this page is provided for informational purposes only and should not be considered as the provision of investment advice for the purposes of Directive 2014/65/EU.
According to copyright law, this article is considered intellectual property, which includes a prohibition on copying and distributing it without consent.