Peculiarities of the trading strategy
Trend is your friend, trade with the trend. It seems, traders must have taken in this principle with their mothers’ milk, but in practice, many forget about it. They try to catch a falling knife, look for reversals, exploit counter-trend trading patterns. Not because they wish to earn money as soon as possible. The thing is, the process of identifying an existing trend is complicated enough. Even a trader who uses such tools of fundamental analysis as economic cycles and divergence/convergence in central banks’ monetary policy won’t always determine correctly a medium- and long-term direction of prices. Force majeure circumstances (the eccentric president of the USA, trade wars, Brexit, and so on) may interfere with the process.
Technical analysis provides specific approaches to identifying a predominant market trend. Visually, a bullish trend is understood as a sequence of rising maximums while a bearish trend - as a sequence of lowering minimums. However, it’s quite a rare situation at Forex when assets just rise and fall. That’s why traders also consider a deviation of quotes from average values. Simple, weighted, or exponential moving averages or their combinations are used here. There’s another method: closing prices tend upwards with the bullish trend and downwards with the bearish trend. Comparing a previous and a current price range, we can identify a trend. It’s a responsibility of the stochastic indicator.
So, not only can a trader who uses the combination of the EMA and %D make sure that this or that trend is present, he or she can also identify “problem” moments in a chart, when a divergence between dynamics of these two indicators makes a signal about an upcoming consolidation or reversal. For instance, the stochastic has signalled a change of the uptrend in the daily chart of USD/JPY since as early as mid-April.
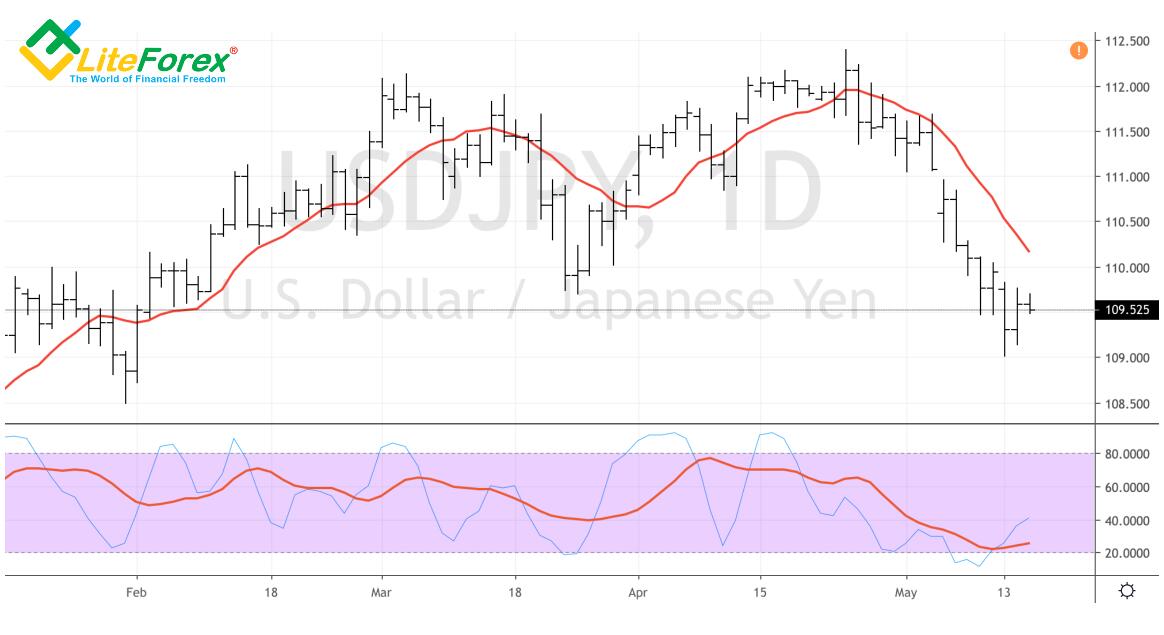
Identifying the trend in USD/JPY daily chart
In technical analysis, oscillators are normally used for detecting short-term reversals. Thus, the stochastic indicator leaving the oversold zone may be considered to be a signal about a forthcoming price growth. In fact, it’s a delayed signal. The divergence of fast and slow lines is another thing. If %D indicates the presence of the bearish trend, % K falls with the slow line, and then starts approaching it (growing), it’s wise to place a pending order to sell below the minimum of a current bar. The exhaustion of a correction movement will allow %К to restore simultaneous dynamics with %D and a trader will be able to enter a trade with the trend.
Work under trend recovery in USD/JPY daily chart
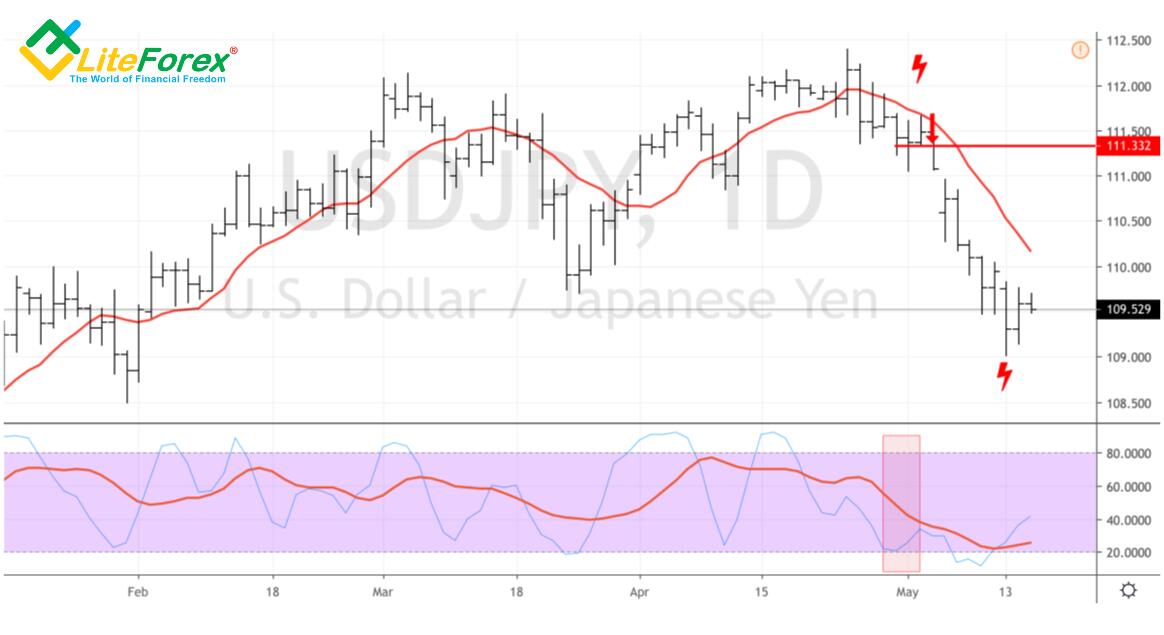
A protective stop order shall be placed at the highest of a current price fluctuation and then trailed downwards as quotes of a currency pair fall at Forex. Linda Raschke, the author of the best-seller “Street Smarts: High Probability Short-Term Trading Strategies”, calls this trading strategy “Anti” and recommends setting the slow (%D) and the fast (%K) lines of the stochastic indicator at 10 and 7, respectively. The absence of their intersection isn’t a mandatory condition in the framework of this strategy. The main thing is a divergence of the lines with a subsequent return.
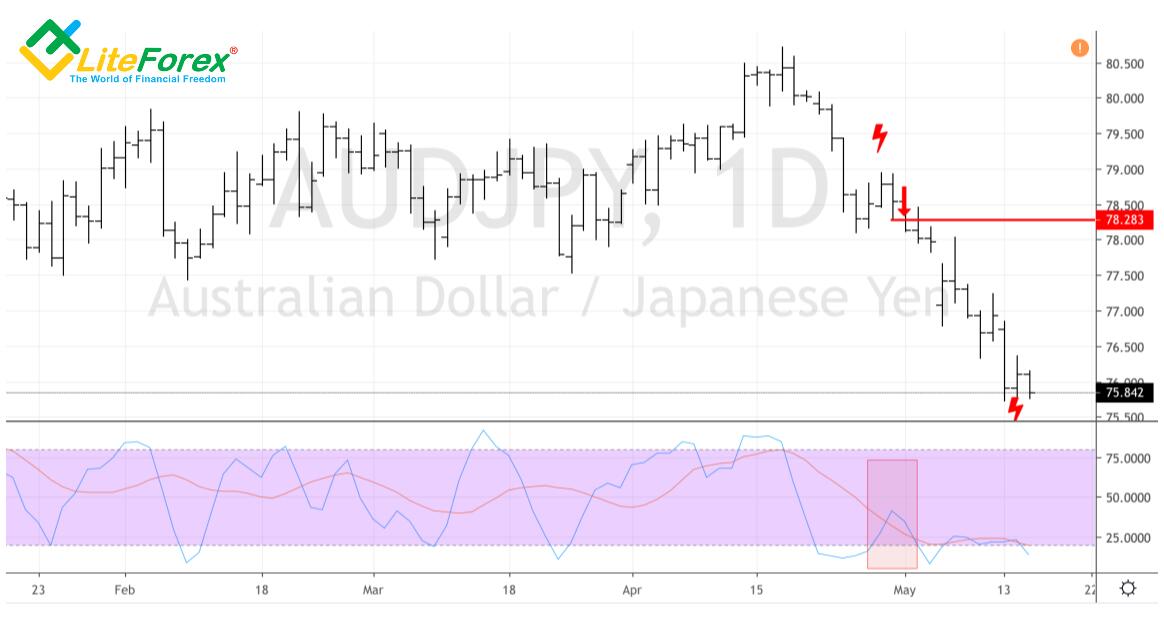
Something like that took place in the daily chart of AUD/JPY. %D and %K had been moving in the same direction since mid-April, but then had gone their separate ways by the end of the second month of spring. The reversal of the fast line was the reason for opening a short position using a pending order placed at the lowest of the previous bar.
“Anti” strategy in AUD/JPY daily chart
So, not only will indicators help a trader determine the trend, they will also point at exhaustion of a correction movement, which will allow opening a trade.
P.S. Did you like my article? Share it in social networks: it will be the best "thank you" :)
Useful links:
- I recommend trying to trade with a reliable broker here. The system allows you to trade by yourself or copy successful traders from all across the globe.
- Use my promo code BLOG to get a 50% deposit bonus on the LiteFinance platform. Simply enter this code in the appropriate field when funding your trading account.
- Telegram chat for traders: https://t.me/litefinancebrokerchat. We are sharing the signals and trading experience.
- Telegram channel with high-quality analytics, Forex reviews, training articles, and other useful things for traders https://t.me/litefinance
Price chart of USDJPY in real time mode

The content of this article reflects the author’s opinion and does not necessarily reflect the official position of LiteFinance broker. The material published on this page is provided for informational purposes only and should not be considered as the provision of investment advice for the purposes of Directive 2014/65/EU.
According to copyright law, this article is considered intellectual property, which includes a prohibition on copying and distributing it without consent.