The trader's success can be assessed by many parameters: profitable trades, account balance, or total deposit. However, I think the trader's professionalism is determined by one very important indicator — the ability to calculate and analyze statistical measure.
The article covers the following subjects:
- Major takeaways
- What is currency pairs correlation?
- Theory and examples of Forex currency correlation
- What can a currency correlate with?
- How to calculate currency correlation?
- Forex correlation calculator
- Forex correlation trading strategies
- Currency correlation indicator MT4
- Forex hedging strategy based on the currency correlation
- Forex quasi-arbitrage
- Using the correlation between major currencies
- Conclusion: how to use forex correlation pairs
- FAQ's
Major takeaways
| Main Thesis | Insights and Key Points |
|---|---|
| Definition: | Forex correlations mean one trading asset's ability to repeat another's directional movements. Positive correlation means pairs move in the same direction, while negative means they move in opposite directions. |
| What can a currency correlate with? | Currencies can correlate with other currencies, indices, and commodity assets. For instance, the US dollar correlates with the S&P 500 index, and the Canadian dollar has a strong forex correlation with oil. |
| How to calculate: | The strength of correlation is measured in percent. Traders use the Pearson formula to determine this value, considering price values of two assets. |
| Calculator: | Special calculators exist online to determine forex correlation between currency pairs. These calculators show both positive and negative correlations, indicating the strength of the relationship. |
| Trading strategies: | Correlation can be used in strategies to predict the movement of one currency pair based on another's movement. Using movement discrepancies or inverse forex correlation, traders can profit from the restoration of correlation. |
| MT4 and MT5: | There are currency correlation indicators for MT4 and MT5 platforms, like OverLay Chart Correlation MT4 and Netsrac Correlation MT5 Trade Indicator, which help determine forex correlation between currencies. |
| Forex hedging strategy: | Trading with forex correlation pairs requires attention to other pairs whose quoted currency matches your instrument. This method helps filter out false signals and increases the chances of successful trades. |
| Major currencies: | Major currency pairs have a greater degree of forex correlation among themselves than minor ones. Knowing this can help traders predict movements and make informed decisions. |
The understanding that currency pairs are interconnected, as well as the ability to find this connection and use it, will provide reliable protection for your deposit and get a sustainable income in the Forex market.
What is currency pairs correlation?
The Forex market is a system of interconnected elements. Change in some leads to the reaction of others and vice versa.
This gigantic machine lives by its own laws. If you know them, you can predict the movement of currency quotes and earn money on the fluctuation in the exchange rate. The phenomenon of currency correlations reflects the linear relationship of the currency pairs and the synchronism of this process.
The correlation value shows how similarly two specific currency pairs fluctuate. The higher the correlation coefficients, the more synchronous the changes. Such currency pairs move together as if in unison. There are also negative forex correlations reflecting the movement of quotations in opposite directions.
Forex correlations mean the ability of one trading asset to repeat the directional movements of another instrument.
We can see commodity correlations in the financial markets with gold and silver or various grades of oil and its refined products.
Theory and examples of Forex currency correlation
Forex correlations are a phenomenon that occurs when the price movements of several currency pairs are similar. There are two types of correlations: positive and negative
A positive correlation means a correlation in which price movements of currency pairs change in the same direction. The charts of 2 similar instruments have the same direction (for example, in both cases, the trend is up).
A negative correlation meansa correlation in which price movements of currency pairs change in different directions. That is, the uptrend of one instrument is a “mirror reflection” of the chart of the second instrument, which is directed downward.
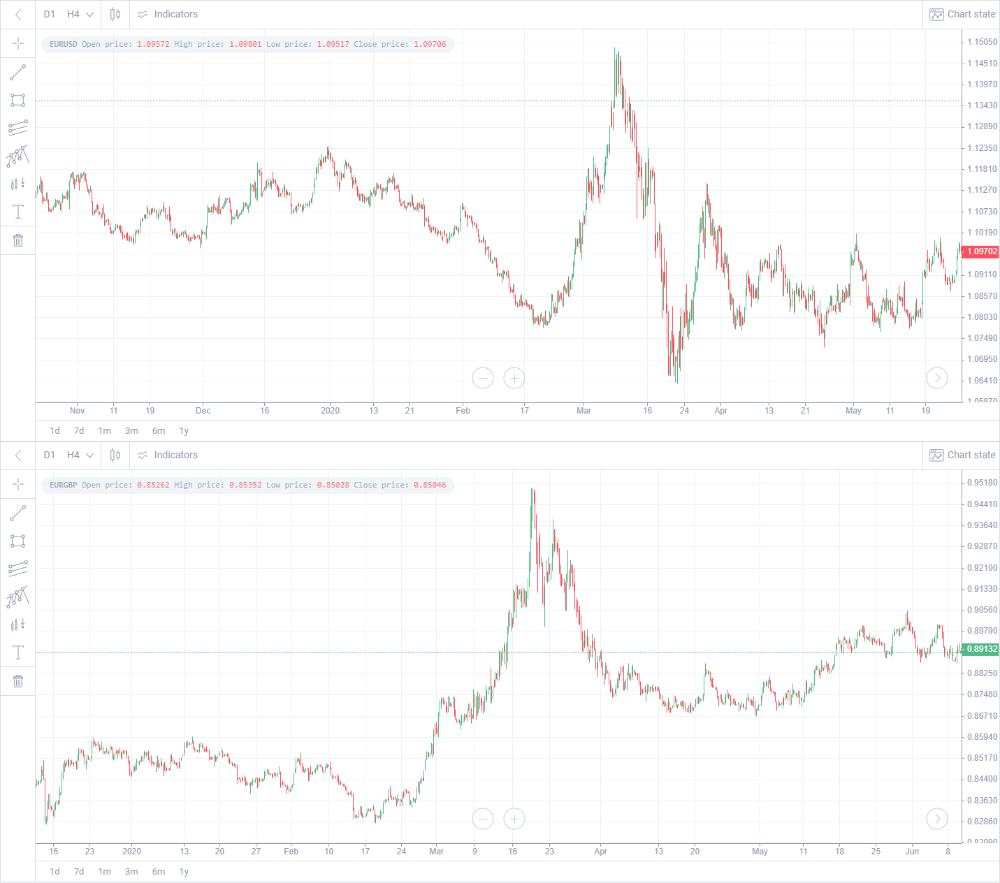
An example of a positive correlation (direct correlation) is a situation in which the expectations of traders are similar, as in the case of the EUR/USD and the EUR/GBP. We can see that the forex pair correlation charts coincide:
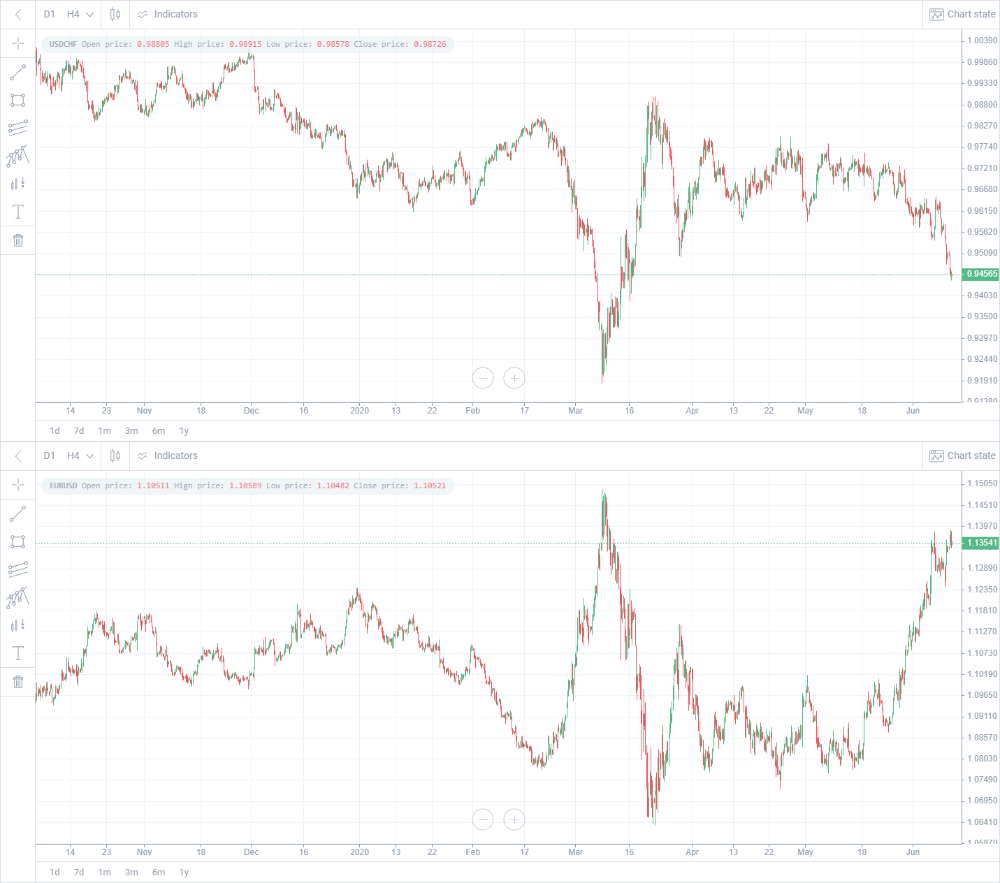
An example of a negative correlation (inverse correlation) is a situation in which the expectations of traders are opposite, as is the case with the EUR/USD and the USD/CHF. In this figure, we can observe a mirror image of currency pairs:
The strength of the correlation is measured in percent (or fractions): 100% (or 1) is the highest degree of correlation between the two assets.
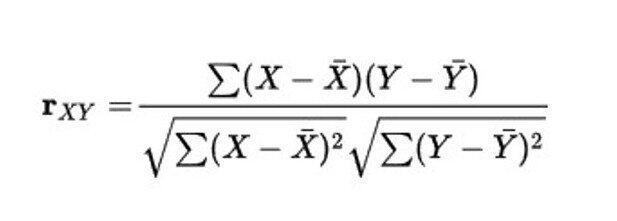
To determine this value, traders use the Pearson formula. First, they select a certain set of price values of two assets — X and Y. Then they determine the average values of X and Y on it, add the product of the deviations of each value of the set from its average, and divide them by the product of the standard deviation.
For two instruments with prices X and Y, the correlation coefficient formula is as follows:
In the Forex market, the correlation of currencies was determined at the stage of its formation, when instead of using the “gold standard”, national currency rates were tied to the US dollar.
It is believed that major currency pairs have a greater degree of correlation among themselves than minor ones.
What can a currency correlate with?
- With other currencies. Currencies can correlate with each other, as in our example. We will observe the correlation of two currency pairs, which include one common quoted currency.
- With indices. This should be clear too. Changes in indices, or index CFDs, lead to changes in a particular currency. For example, we can recall that the US dollar correlates well with the S&P 500 index.
- With commodity assets. Commodity assets include everything that countries export and import. These are oil, gold, coal, aluminum, etc. You have probably deduced that there is a strong correlation between the Canadian dollar and oil. A correlation is also observed between the Australian dollar and gold. Very often, trading commodities means trading CFDs rather than physical assets.
How to calculate currency correlation?
There are special calculators where you can select currency pairs and calculate the correlation between them. This is just a couple of mouse clicks in the browser. Thankfully you don't have to calculate it manually using the complex formula that I gave above. The currency pair correlation calculator will show the value of positive and negative correlation.
A positive correlation is shown with a “+” sign, or with no sign at all.
A negative correlation is shown with a "-" sign.
Note that there is a strong and weak correlation. The stronger the correlation, the more similar the price movements of the two instruments. The weaker the correlation, the less similarity. The value of a strong positive correlation is closer to "1", and such pairs move in the same direction. Or, respectively, to "-1" for perfect negative correlation, when assets move in the opposite direction. The non-correlated forex pairs are closer to "0".
Forex correlation calculator
The currency pair correlation calculator will show the value of positive and negative correlation. Calculate forex majors, minors, and cross currency pairs correlation here:
You can find many websites that calculate the forex pairs correlation table. However, there are practically no trading tactics or investment research based on correlation.
Forex correlation trading strategies
The correlation of currencies through the US dollar can be used in two types of strategies to trade forex:
- After finding two currency pairs that correlate, one of them is used to track signals that can indicate the direction of future movement in the second pair.
- Using movement discrepancies (inverse correlation), traders sell one pair and buy another at the same time, or use cross-rate currency correlations. In this case, the number of points by which the two assets have diverged becomes the trader's profit when their movement coincides again, and the correlation is restored. In some ways, it is similar to spread bets.
Example No. 1
Let's look at an example of such currency pairs like EUR/JPY (Euro and Japanese Yen) and AUD/JPY (Australian Dollar and Japanese Yen). In both cases, the quoted currency is the Japanese yen. Its strengthening on the market (price increase) will lead to the euro and the Australian dollar moving in the same direction synchronously. So there is a positive correlation between the euro and the Australian dollar. Often, closely tied economies have positively correlated currencies.
How to benefit from currency correlation
Typically, correlation is used to confirm the correctness of the analysis. You can observe the behavior of a particular currency pair and, based on it, draw a conclusion regarding the currency pair correlating with it. The more trades move in the same direction, the higher the likelihood of establishing a new trend, which means that the chances of a successful trade Forex also increase. This way, you get additional confidence regarding simultaneous trades.
Depending on your risk appetite and rules of risk management, currency correlations can double both the profit and the loss on retail investor accounts. Let's consider an example of a positive correlation. For example, you risk 5% of your deposit and open trades in the positively correlating pairs EUR/USD and EUR/GPB. In this case, the total risk for these two trades will not be 5%, but rather 10%. However, the amount of profit will also double.
Forex currency correlation strategy
Trading with Forex correlation pairs is pretty straightforward. Depending on which currency pair you are trading, pay attention to other currency pairs whose quoted currency is the quoted currency of your financial instrument. You will need to carefully examine the price charts of two currency pairs correlating with each other. If you clearly see that the exchange rates will fall in one of them, do not buy the currency correlating with this pair. Using this method, you can reliably filter out false signals.
Example No. 2
Let's suppose your traded currency pair is the GBP/USD (British Pound and American Dollar). The US dollar is a special currency, as it affects the exchange rate of many world currencies. In this case, it would be reasonable to pay attention to the price chart of the EUR/USD pair (euro and US dollar) before making trading decisions. Also, do not forget about the news. Although you are trading in the pound, important data on the European currency can have a great effect on the British pound, as these two currencies have a high correlation. This will be the true manifestation of currency correlations. Always pay attention to what happens with currencies that correlate with your trading instrument — this is the essence of trading with Forex correlation pairs.
Currency correlation indicator MT4
If you seek advice on trading correlations, there are many currency correlations indicators for MT4 and MT5. For example, OverLay Chart Correlation MT4 will help you determine if there is a correlation between currencies or other instruments. Netsrac Correlation MT5 Trade Indicator (NCTI) is also popular. Both complex instruments can be downloaded free of charge from the official MetaTrader website. Links are attached.
However, there are no indicators and advisers in common platforms that can distribute roles between correlating pairs.
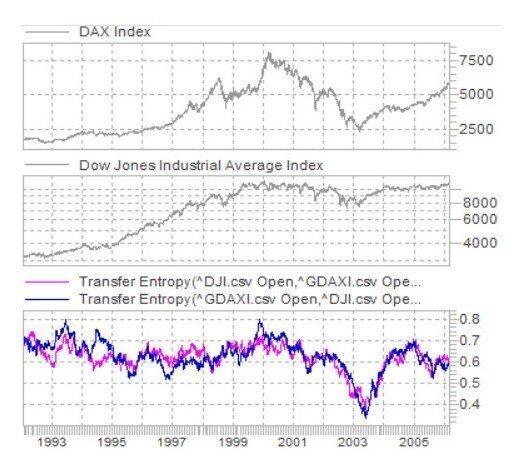
Trading uses a non-linear approach, where the price flow is presented as a “statistical measure of information”. In this case, when using entropy, we get indicators, complex instruments, which allow one to understand which signals of the two assets are leading:
Set up of indicator package for currency correlation analysis Forex
You can carry out a thorough correlation analysis yourself. You can download a full package of correlation indicators for MT4 here.
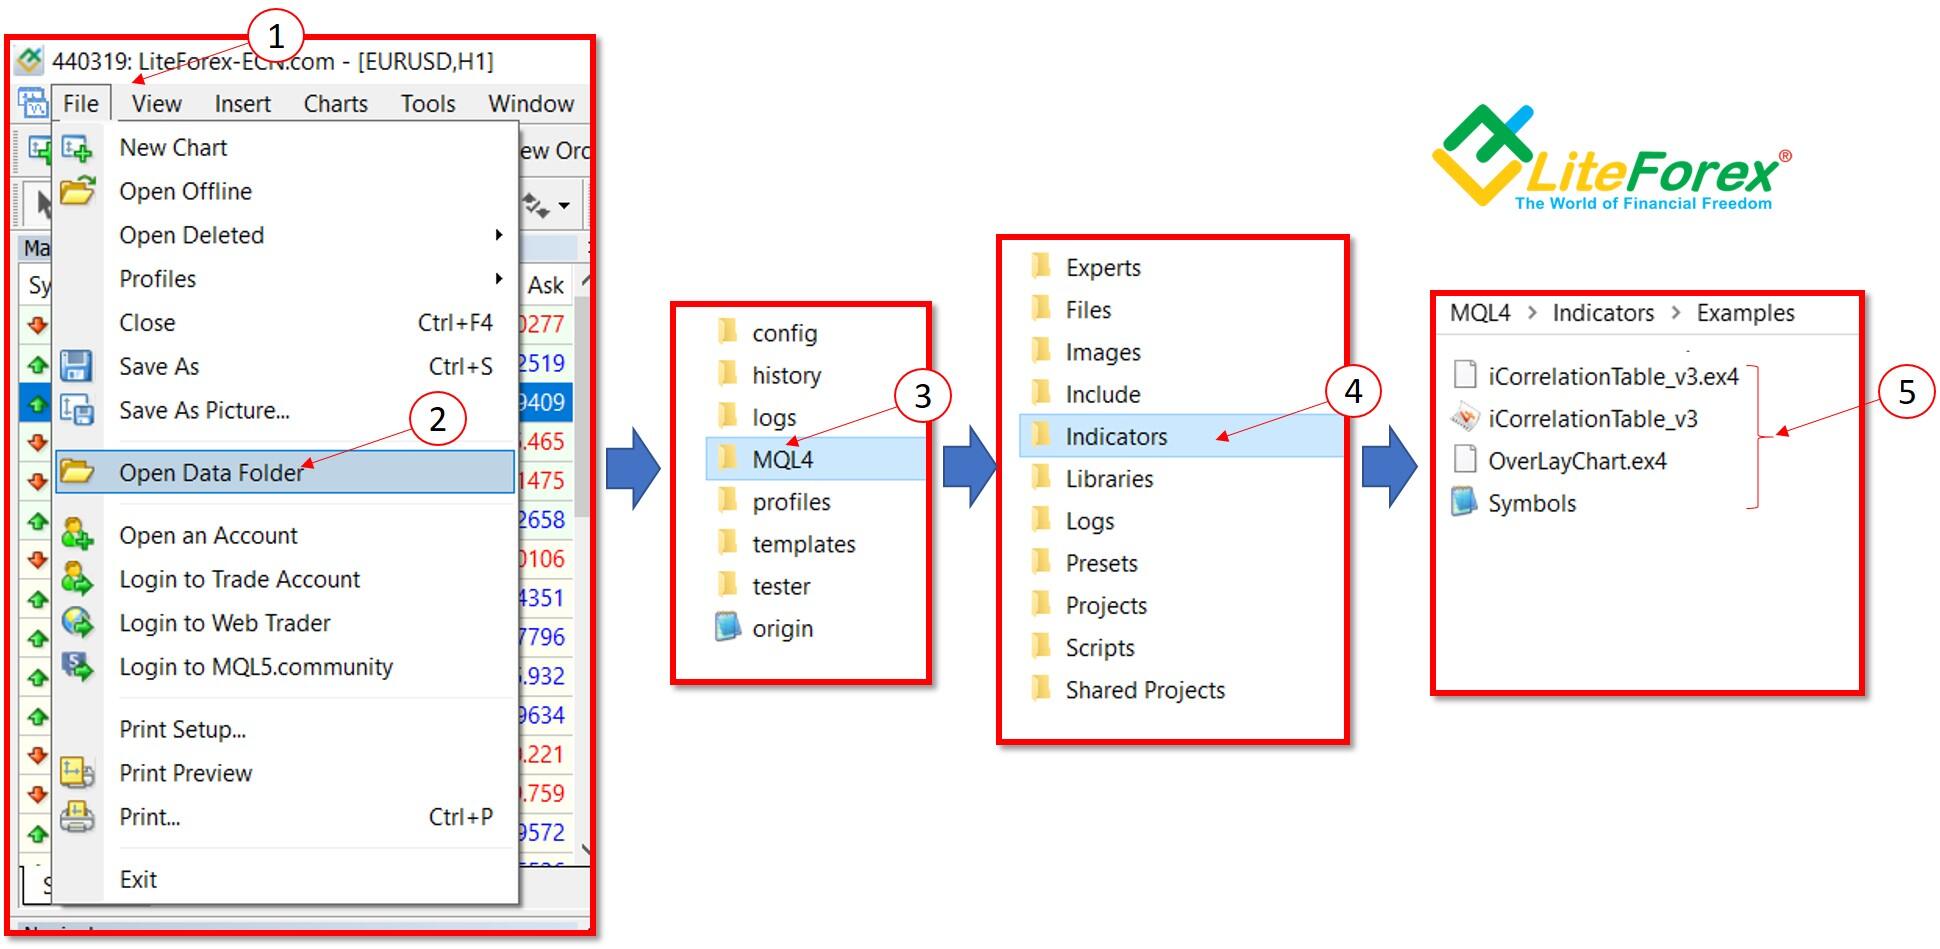
5 steps to install a currency correlations indicator (displayed in the above figures):
- In the main menu of the MT4 terminal, click on the “File” section.
- Left-click on the “Open Data Folder” button.
- In the window that opens, go to the “MQL4” folder.
- Go to the "Indicators" folder.
- In the directory that opens, I recommend opening the Examples folder and loading the files from the indicators archive.
When you complete these steps, switch off and start the terminal again.
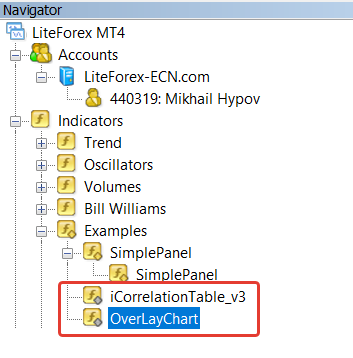
If you have done everything correctly, you should see something like that displayed in the figure above. Open the “Examples” tab in the “Indicators” data tree in the Navigator window and check.
Run and custom MT4 currency correlation indicators
Run iCorrelationTable_v3. You need to double-click on its icon in the Navigator window.
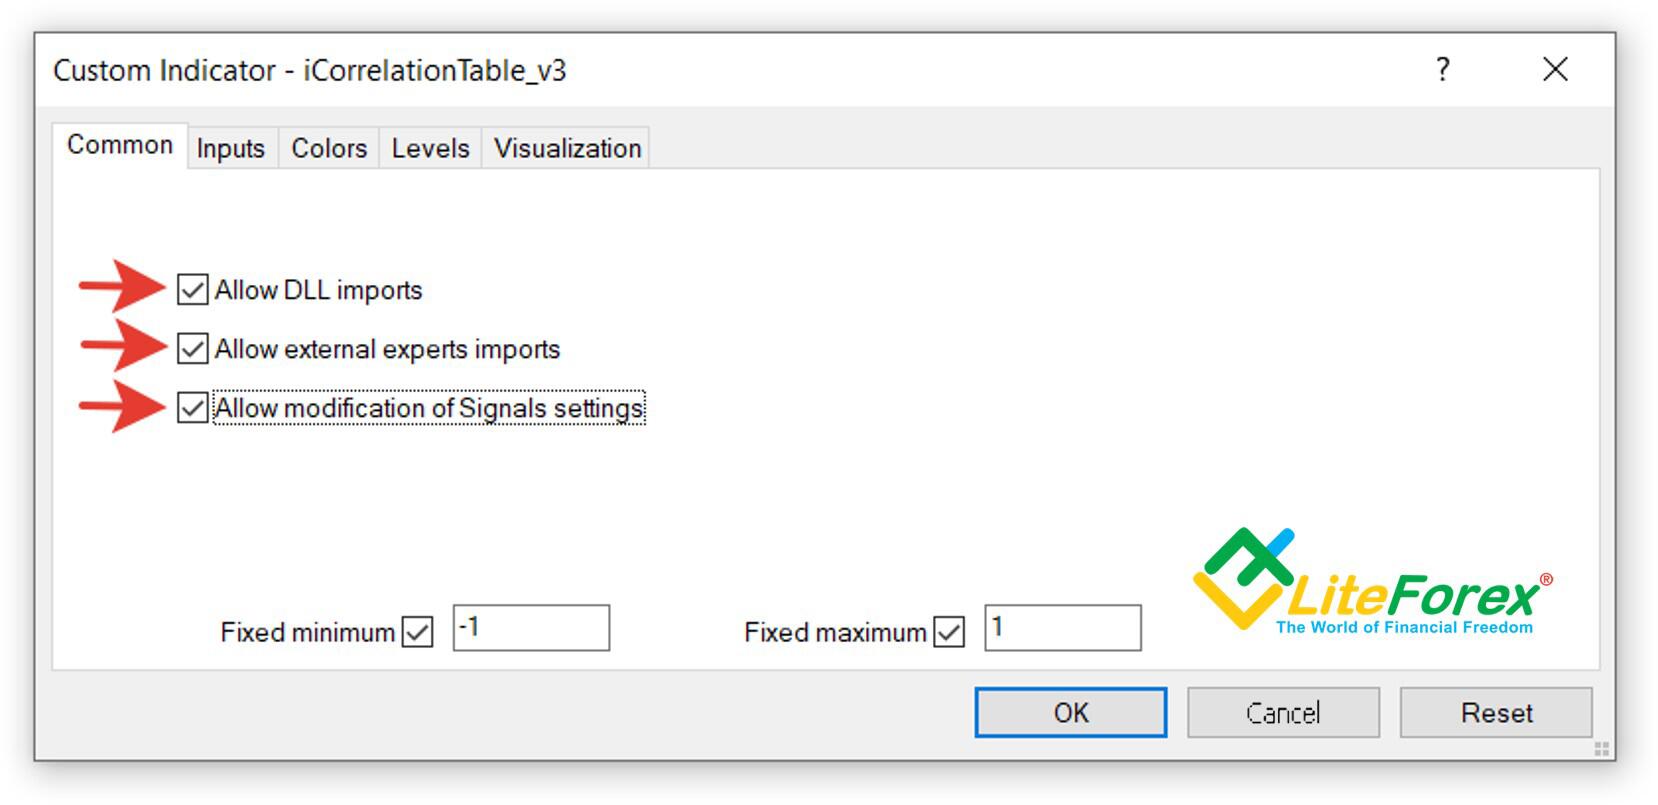
In the “Common” tab in the window that opens, tick all three blocks (see the figure above).
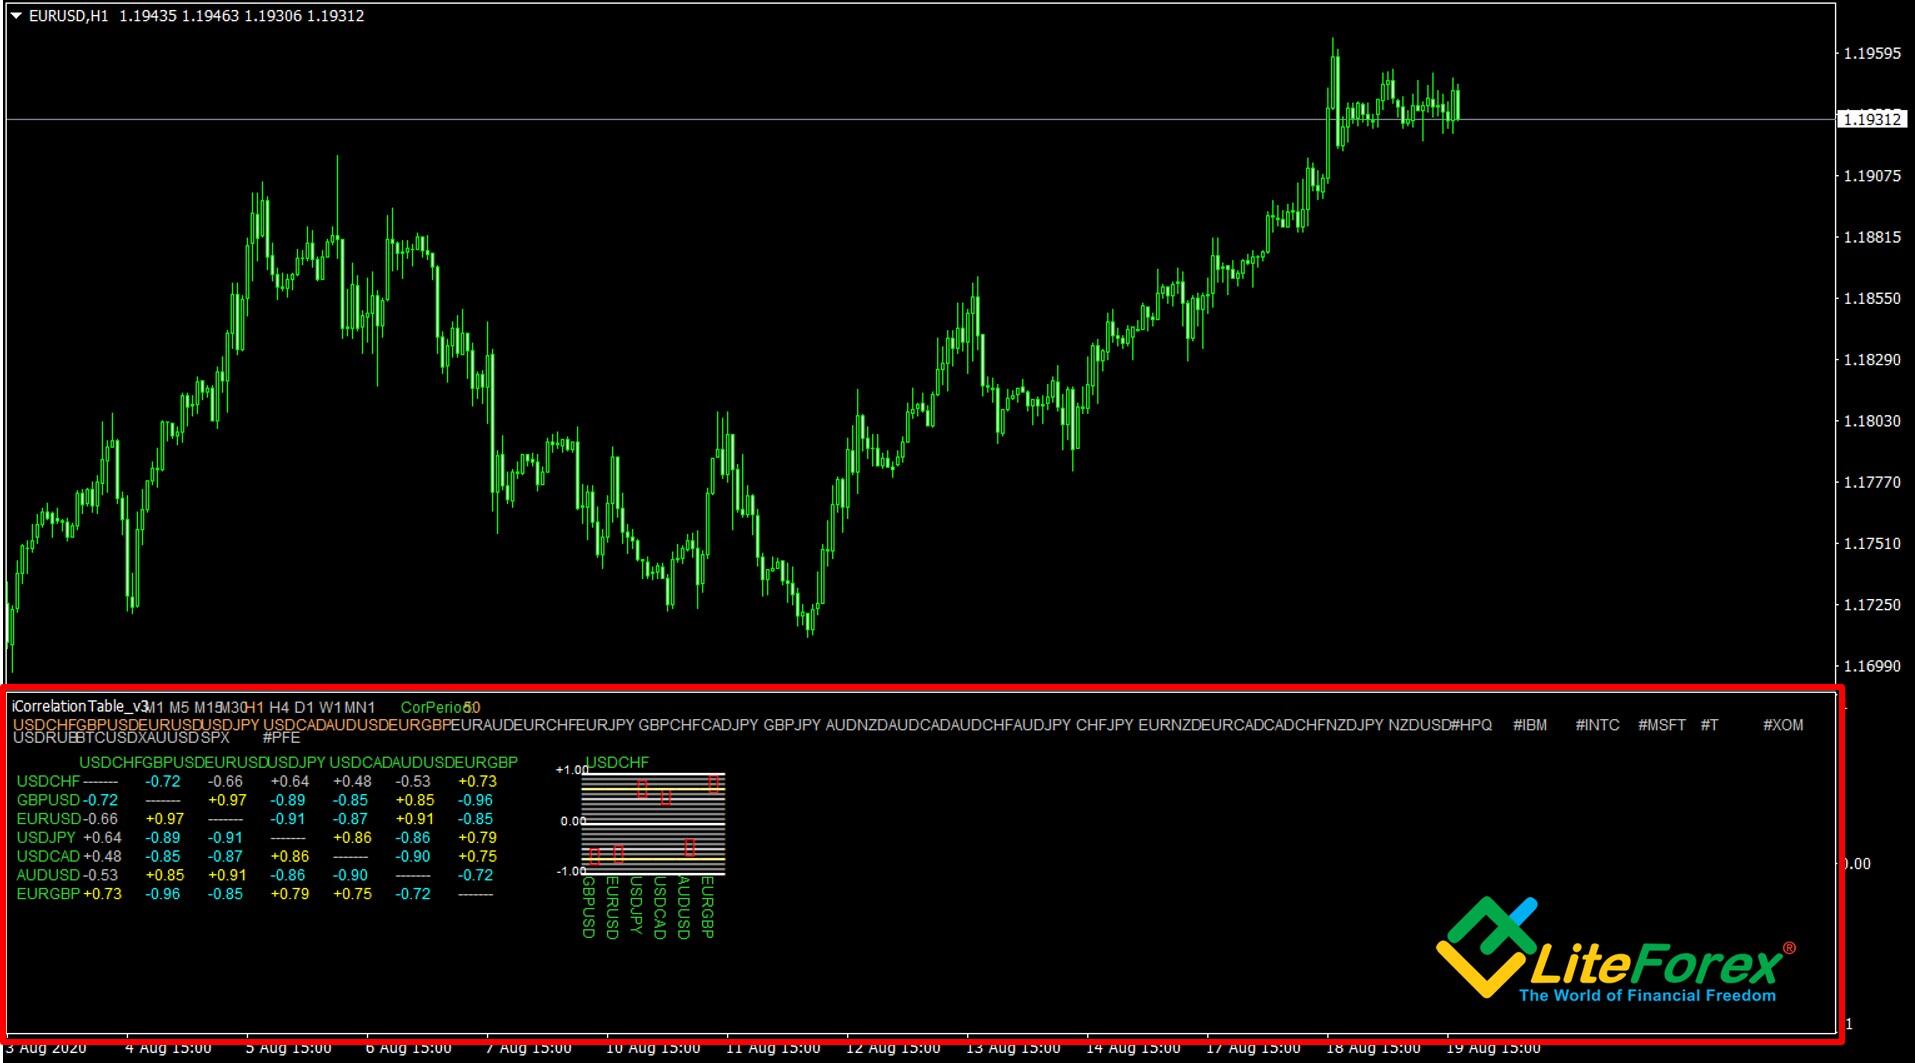
At the bottom of the chart, there will be a Forex correlation matrix. It analyzes the correlation for seven popular currencies in the period of 50 bars. The default settings are for the night mode. To make the information easier to read, set the chart to a colour scheme with a black background.
Make sure that the correlation table contains the currency trading instrument you need. The tool analyzes the first seven instruments in the “Market Watch". This tool can analyze any trading instrument’s correlation with any other six ones provided by your broker.
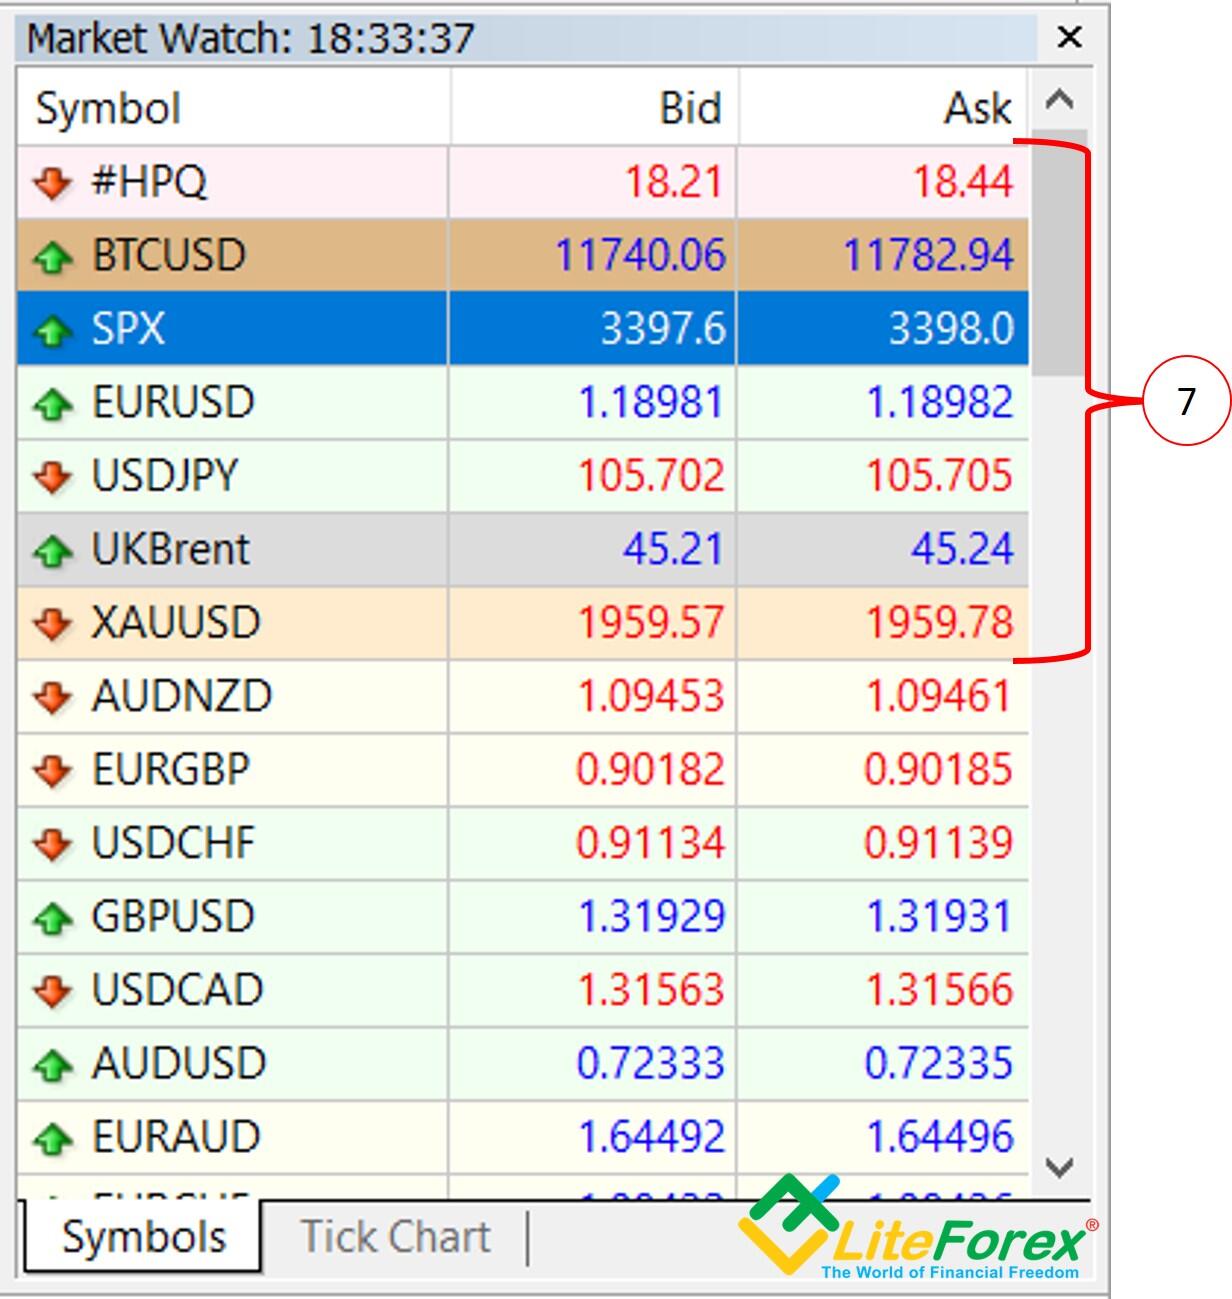
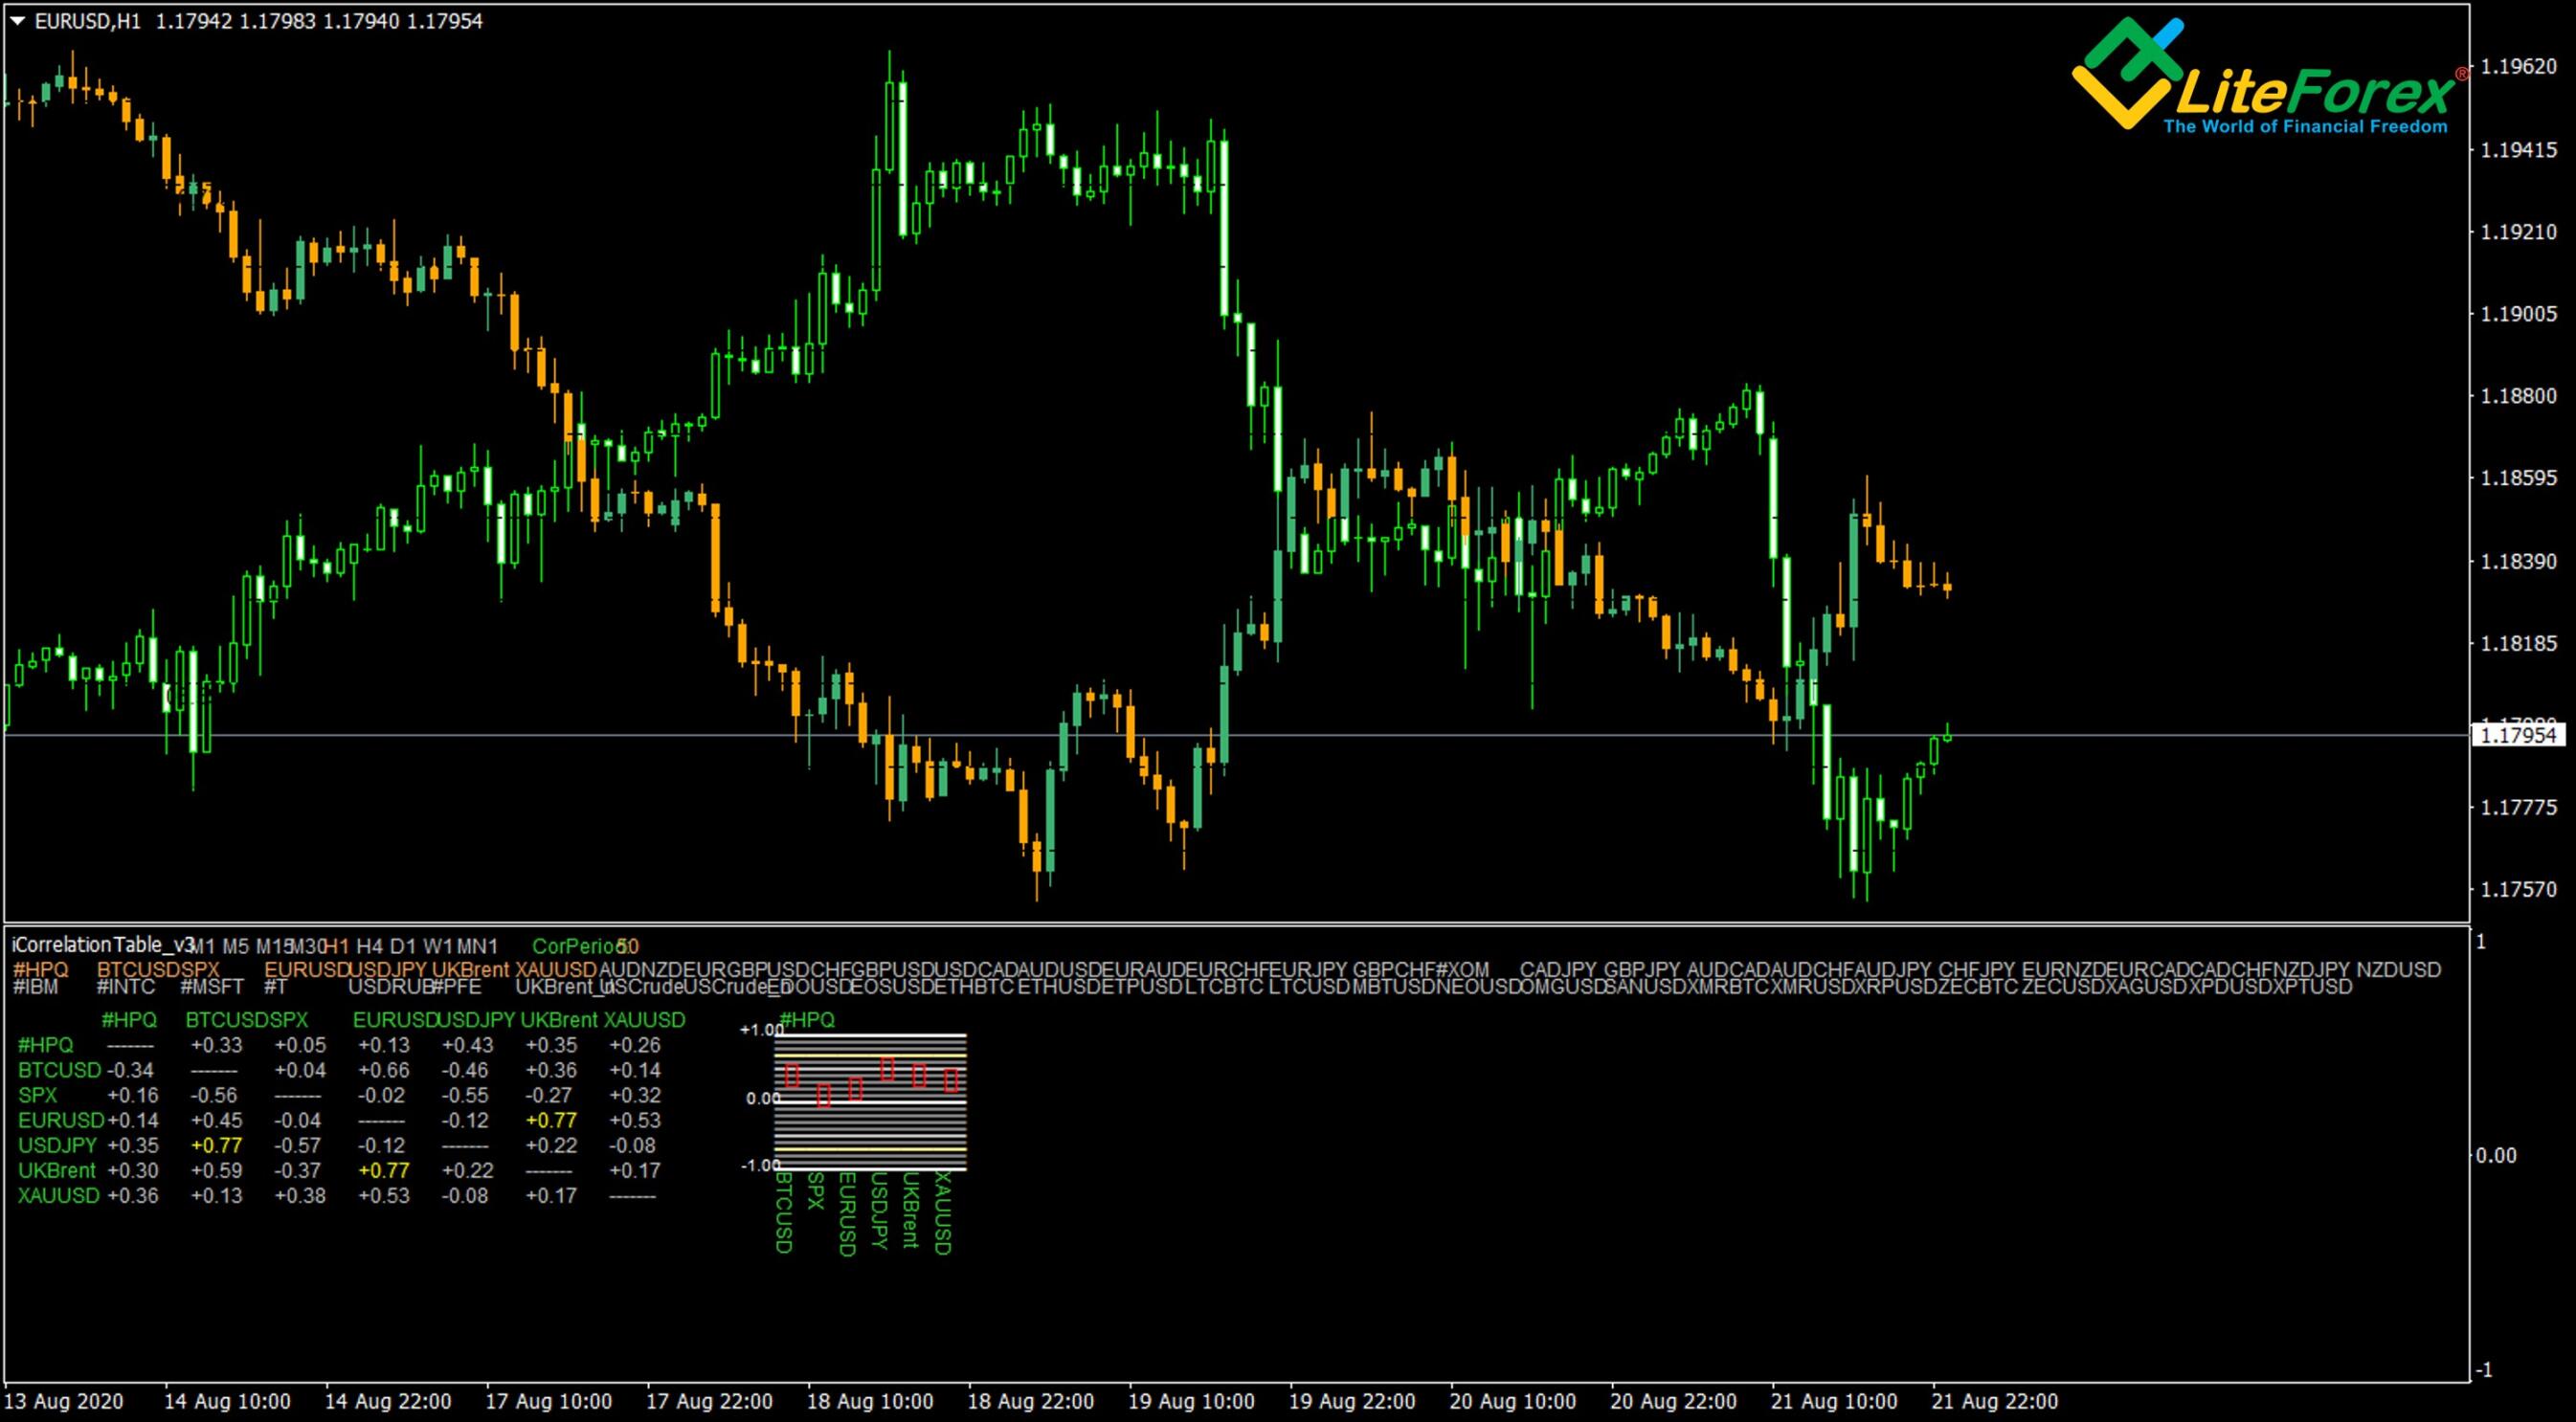
For example, I brought completely different trading instruments from LiteFinance to the top 7 lines. Hewlett Packard shares, Bitcoin, S&P 500 index, EURUSD and USDJPY pairs, Brent oil, and gold, ranked from first to seventh.
To start the analysis, select your working timeframe — the matrix updates when you switch between different timeframes.
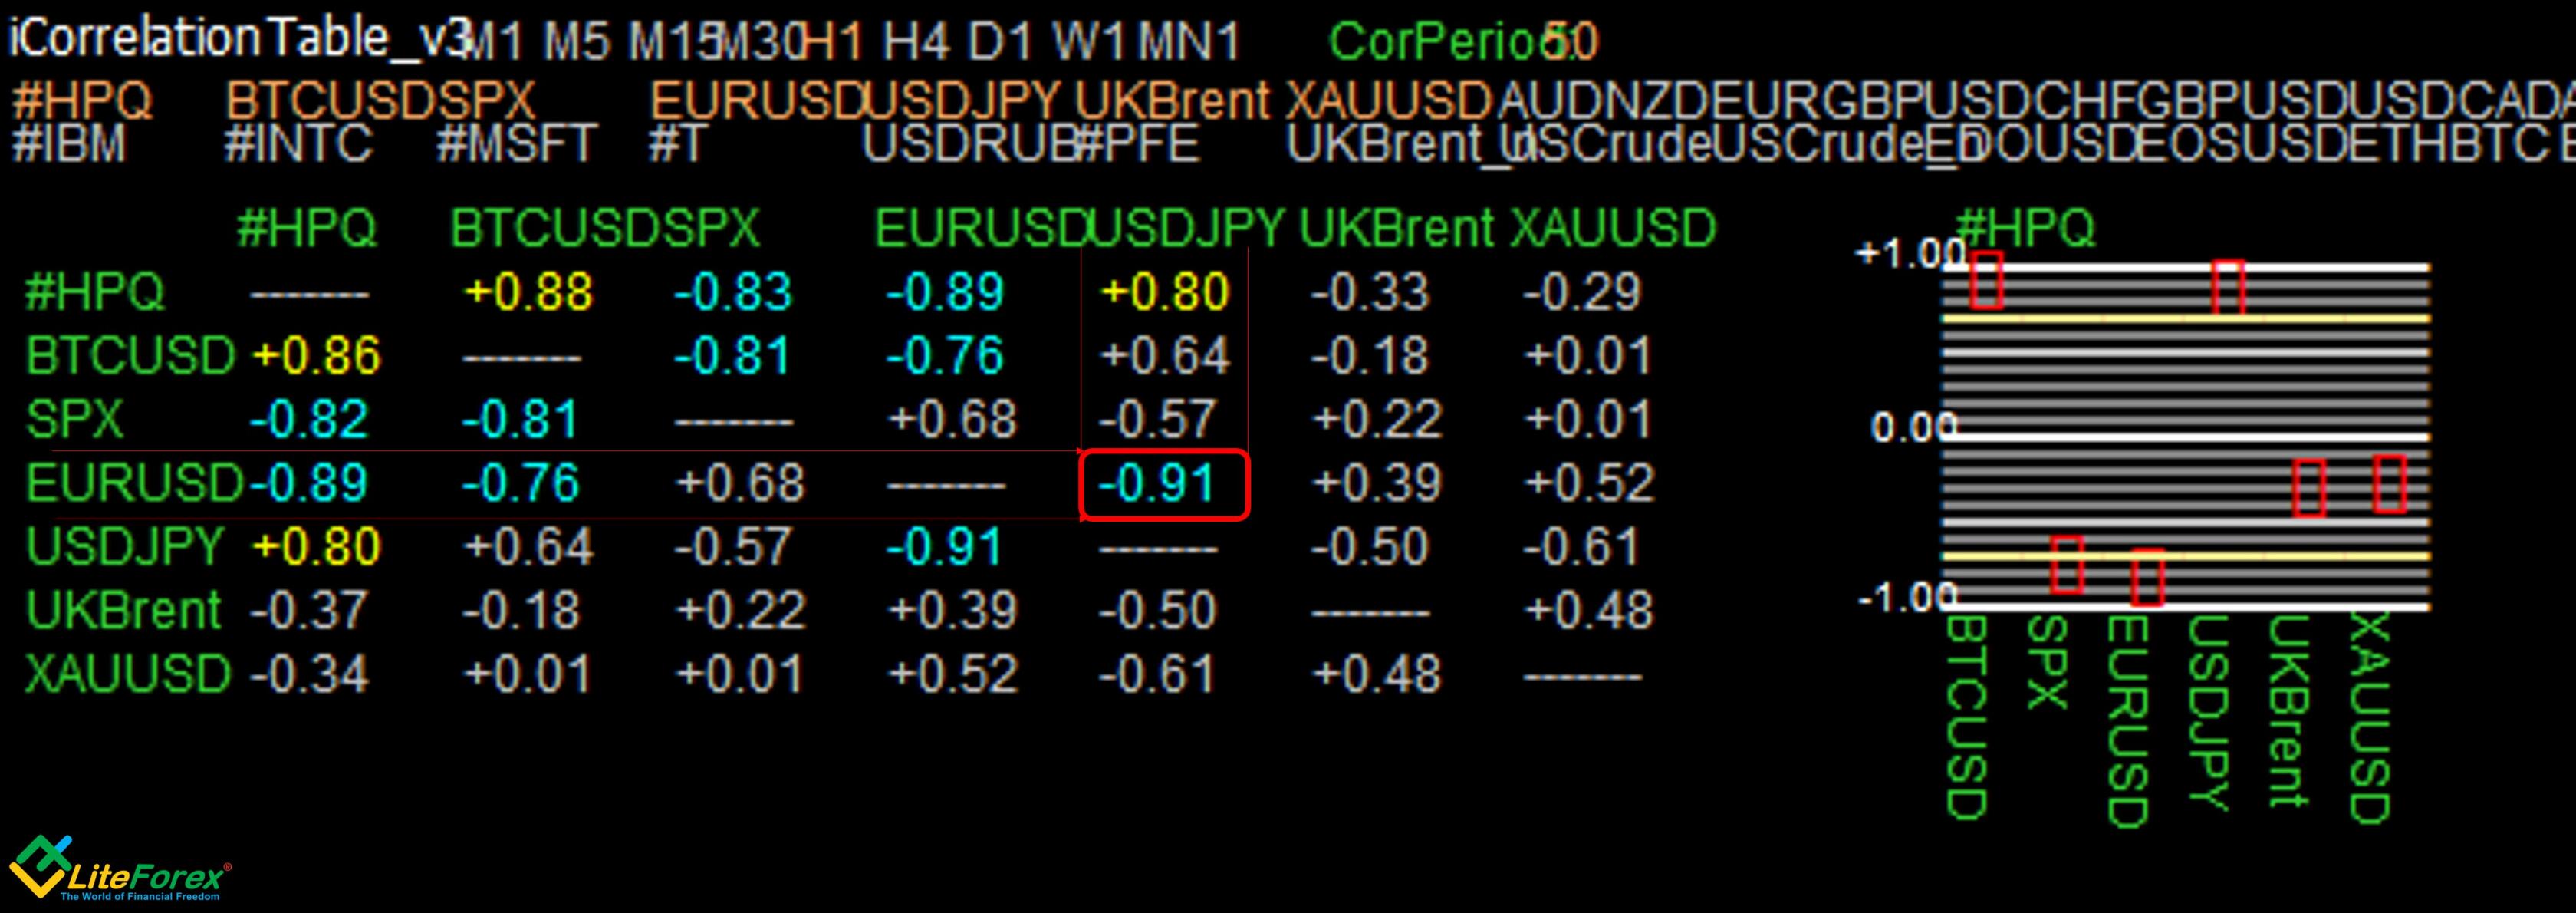
The above figure displays an updated correlation matrix, where the seven trading instruments listed above are compared. The correlation coefficient of more than 0.7 or less than -0.7 is significant, and so it is highlighted.
Pick up the instruments that have the biggest by the module correlation coefficient. In our case, they are EURUSD and USDJPY currency pairs with a correlation of -0.9. For technical analysis, we superimpose the price charts of these two trading assets.
Open the price chart of one of the two currency pairs and activate the OverLayChart that we pasted from the archive. So that the indicator works correctly, you need to allow access to the libraries in the common setting, just like in the case with the iCorrelationTable_v3 indicator.
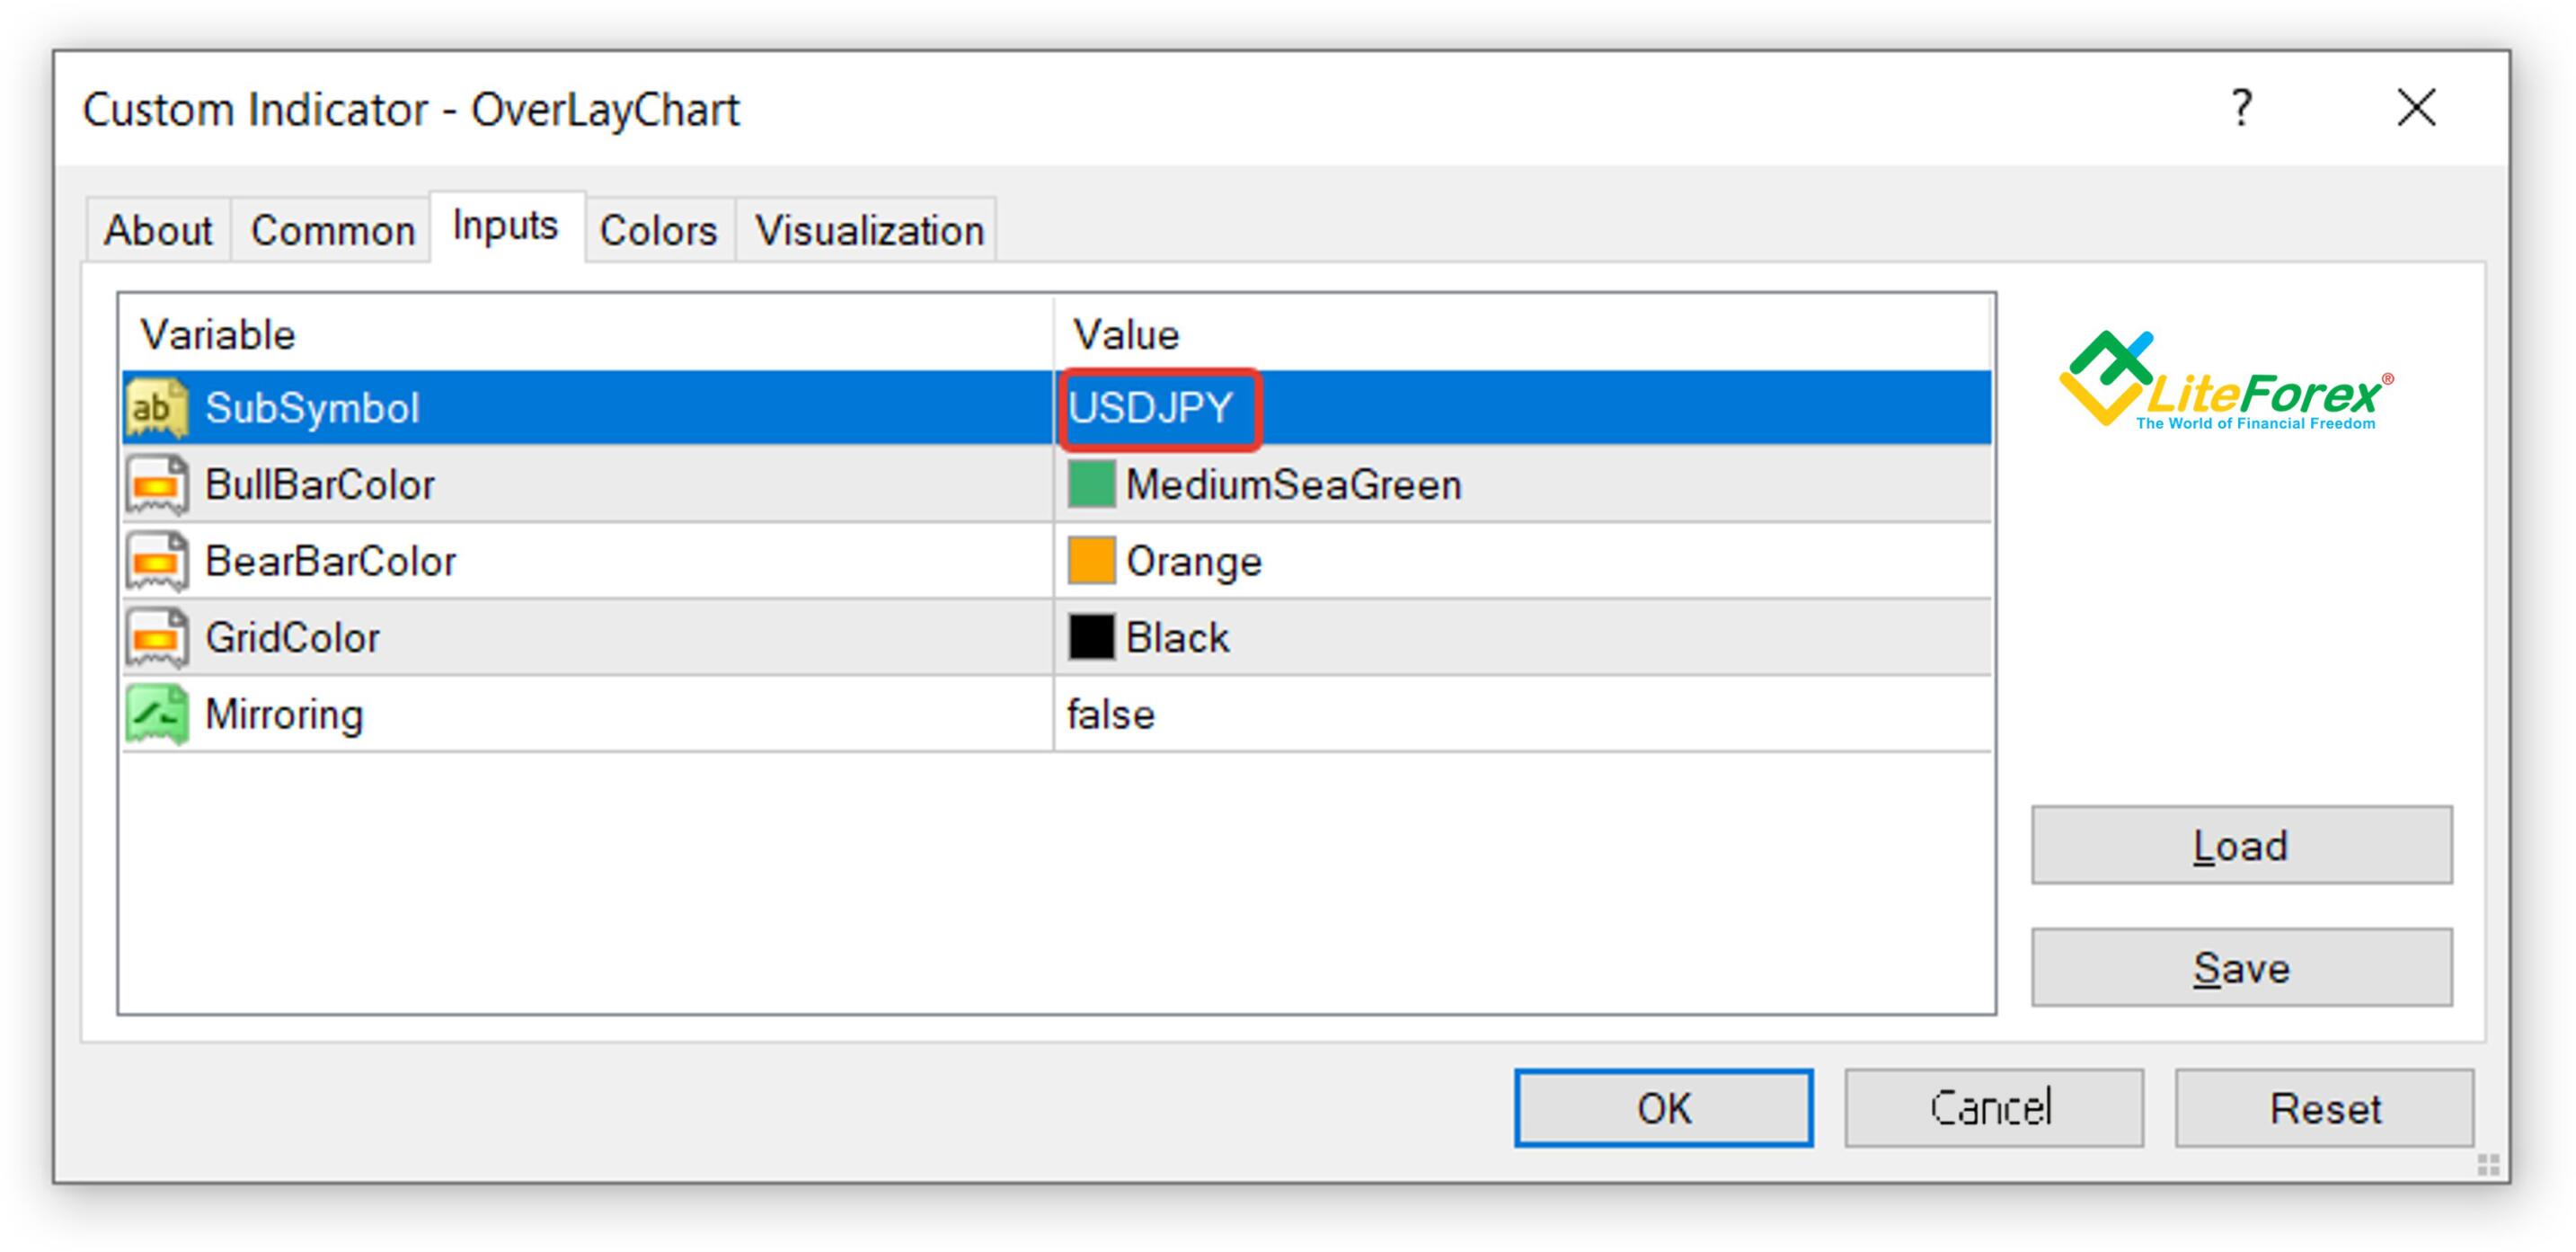
Next, we open the Inputs tab and type in the SubSymbol line the pair, whose chart we want to overlay on top of the chart displayed in the window, and click on the OK button.
If you have done everything correctly, you will see something like this on your screen. Now, we can apply a hedging strategy to forex trading.
Forex hedging strategy based on the currency correlation
What is the hedging and currency correlations trading strategy? In our case, it means cross-hedging. You can learn more in the article Hedging Forex: how to hedge Forex trades?
Professional Forex traders often use hedging strategies to reduce the high risk and make a good profit from the initial investment at the same time. Hedging is most commonly employed in forex trading, as there are always negatively correlated currency pairs, whose trends are progressing in sync, but the direction is opposite.
Important! To effectively use the hedging strategy in the foreign exchange market, we need to trade such instruments, whose correlation is close to 1 or -1.
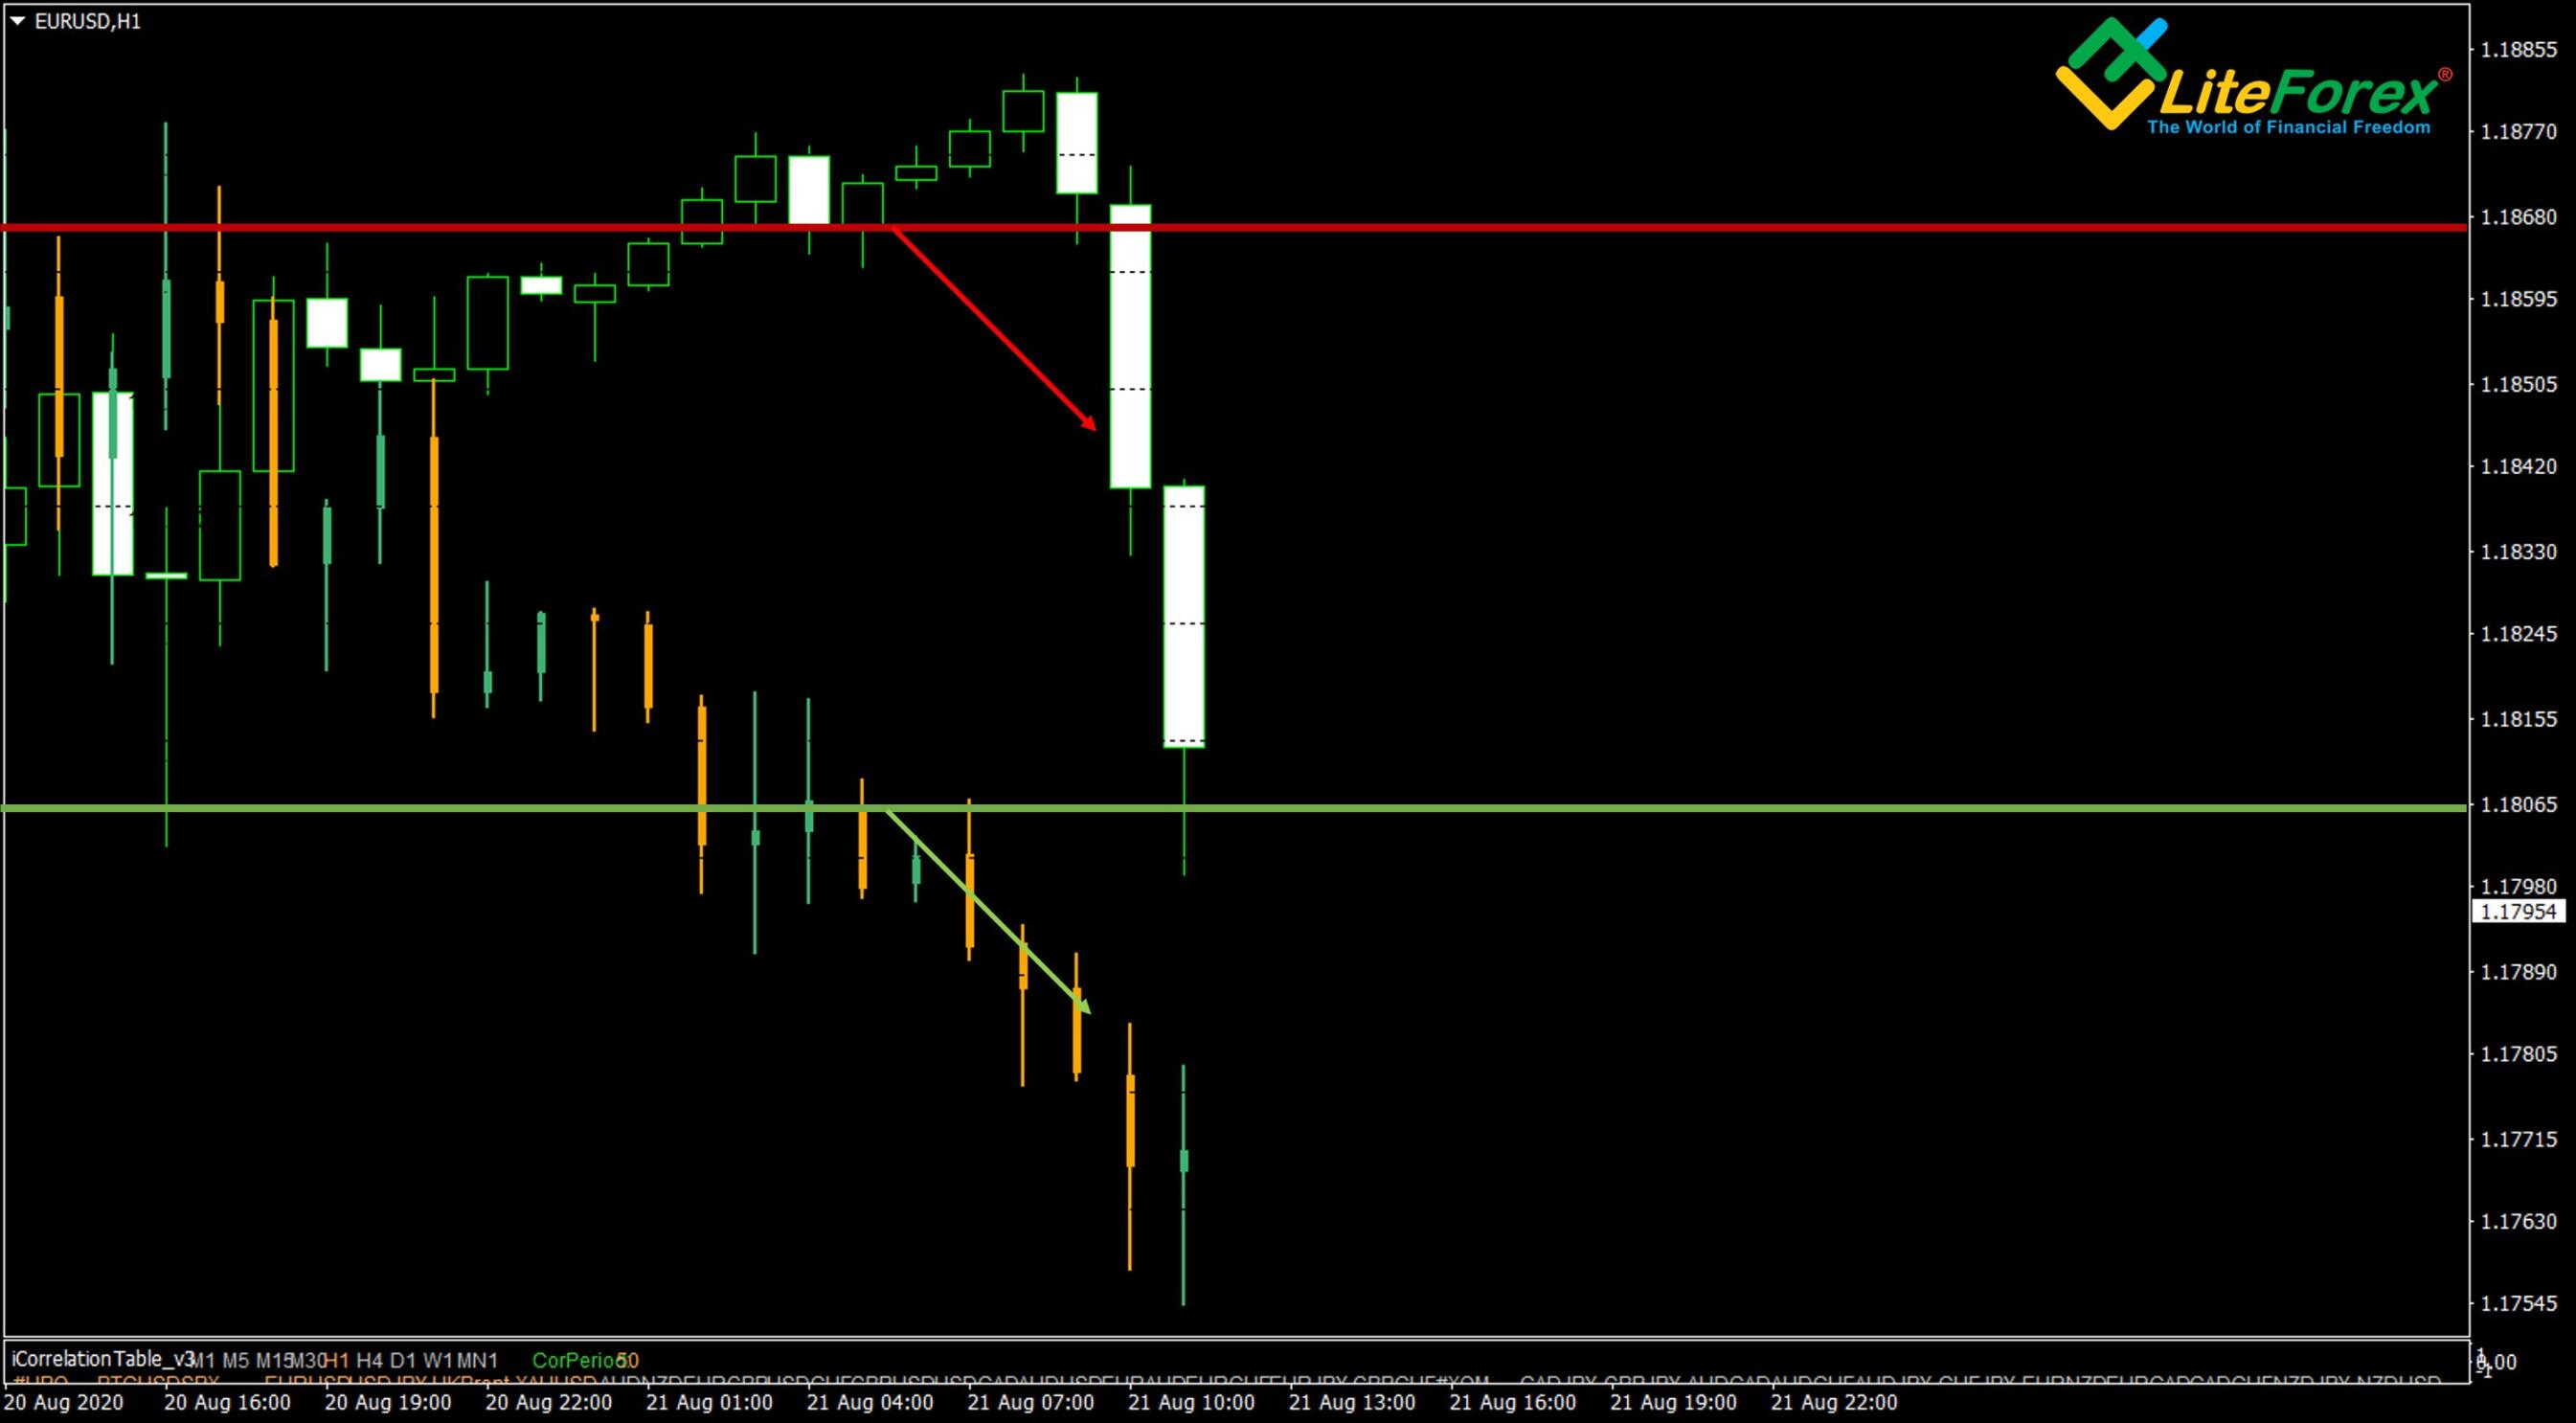
For example, I will use the EURUSD and the USDJPY, as their correlation coefficient in the hourly timeframe is -0.91. Such a correlation coefficient means that they have a very strong negative correlation, so entering trades for these two currency pairs will make a good hedge.
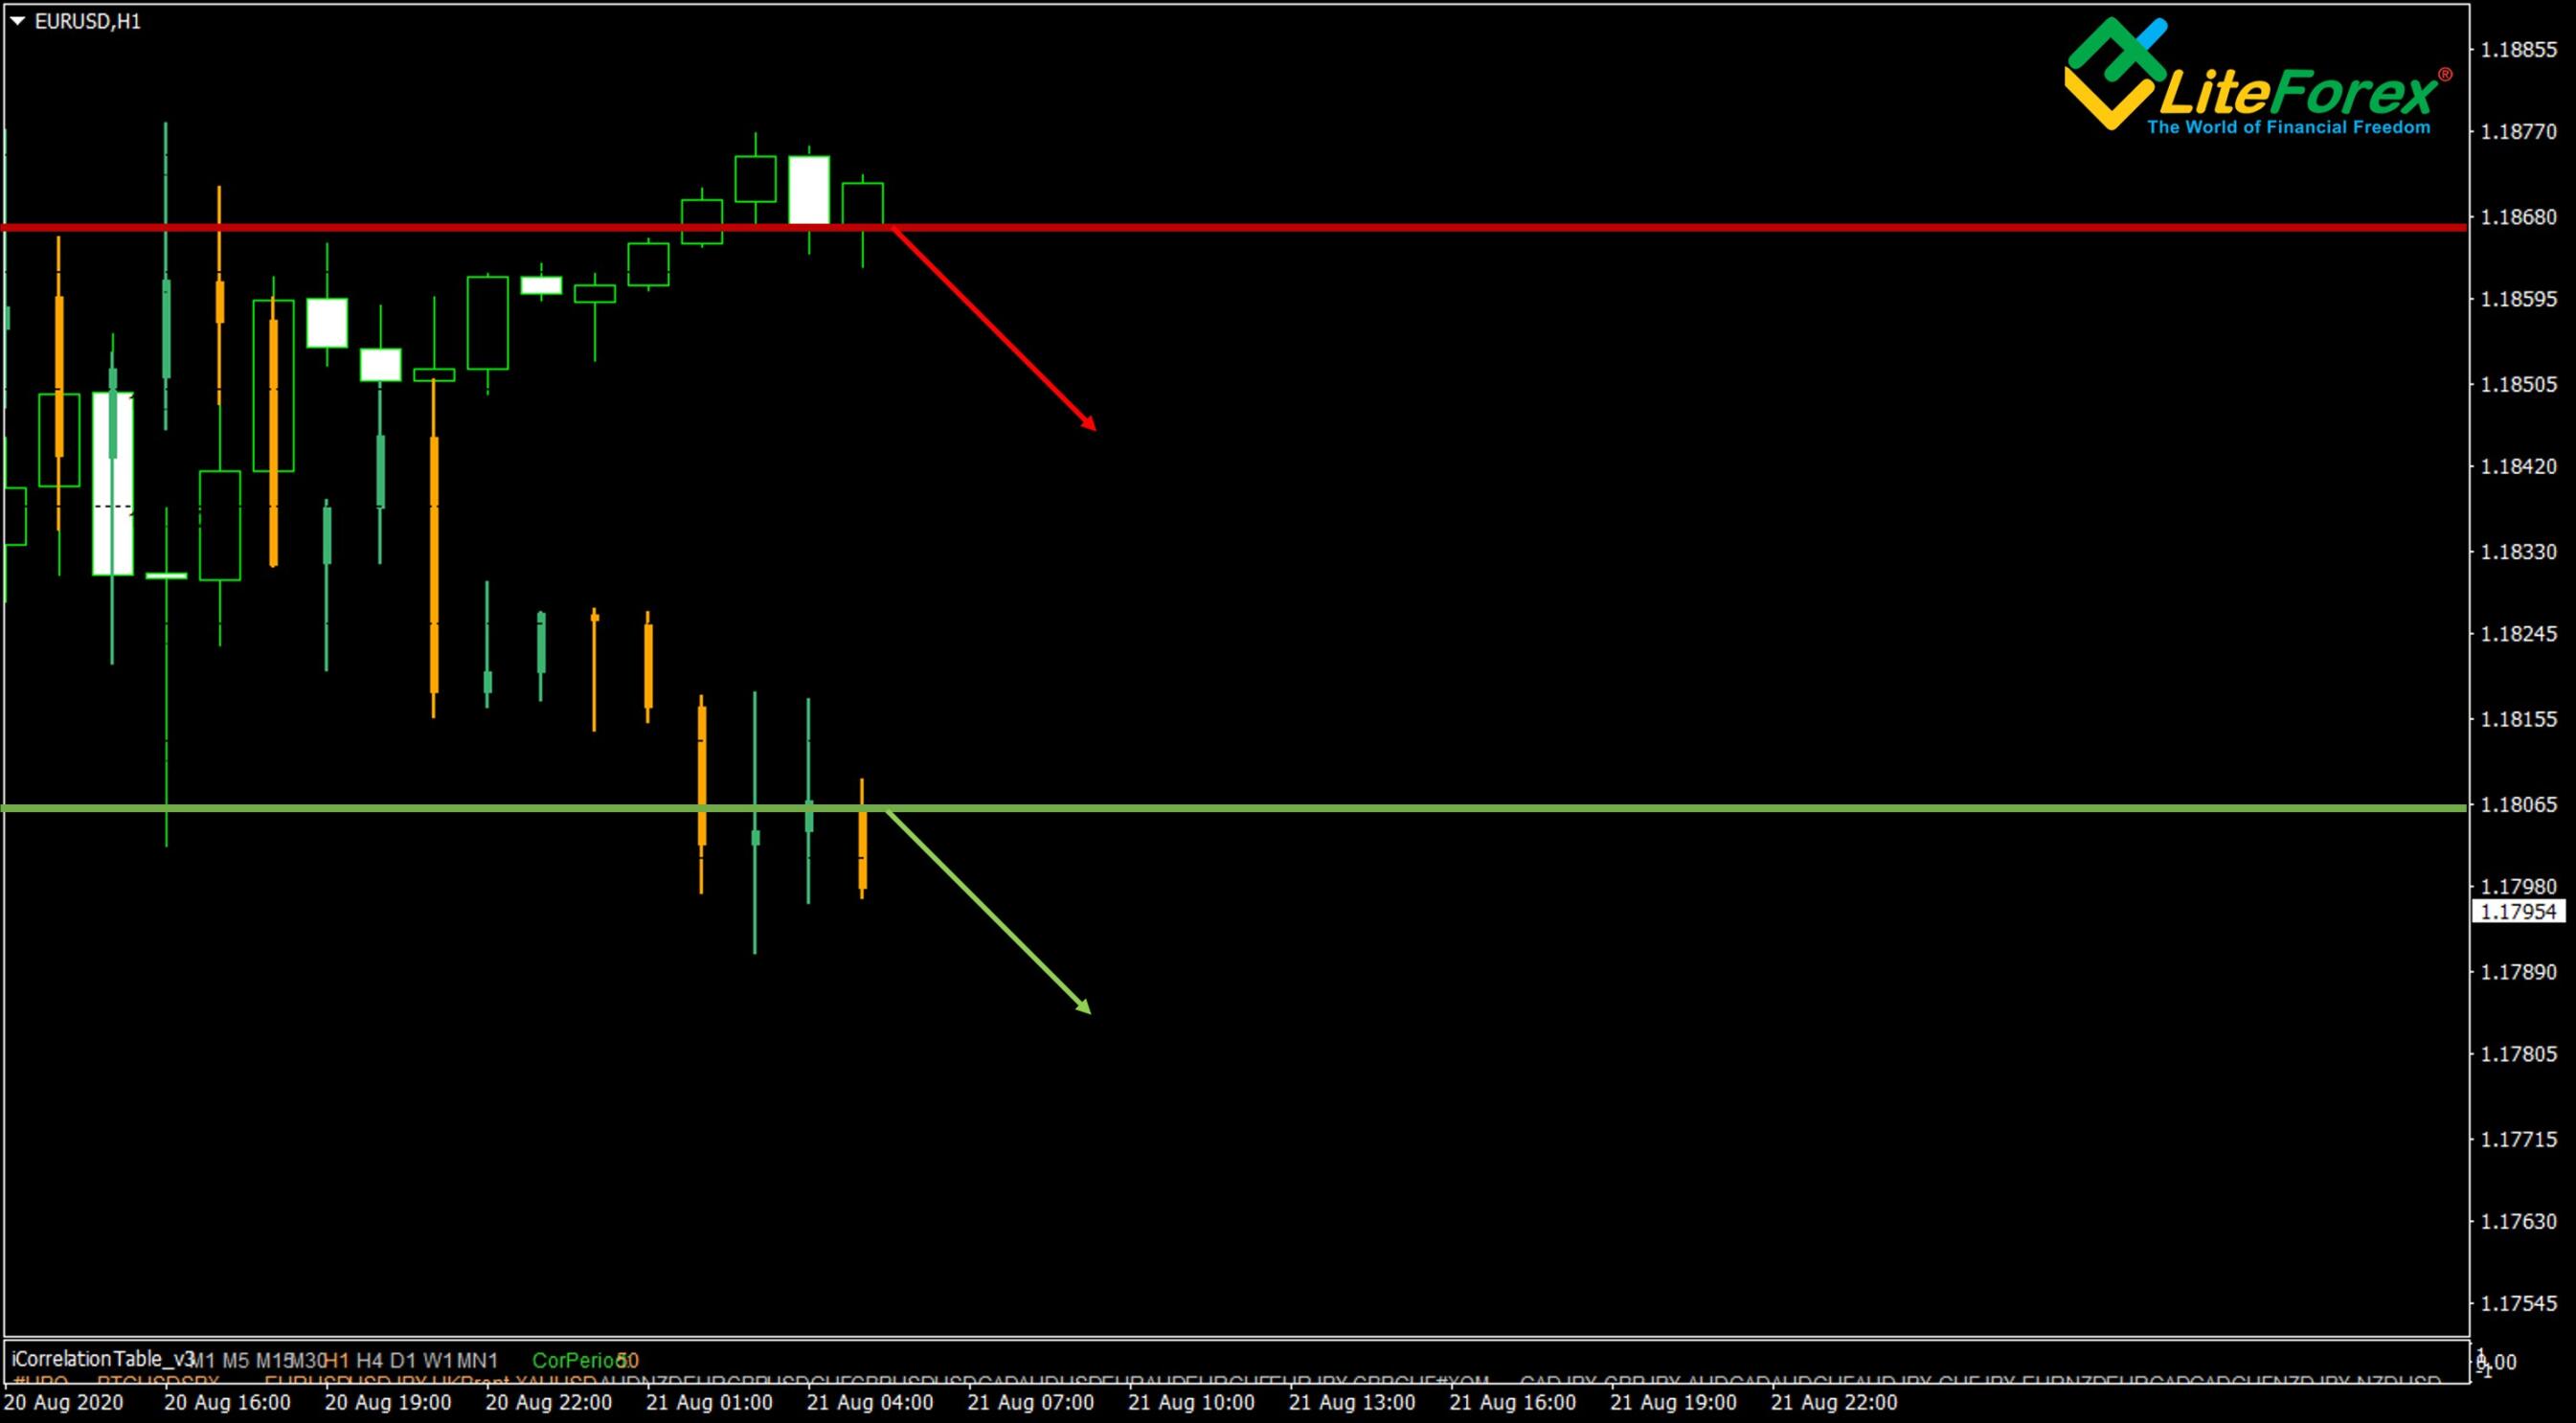
The EURUSD price chart (the one with white bars) suggests a bearish reversal of the market. Using the principle of cross-hedging, we open a sell position for the main currency pair and, at the same time, a sell position for the negatively correlated USDJPY pair.
Now, if we were not right, we can compensate for the potential loss yielded by the EURUSD through the profit generated by the USDJPY trade. As the correlation coefficient is less than 1 by module, these currency pairs can move at a distance from each other, so we can’t compensate for 100% of the potential loss, expecting the pivot points for these two currencies. The correlation coefficient should be considered when calculating the risks. So, coefficients 1 and -1 are considered strong correlations.
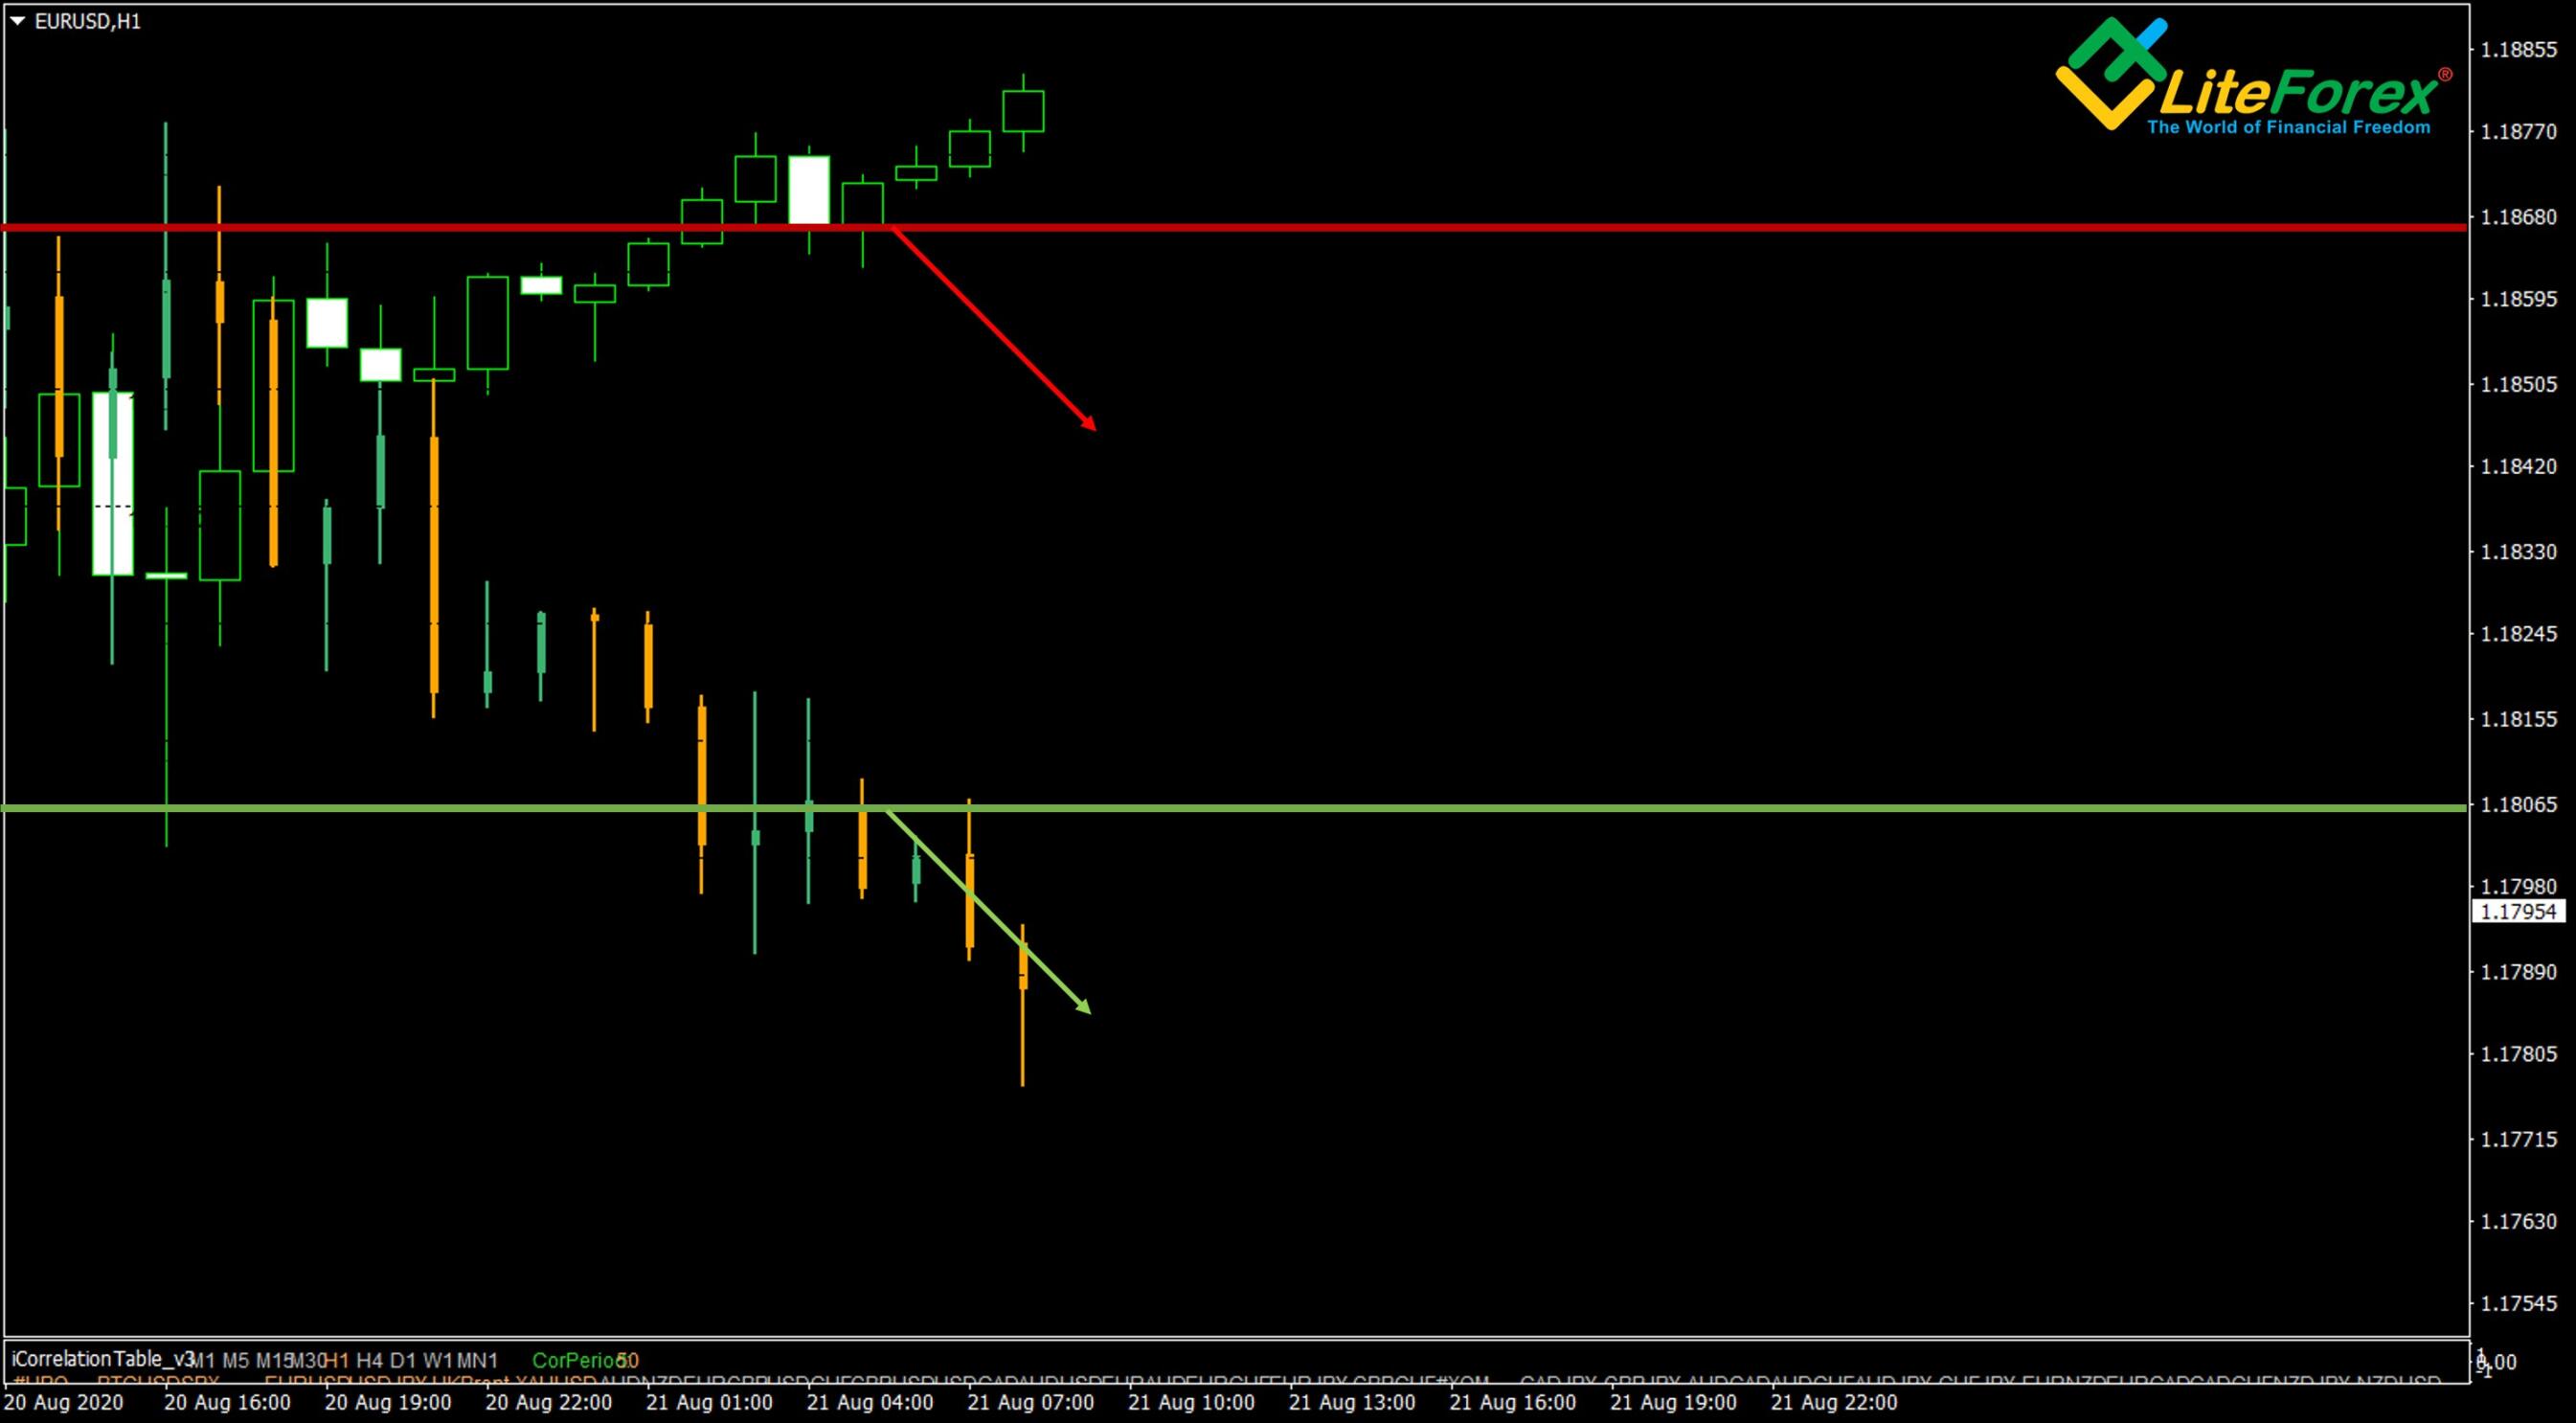
It is clear from the above chart that the euro-dollar continues running up and the yield on the sell position that is opened EURUSD, the yen continues falling, and the profit from the USDJPY short trade covers the loss from the EURUSD trade.
The key to a successful hedging strategy is that the currency correlations are not a constant value. It changes from time to time.
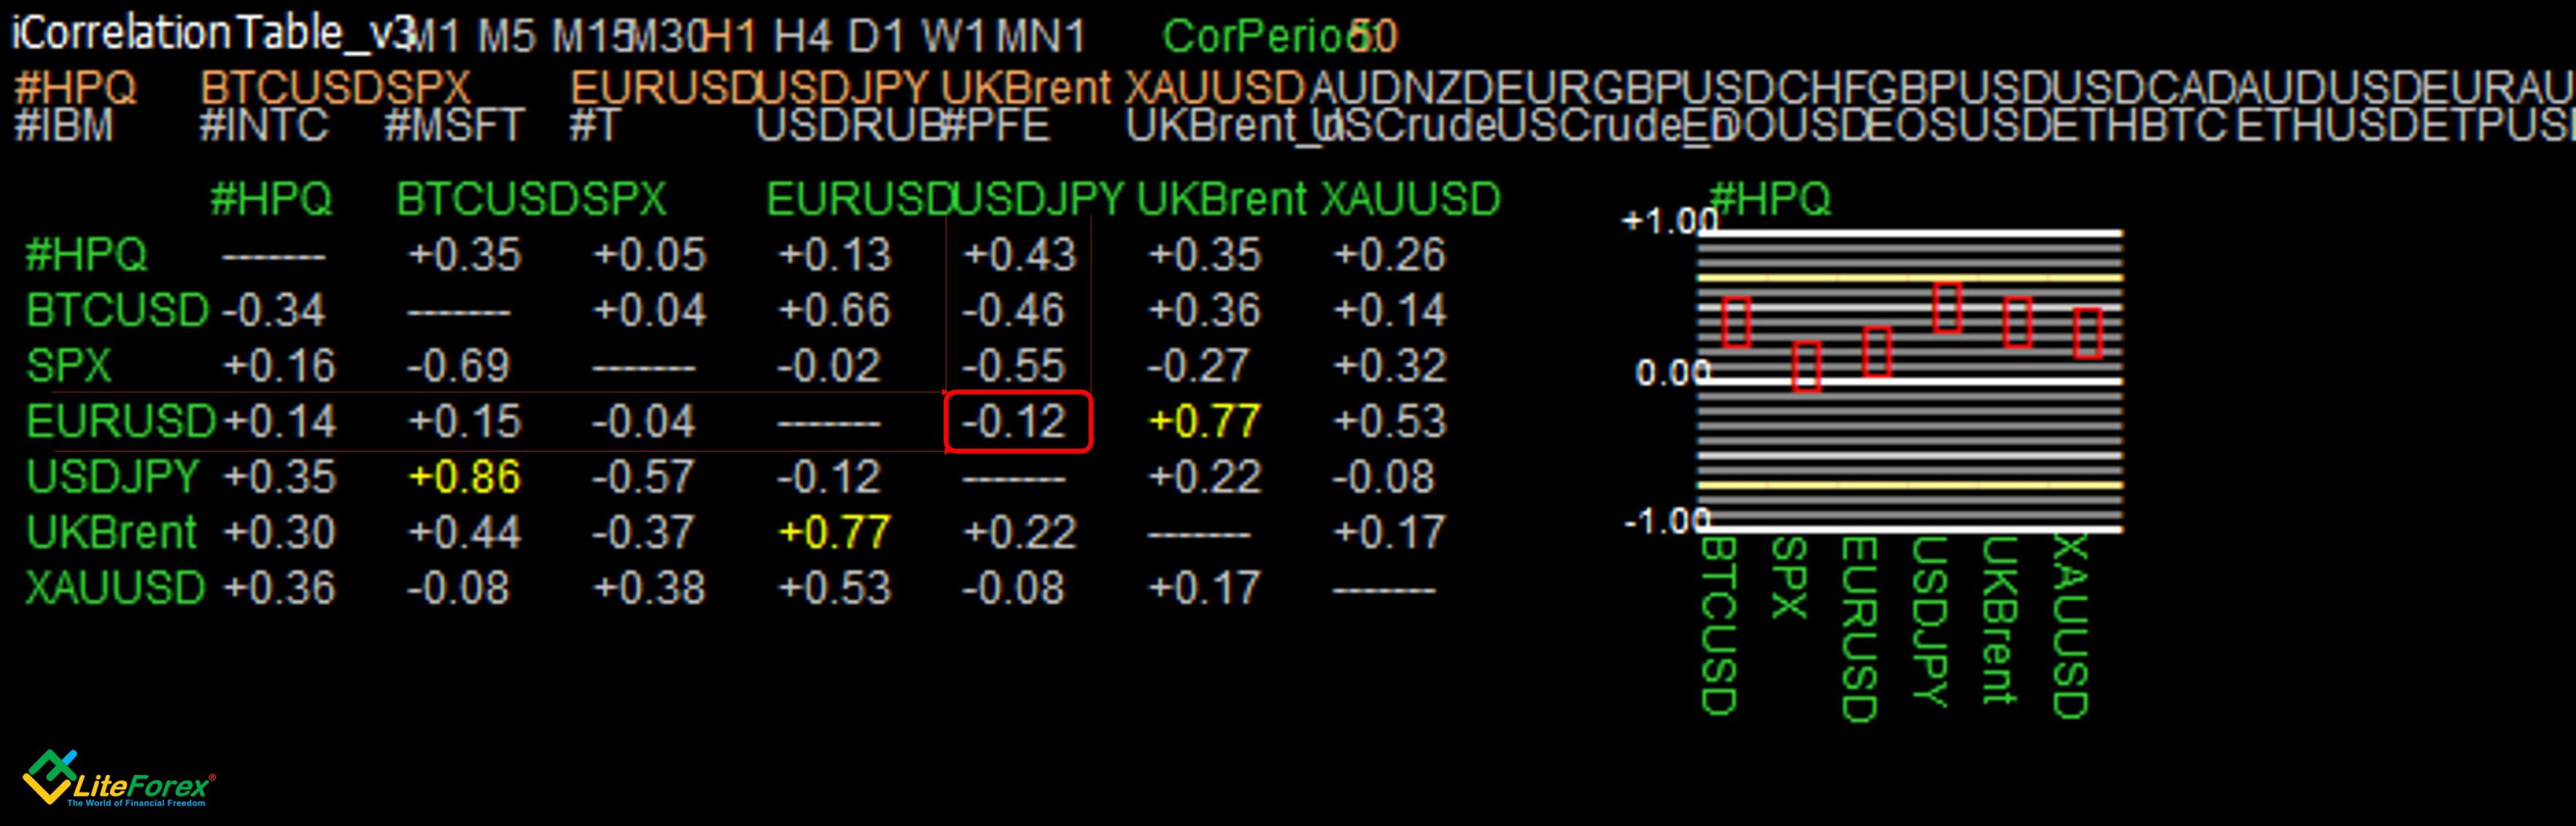
It is clear from the iCorrelationTable_v3 correlation matrix that the correlation between the EURUSD and USDJPY weakens from -0.91 to 0.12.
How is this change indicated in the chart?
It is clear from the above figure the EURUSD has dropped sharply, and we managed to close the position with the loss. However, the USDJPY price trend hasn’t changed; it continued running down. As a result, the cross hedge helped us reduce the risks and make profits simultaneously.
From this example, you can see that the primary source of profit when using a hedging strategy arises when the correlation coefficient changes. However, it is quite difficult to anticipate in advance such changes, especially for beginner traders. There is a high risk that you will have to wait for the right moment for a long time, and the swap will take away a significant part of the profit.
To avoid such a situation (I mean paying too much for the swap), choose a broker with low commissions charged for rolling your trades over! Another flaw of the hedging strategy is a pretty high risk that a change in the correlation module will be against you, and you will be losing money rapidly.
Important! Suppose you want to use hedging to your advantage. In that case, you will have to explore and analyze each of the correlated trading instruments to know for sure that the negative correlation is regularity, not a coincidence.
The hedging strategy is popular for forex trading for this reason. There is usually a stable relationship between the correlated pairs, and so, the use of a hedging strategy will be relatively safe.
To be fair, I should note that correlation hedging is also applied to trading other instruments.
- CFDs correlate with the so-called commodity currencies. For example, the oil price will affect the Canadian dollar, and gold influences the Australian dollar.
- The USD correlates with the S&P 500. If you know any other trading assets from different sectors, which mirror each other’s trends, please write in the comments.
If you know any other trading assets from different sectors, which mirror each other’s trends, please write in the comments.
Forex quasi-arbitrage
The problem of quasi-arbitrage of currency pairs with the US dollar as the quoting currency is the lack of reliable signals about when to sell one and buy the other pair in order to capitalize on the discrepancy.
The figure shows two combined daily charts of the GBP/USD (above) and the AUD/USD (below):
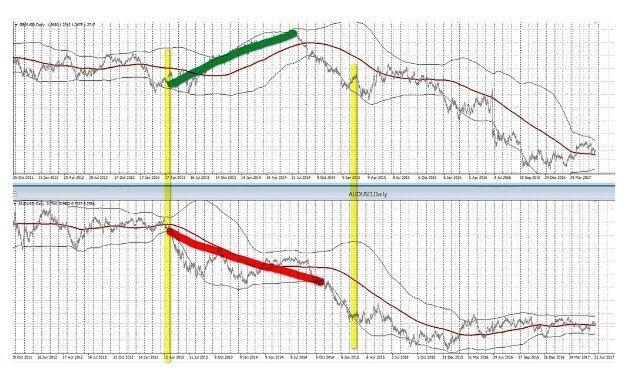
There is a discrepancy between the trends of the pound and the Australian dollar, which began in the summer of 2013 and lasted about two years. Traders who entered the Forex market when an inverse correlation between the two pairs occurred could not calculate a deposit that could withstand the drawdown from such a difference in rates.
When calculating the profits and the deposit required to maintain the position, the feasibility of trades of this kind remains a big question.
Using the correlation between major currencies
Traders favoring the EUR/USD use carry-trade currencies to get leading signals. In the currencies of separate economies with high-interest rates relative to Fed rates, trends begin earlier than they occur in the EUR/USD pair. So, you can use correlations to anticipate pivot points.
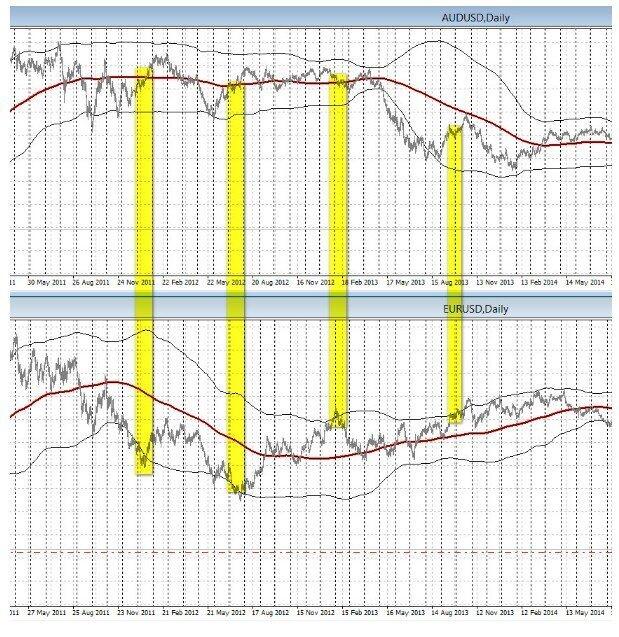
The combined charts of the AUD/USD and the EUR/USD show the areas where the EUR/USD is located on the lower Bollinger border with a period of 200, while the AUD/USD quotes cross the middle line of the indicator. It is easy to notice that after such discrepancies, the EUR/USD trend reverses, trying to catch up with the AUD/USD trend that has moved ahead.
Conclusion: how to use forex correlation pairs
It is best to take currency correlations into account in 2 cases.
As a confirmation when opening a position:
- With direct correlation, the chart of one instrument must not contradict the chart of the second one;
- With an inverse correlation, we need the expected direction of further movement to be the opposite.
As a filter in calculating the total risk that affects trades:
With a strong correlation, it makes no sense to open additional trades in the 2nd instrument if you already have open positions in the first one, because this will be equivalent to opening one trade-in double volume.
With a weak correlation, you can consider the 2nd instrument for opening positions in order to diversify trade.
Summing up, I should note that the correlation between financial instruments is not a constant factor. So, it is recommended to use it not as an independent type of analysis when making decisions, but as a kind of filter.
FAQ's
Correlation is the ability of one trading instrument to repeat the directional movements of another instrument. The correlation of currency pairs is a phenomenon that occurs when the price movements of several currency pairs are similar.
There are two types of correlation: positive and negative.
A positive correlation is a correlation in which price movements of currency pairs change similarly, in one direction. When two assets move in the same direction, and at almost no distance, they have a perfect positive correlation.
A negative correlation is a correlation in which price movements of currency pairs change similarly but in different (opposite) directions. When two assets feature a perfect negative correlation, they move by the same distances but in opposite directions.
There is a complex formula that calculates the correlation of currency pairs to each other. Here it is if you're curious:
r = ∑(X−Xavg)(Y−Yavg)/√∑(X−Xavg)²√∑(Y−Yavg)² where
X — price of the first asset
Y — price of the second asset
Xavg — arithmetic mean of the first asset's price for a particular period
Yavg — arithmetical mean of the second asset's price for a particular period
Correlation is often calculated in excel spreadsheets, but the correlation table is not necessary at all now. Yet calculating the correlation yourself is not needed at all. There are many websites with calculators that will help you calculate the correlation for the pairs you need. You can also install an indicator to your trading terminal that will automatically show pairs with positive or negative correlations among those that you are trading. Installing such an indicator will make currency trading easier and more profitable.
Depending on which currency pair you are trading, pay attention to other currency pairs, the quote currency of which is the quote currency of your financial instrument. To trade forex correlations, you will need to carefully examine the price charts of two different currency pairs, correlated with each other. If you clearly see that the price of one pair will fall or is already falling, do not buy the positively correlated pair.
Example: You are trading the GBPUSD currency pair. The US dollar is a unique currency as it affects the rates of many other currencies in the financial world. In this case, it would be reasonable to pay attention to the price movement of the EURUSD pair before making any trading decisions.
There are three most traded Forex pairs, which are positively correlated: GBP/USD, AUD/USD, and EUR/USD. They are traded against the dollar (the dollar is the quote currency), and any change in the behavior of the dollar reflects in their rates. These currency pairs have negative correlations with counterparts, which include USD/CHF, USD/JPY, and USD/CAD. They all have the dollar as the base currency, which is why they are moving in the opposite direction to the majors mentioned above. For example, for the AUD/USD pair, there are pairs with a perfect positive correlation (NZD/USD, AUD/JPY, NZD/JPY) and a negative correlation (USD/SGD, USD/CHF, USD/SEK).
According to the United Nations Treasury, in the world, there are 154 currencies in 221 countries. There are around sixty currency pairs commonly traded in the Forex market, some of them are more popular among traders, and some of them are less. The most traded are called major currency pairs, there are seven such pairs. Less-traded pairs are called minor or exotic, and the pairs that do not include the US dollar are called cross-rates. With LiteFinance, you can trade more than sixty forex currency pairs, and this number satisfies all requests of traders.
P.S. Did you like my article? Share it in social networks: it will be the best "thank you" :)
Useful links:
- I recommend trying to trade with a reliable broker here. The system allows you to trade by yourself or copy successful traders from all across the globe.
- Use my promo code BLOG to get a 50% deposit bonus on the LiteFinance platform. Simply enter this code in the appropriate field when funding your trading account.
- Telegram chat for traders: https://t.me/litefinancebrokerchat. We are sharing the signals and trading experience.
- Telegram channel with high-quality analytics, Forex reviews, training articles, and other useful things for traders https://t.me/litefinance
The content of this article reflects the author’s opinion and does not necessarily reflect the official position of LiteFinance broker. The material published on this page is provided for informational purposes only and should not be considered as the provision of investment advice for the purposes of Directive 2014/65/EU.
According to copyright law, this article is considered intellectual property, which includes a prohibition on copying and distributing it without consent.