Trading the financial markets requires skill, research, and, often, artful vision. Among the trader's palette of technical analysis tools lies an assortment of chart patterns that can help analyze market conditions and forecast future price action. The ability to accurately spot these formations and execute them with discipline can significantly impact your success as a trader.
One such pattern that has stood the test of time is the Gartley pattern. First introduced by H.M. Gartley in his 1935 book "Profits in the Stock Market," this harmonic pattern highlights potential market turns with laser-focused precision. When traded well, the risk-reward payoff can be very favorable.
This article will cover the construction, trading rules, and execution steps for the bearish Gartley trade pattern. Whether you are new to harmonic trading or looking to refine your knowledge, this guide aims to make you a master of one of the most popular retail trading chart patterns. So let's dive in and explore why so many traders closely follow Gartley.
The article covers the following subjects:
Major Takeaways
- The bearish Gartley is a harmonic chart pattern composed of four Fibonacci-based price swings that signal a likely downward trend reversal.
- Validating the accuracy of the bearish Gartley’s Fibonacci ratios between each swing before entry improves the pattern’s likelihood of producing a profitable downtrend as anticipated.
- This reliable harmonic formation can be applied to spotting high-probability shorts in stocks, futures, commodities, and other tradable markets besides forex market trading.
- While potent, bearish Gartleys should be traded within a broader trading plan that employs robust risk management. Stop losses are essential, even for high-probability setups.
- Fibonacci-based harmonic patterns like the bearish Gartley reflect more remarkable symmetries and market rhythms that produce the most favorable entry and exit points.
Constructing a Bearish Gartley Pattern
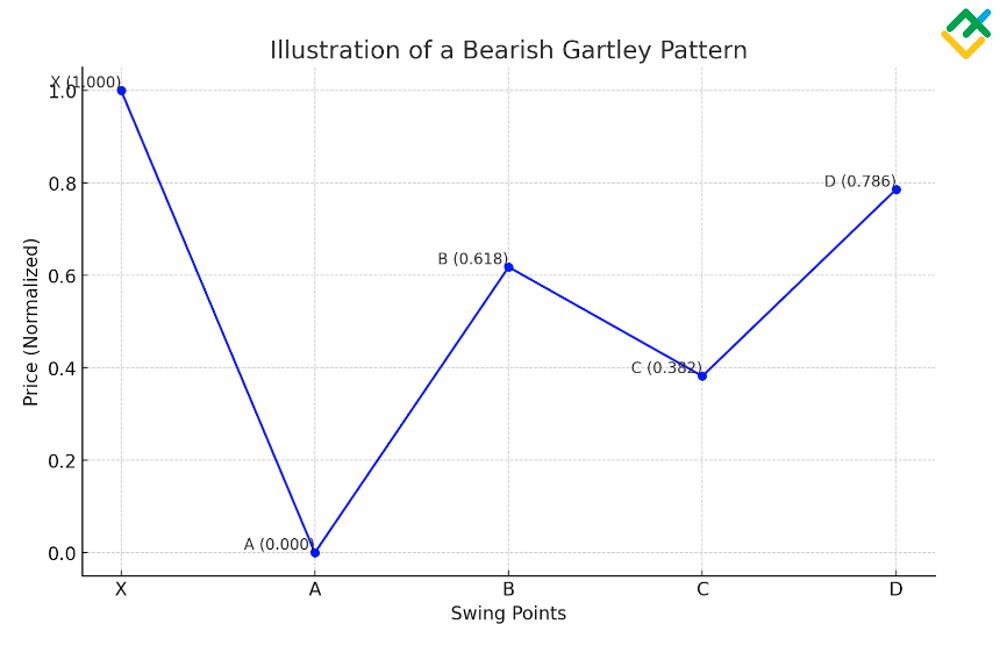
The bearish Gartley trade pattern structure comprises four distinct price swings that adhere to specific Fibonacci ratios. Correctly identifying and measuring each swing is crucial for validating the pattern. Here is a deeper look at how each swing forms the bearish Gartley.
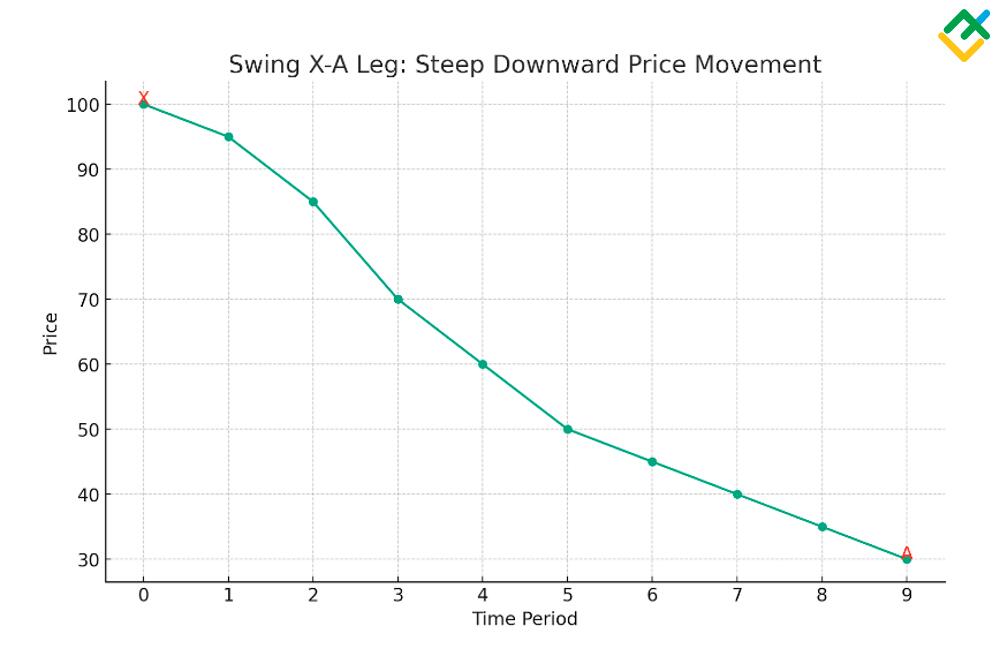
Swing X-A
The pattern's X-A leg is the longest and steepest downward price move, which sets the baseline. The price drops sharply from the high point X to the low point A. This initial swing is critical because it establishes the range that future swings will retrace. Traders should pay close attention to the length and slope of this leg.
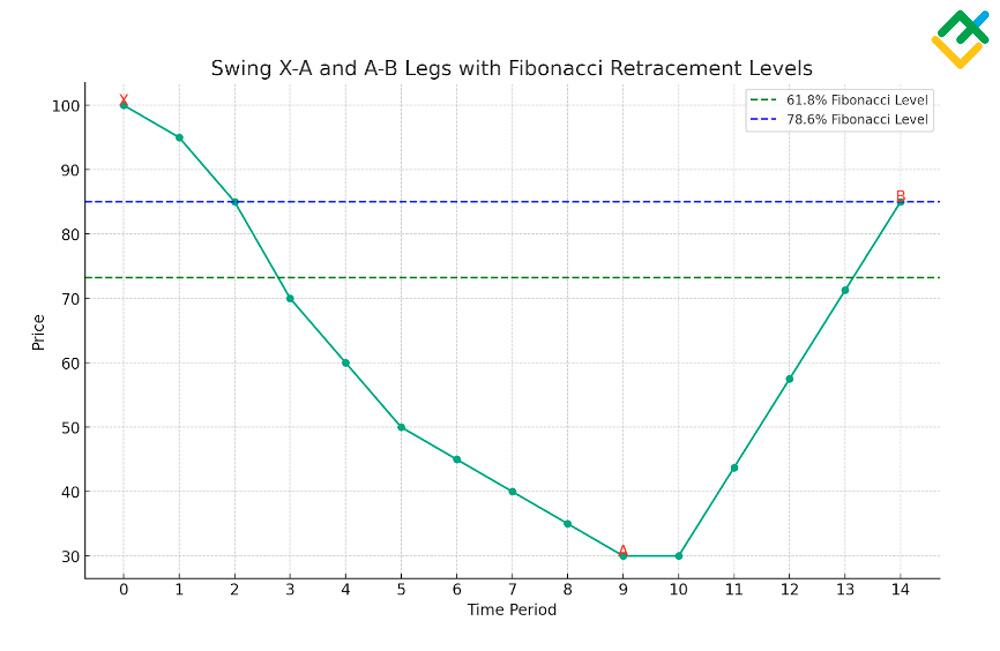
Swing A-B
The A-B leg is an upward correction where the price retraces between 0.618 and 0.786 of the distance of the initial X-A downward move. This means point B cannot exceed point X during this swing higher. Watch that the A-B leg stays within the Fibonacci levels. This swing forms a resistance area.
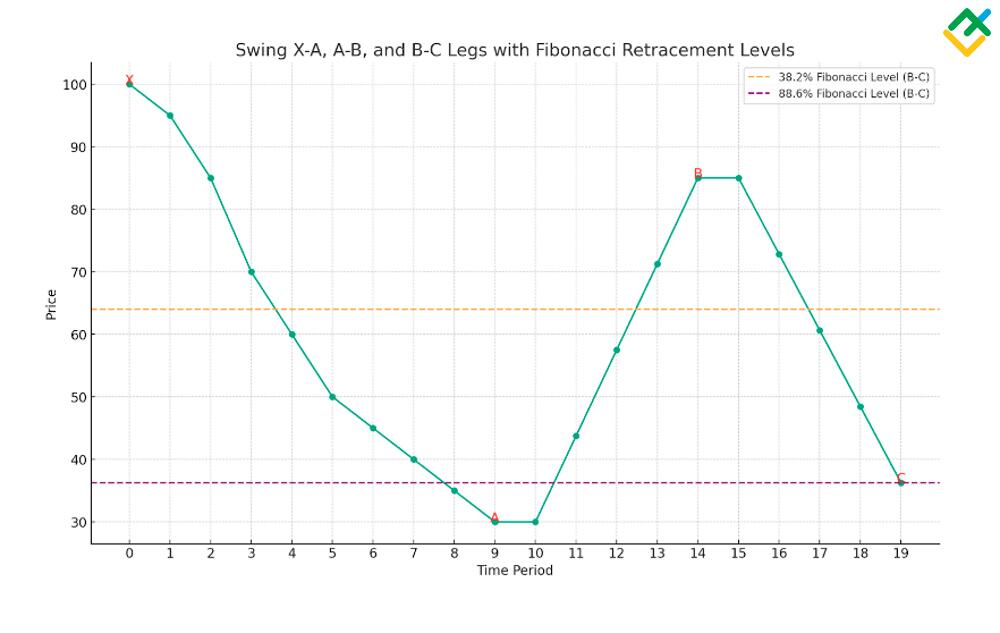
Swing B-C
In the B-C leg, the price drops again to form the third swing. But it must retrace between 0.382 and 0.886 of the length of the previous A-B leg. The B-C leg must stay within the original point A. Carefully measure this retracement.
Swing C-D
The fourth and final C-D leg completes the pattern by driving the price down from point C to point D. Point D must achieve a 0.786 Fibonacci retracement of the first X-A leg for the pattern to qualify. This validates the bearish Gartley trade structure and sets up a short trade entry with a stop loss above D.
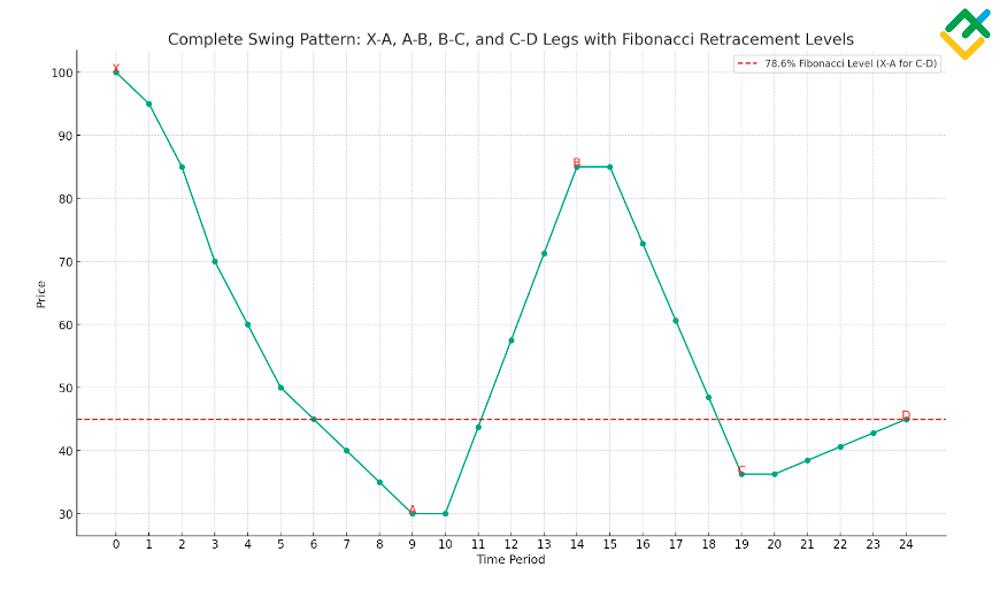
A valid bearish Gartley pattern is constructed when traders can adequately identify and measure these four swings that adhere to the Fibonacci ratios. This signals a high probability of a downward trend reversal, creating optimal conditions for a short sale.
Trading a Bearish Gartley
Once traders have validated the bearish Gartley pattern's completion, they can capitalize on the anticipated downtrend reversal by taking a short position. Here are some key techniques for successfully trading this high-probability pattern.
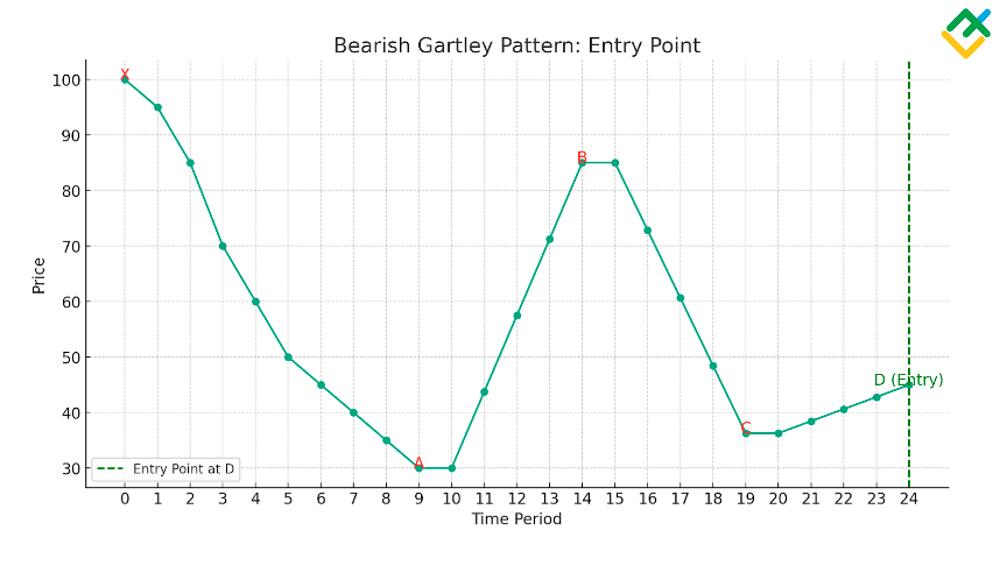
Entry
The optimal entry point for the trade is when the price completes the final C-D leg and reaches point D. This is where a short sale can be executed, as the pattern has now fulfilled all the necessary Fibonacci ratio requirements between the swings. Entering as close to point D based on the C-D leg retracement maximizes the trade’s profit potential.
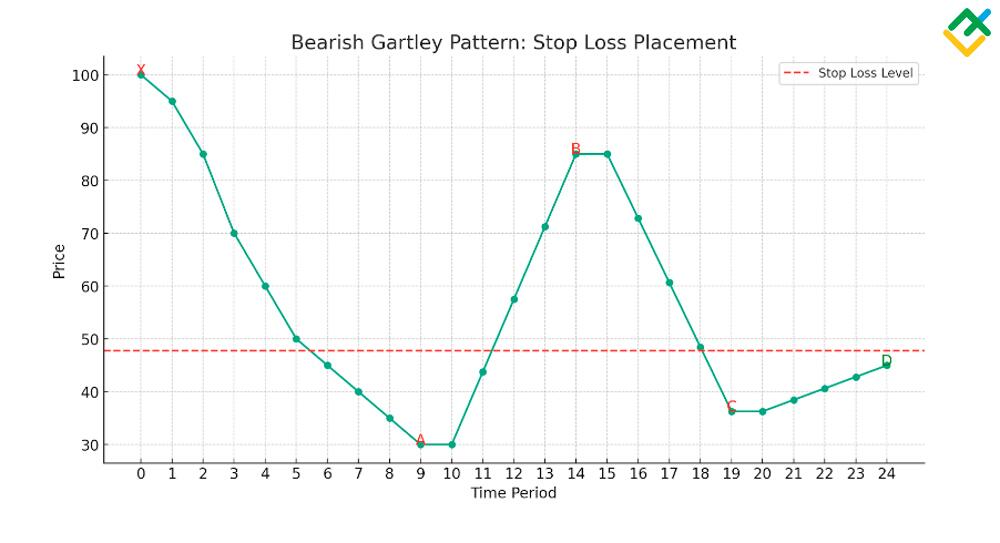
Stop Loss
A stop-loss order should be strategically placed just above the high point D to define and strictly limit risk on the trade. This stop loss protects capital if the pattern fails and the price rises instead of dropping as expected. The trade is invalidated if the price increases above point D, so the stop loss must be set accordingly.
Profit Targets
Potential profit targets can be identified using the Fibonacci extension tool, which locates possible support levels where the short position could be covered after a downward move. Taking partial profits at the extension levels maximizes the bearish Gartley pattern.
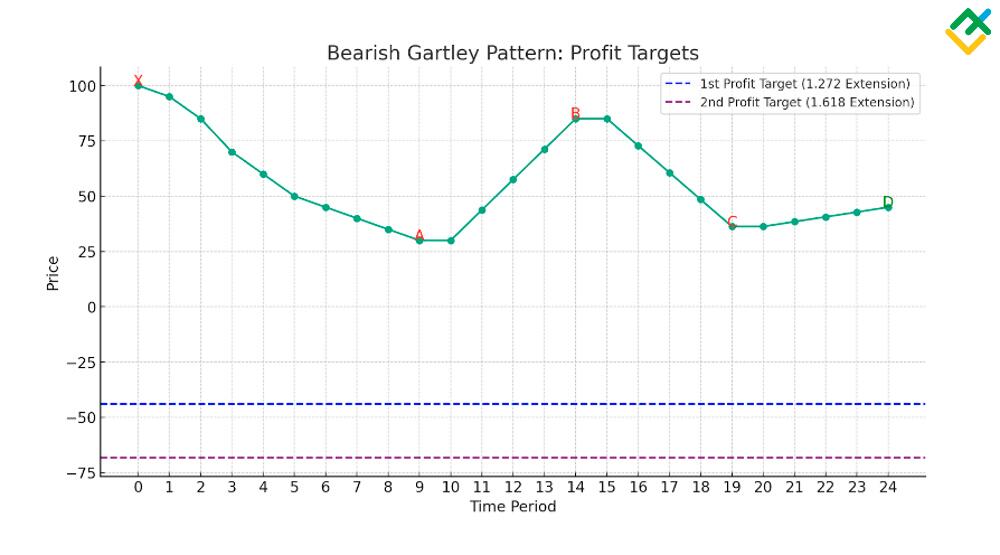
In addition to taking profits at the Fibonacci extension targets, a trailing stop can dynamically lock in profits and ride the downtrend momentum as long as possible. Options strategies also help remain in the profitable short trade while mitigating risk.
Conclusion
Trading chart patterns like the bearish Gartley can provide a statistical edge with proper execution. Combining harmonic formations with price action analysis and momentum indicators creates an integrated approach. Use stop losses, check for pattern invalidations, and scale out incrementally. There will always be some losing trades, but that is part of trading. If traded well, the bearish Gartley trade pattern can produce favorable risk-reward scenarios.
Platform where traders earn more

Trade on LiteFinance’s high-tech ECN platform and open an account so that beginner traders can copy you. Earn a commission for copy trading and boost your income.
Bearish gartley pattern FAQs
The bearish Gartley is a harmonic chart pattern consisting of four Fibonacci-based price swings that signal a high probability of a downward trend reversal.
Look to enter short sales upon completion of the pattern's C-D leg, place stop loss above point D, and take partial profits at Fibonacci extension levels toward the expected downtrend.
Use Fibonacci drawing tools to measure and validate the retracement ratios between price swings X-A, A-B, B-C, and C-D as per Gartley guidelines.
The Gartley pattern is a robust indicator, especially when used in conjunction with other technical indicators and when Fibonacci ratios are respected, and the pattern is completed as expected. However, proper risk management is still essential.

The content of this article reflects the author’s opinion and does not necessarily reflect the official position of LiteFinance broker. The material published on this page is provided for informational purposes only and should not be considered as the provision of investment advice for the purposes of Directive 2014/65/EU.
According to copyright law, this article is considered intellectual property, which includes a prohibition on copying and distributing it without consent.