Trading in financial markets encompasses a wide variety of strategies and analysis tools. However, there are several distinct patterns, such as the Hartley, Bat, and Shark patterns, that can provide valuable insights to traders. One such pattern is the Crab. The Crab is highly accurate and can be used to identify profitable trading opportunities.
The Crab is one of the harmonic patterns, calculated using Fibonacci retracement levels. Traders can use it to find optimal entry and exit points for their positions.
This article explains how the Crab appears on trading charts and discusses trading strategies that employ this pattern.
The article covers the following subjects:
Major Takeaways
A Deep Crab pattern is a harmonic structure; its distinctive feature is that point D extends below or above point X, suggesting the trend may change direction soon.
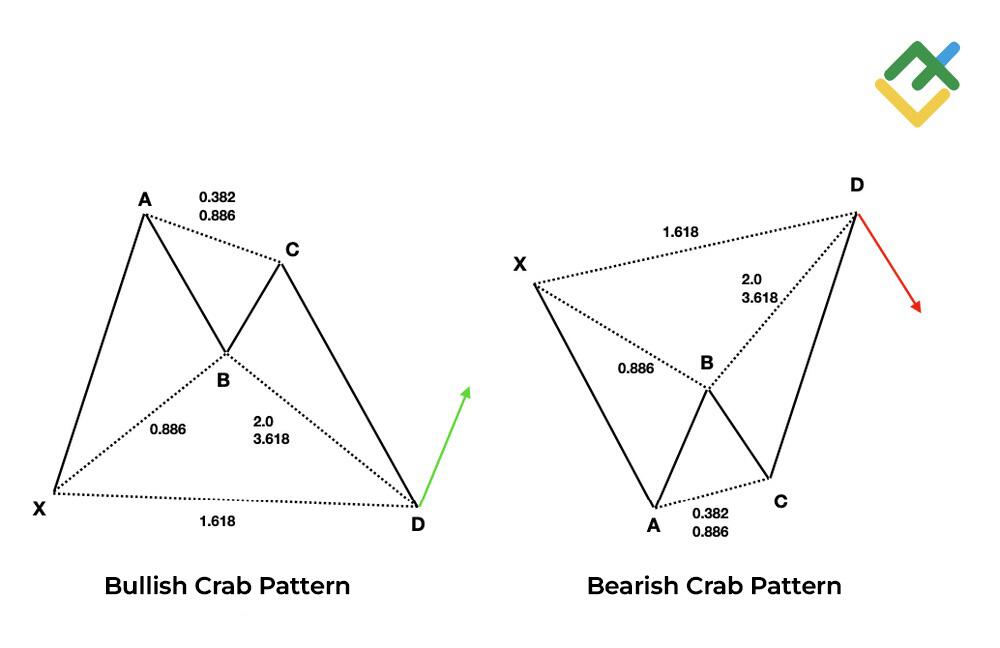
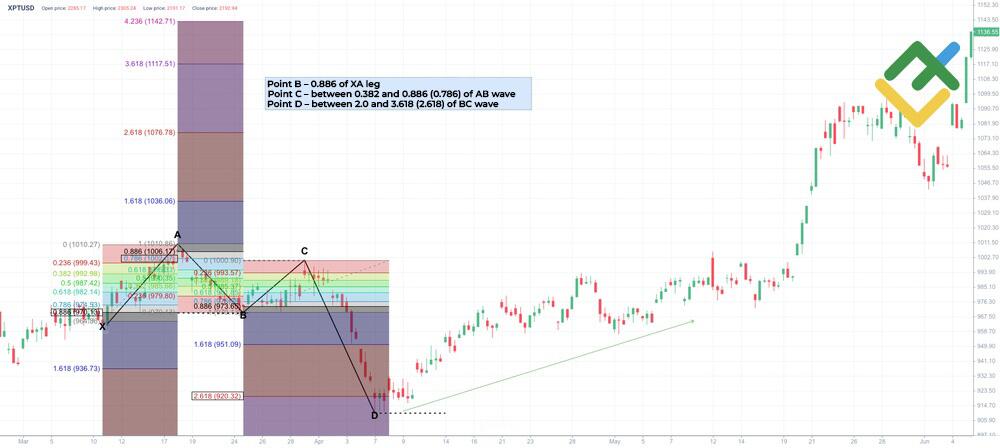
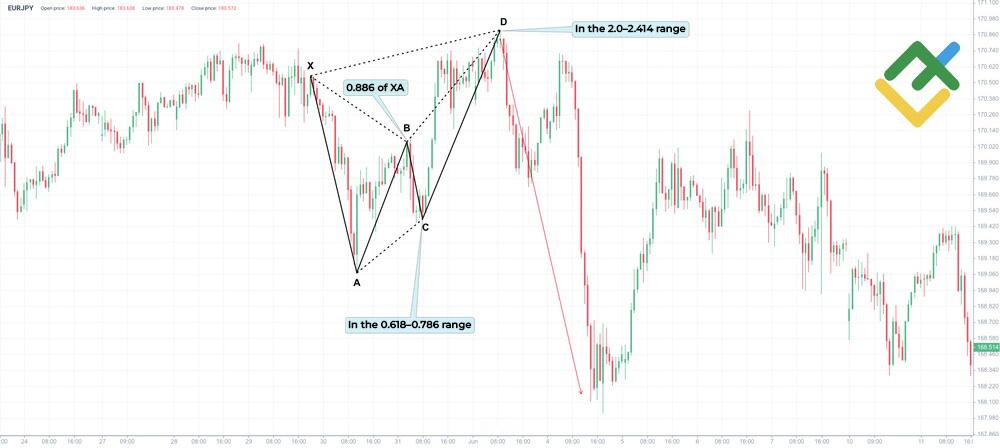
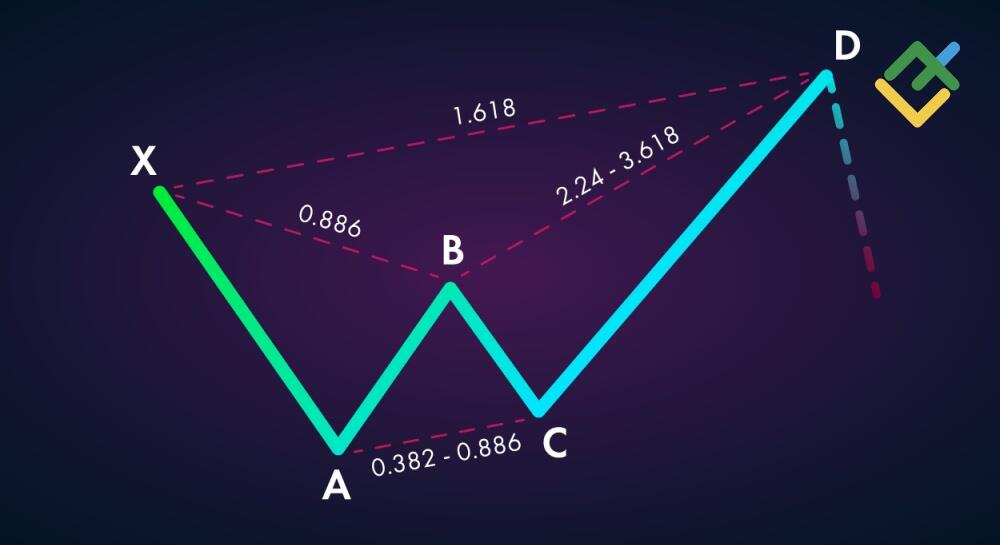
The Crab pattern consists of five points: XABCD. Importantly, the XABDC pattern should correspond to specific Fibonacci retracement levels. Fibonacci extensions for points B (correction 0.886 and 0.618), C (0.382–0.886), and D (2.0–3.618) relative to segments XA, AB, and BC confirm the Crab pattern.
If you spot a bullish Crab pattern, you can consider long positions. In this case, point D lies below point X, implying that the price is likely to move higher soon.
A bearish Crab mirrors the bullish version. Point D sits above point X, hinting at an imminent price decline. In this scenario, you can open short positions.
As a rule, positions are opened at point D. A stop-loss order is placed slightly above or below this point to limit potential losses. Profit-taking areas are determined by the Fibonacci levels.
It is preferable to trade this pattern with RSI, MACD, MFI, VWAP, and moving average indicators, as well as with reversal candlestick patterns such as the Hammer, Hanging Man, and Engulfing patterns.
What Is the Crab Pattern in Trading
The Crab pattern is a harmonic pattern that helps traders predict how the price of a traded asset will move. It is a fairly complex tool that requires traders to correctly identify and apply Fibonacci retracement levels.
One of the main features of the Crab is its deep correction. On the chart, point D is usually found much further away than in other harmonic patterns, reflecting strong volatility.
Some traders consider the Deep Crab to be one of the most reliable harmonic patterns. If correctly identified, it can provide excellent entry points for trades. However, it is essential to consider the risks and avoid opening positions using your entire deposit.

Fibonacci Ratios and Pattern Structure
The Crab pattern's structure is based on Fibonacci retracement levels. They help determine at which levels the price may change direction. There are several key Fibonacci levels that traders focus on: 0.382–0.886, 1.618, and 2.00–3.618. These levels help identify potential reversal points.
Five-Point XABCD Formation
The Crab pattern has a five-point XABCD structure, with key points determined using Fibonacci levels. Here are the essential Crab pattern rules:
XA leg. This is the first wave, which sets the direction.
AB leg. The price corrects slightly, usually to 0.618–0.886 of the XA swing.
BC leg. The price resumes moving in the trend's direction and reaches 0.382–0.886 of AB wave.
CD leg. A long CD leg completes the Crab pattern. Point D typically settles between 2.00 and 3.618 of BC wave. When this happens, it means the entire pattern is complete, and the trend is about to reverse.
These Fibonacci ratios can help you gain a better understanding of the Crab pattern and predict future price movements.
Bullish Crab Pattern
The bullish Crab pattern appears in downtrends and signals a looming trend reversal.
Point D is the most distant point of the pattern. It often marks an entry point into a long position. At this level, there is a high probability that the trend will reverse to the upside.
A bullish Deep Crab pattern is a type of Crab pattern in which the "claw" (price correction) goes particularly deep. For a trader, this means they can open a trade at a more attractive level.
Bearish Crab Pattern
The Deep Crab bearish pattern forms during an uptrend and signals a potential price reversal. Point D marks a potential reversal zone, from which you can open a short position.
However, before opening a trade, you need to make sure that the pattern has formed properly. Check technical indicators, trading volumes, and news — all of this can help you make a more informed decision. Do not rely on the pattern alone, even if it looks very reliable. There is always a risk, so it is better to be safe than sorry.
Crab Pattern Trading Strategy
Crab trading requires careful chart analysis and confirmation. You should train your eyes to recognise potential Crab patterns. Once you have identified this pattern, wait for the price to reach point D. Next, look for confirming signals, such as reversal chart patterns or indicator divergences.
Determine support and resistance levels, consider the stock market conditions, and follow economic news to make more informed decisions. The AB=CD pattern can also serve as a signal to open a trade.
Let's take a look at an example of such a trade on the four-hour chart of the XAGUSD.
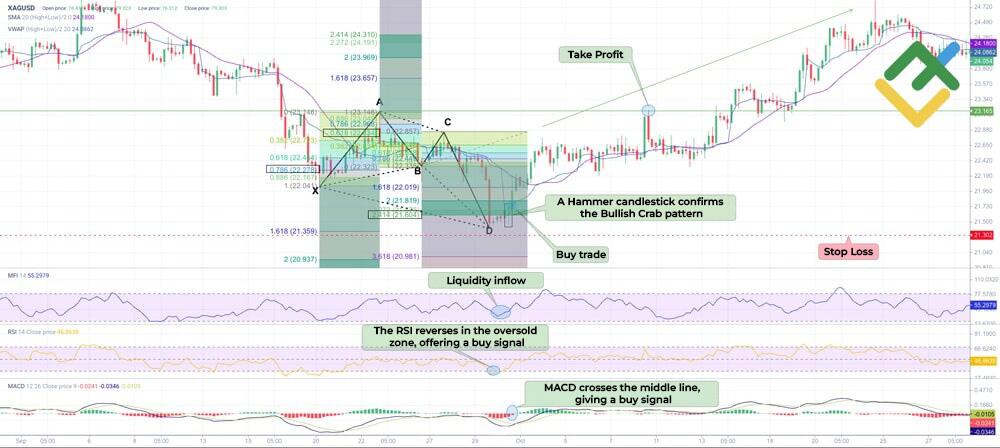
The chart above shows that after a downward movement, a Bullish Crab pattern emerged:
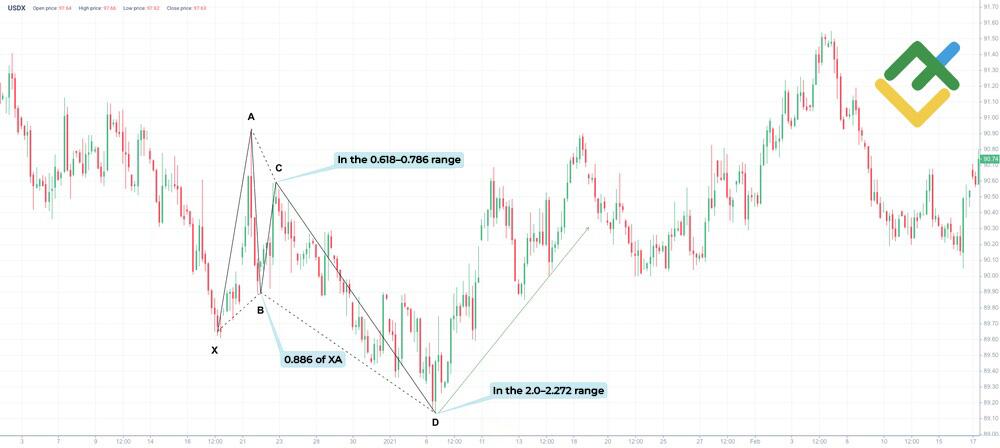
Point B is located in the 0.786–0.886 Fibonacci retracement area of wave XA.
Point C is formed in the 0.618 Fibonacci retracement area of wave AB.
Point D is located in the 2.414 area and slightly below wave BC, which corresponds to the pattern rules.
At point D, you should look for confirmations of the pattern:
A Hammer candlestick reversal pattern suggests that the downtrend is about reverse.
The MFI has turned upward near the lower boundary, reflecting an inflow of liquidity.
RSI values have also reversed and left the oversold zone, giving a strong signal to open long positions.
MACD has also crossed the zero line, the histogram is growing, and a rise in quotes is expected.
Based on the confirming signals of the Crab pattern, you can open a long position at $21.73 with a target of $23.16 near point A. A stop-loss order can be placed slightly below point D at $21.30.
Conclusion
The Crab harmonic pattern is an effective tool for predicting price movements. It allows you to identify key reversal points and maximize your profits.
However, to use this pattern effectively, you need a deep understanding of Fibonacci levels, careful technical analysis, and strict adherence to risk management rules. Trading Forex using the Crab pattern requires experience and discipline.
Learn how to trade harmonic patterns with a free LiteFinance demo account.
Get access to a demo account on an easy-to-use Forex platform without registration
Crab Pattern FAQs
The Crab pattern is considered one of the most reliable harmonic patterns. However, like any trading pattern, it does not guarantee 100% accuracy. Be sure to consider the market context and confirm signals.
Combining the Crab pattern with technical indicators, such as the RSI, MACD, volume, and moving averages, can improve forecast accuracy. These indicators can help reveal entry and exit points. The principles of the smart money strategy can also confirm the Crab pattern.
The content of this article reflects the author’s opinion and does not necessarily reflect the official position of LiteFinance broker. The material published on this page is provided for informational purposes only and should not be considered as the provision of investment advice for the purposes of Directive 2014/65/EU.
According to copyright law, this article is considered intellectual property, which includes a prohibition on copying and distributing it without consent.