What is the Puria method? The basics of the Puria trading strategy, indicators, settings, and the practical application, market and protective orders. Advantages and flaws of the Puria Method strategy.
The Puria forex strategy is based on three standard indicators: various types of moving averages, and a confirming oscillator MACD. The strategy is rather common, the entry signal is when the slow MAs cross the fast MA upside or downside, and the entry point is verified by the MACD. Does this forex strategy work? That author claims it to be profitable. He even offers his own table of setting the orders according to currency pairs and timeframes. There many positive comments about the strategy, but can we believe them? Will a robot work with the Puria Method? All these questions will be answered in this overview.
The Puria Method is a Magic Wand for beginner traders
According to the request statistics, the Puria Method strategy is not that popular, it is requested by just 420 per month. Nonetheless, some writers in relatively TOP investment some forex blogs suggest it is necessary to consider this trading strategy. And the most interesting is that it is highly recommended to the newbies. But what if the beginner traders will start commonly employing this trading system? Taking into account that it is based on standard indicators it may well suit to inexperienced traders. I will try to find out in the article whether the Puria Method is a really profitable forex trading strategy, and in what way it is better/worse than other simple trading strategies for beginners.
You will learn from this review:
- What the Puria Method trading strategy is and how it differs from other forex trading systems.
- The working principle of the Puria strategy, description, guidelines, indicators, settings and the rules to read the trading signals.
- A practical example of trading with this trading system.
- Advantages and disadvantages of the Puria Method. My own opinion on strategy profitability.
The Puria Method trading strategy: essence, indicators, practical application
The strategy became famous in late 2010 when the Expert Advisor developed by Andrey Perfilov won one of the trader contests. Remarkably, Google doesn’t provide any information about Perfilov himself, so, he may not exist at all, and this may be a legend.
According to the developers, this is a short-term scalping day trading strategy that can yield about 50 points a day and more. For example, your deposit is $10 000. Using the leverage of 1:10 you can trade a position of 1 lot ($100 000). 1 pip in this case will be $100 000 * 0.0001 = $10. This means that the strategy the Puria Method should yield about $500 a day or $10 000 a month with 20 working days. Some forex traders claim they have a daily profit of 1500-1700, and there is just a single losing trade in 7-8 trades entered. However, concerning 5- or 6-digit quotes, such a profit is questionable.
Tell me, do you believe in the 100% return per month? I personally don’t. It is arguable if one can earn so much, for example, one person will hammer 10 nails, while another one- 50, both having the same hammer. The matter us in the skill of adjusting the setting and testing the trading system. But still, if it were so profitable and easy, everybody would have already been a millionaire.
How to trade with the Puria Method: Theory
In terms of the indicators used, there is nothing innovative. The idea is unique because the standard tools are well-combined with an optimal set of settings and adjusted to take profit and stop loss, which is presented as a table for each currency pair according to their volatility range trading.
Basic information about the Puria Method:
- This is a scalping strategy, so one of the most important conditions that the broker should offer a minimum spread (0.5-1 pip), and it won’t do for long term or positions trading.
- The strategy suggests trading multiple currency pairs. Otherwise, it is impossible to gain those 50 pips a day claimed.
- The parameters of indicators are the same for each currency pair. The developer claims they are universal.
Almost in all sources, I have come across the same variants of settings, which seems a little strange to me. The strategy has existed for almost ten years, hasn’t there been a need to optimize it at least once? Here are the settings offered by the strategy developer:
Indicators set to trade with the Puria Method
1. MA: Period = 85, Method - Linear Weighted, apply to = Low (the bottom of the candlestick shadow). Color – red.
A reference: LWMA is a Linearly Weighted Moving Average. This is a moving average calculation that more heavily weights recent price data. The most recent price has the highest weighting, and each prior price has progressively less weight.
2. MA: Period = 75, Method - Linear Weighted, apply to = Low. Color – red.
3. MA: Period = 85, Method – Exponential (standard EMA), apply to = Close (the closing price of the candlestick). Color – yellow.
4. MACD: Fast EMA = 15, Slow EMA = 26, MACD SMA = 1, apply to = Close.
I recommend saving the template so that you won’t have to custom the setting each time. You need to right-click and select the “Template- Save template”.
Rules to enter a Long Trade:
- Yellow EMA crosses both red LWMAs upside.
- MACD closes at least one bar above zero a level.
Entering a short trade:
- Yellow EMA crosses both red LWMAs downside.
- MACD closes at least one bar below a zero level.
The entry signals are similar to the Alligator which also employs three MAs. MACD is a supplementary tool that indicates the market sentiment prevailing at the time.
A stop loss is set a distance of about 15 pips, but in theory, the stop loss is rarely hit. Another variant to set a stop loss is a little far from the local extremes. According to another version, you don’t need a stop loss at all, as the strategy suggests trading in a short timeframe. But the market can feature a sudden volatility surge or a slippage, so it is better to set stop losses even for a day trader.
As for the suitable timeframe and a take profit for a particular currency pair, the strategy developer suggests referring to the following table:
| Currency pair | Timeframe | Take Profit |
| EUR/USD | M30 | 15 pips |
| GBP/USD | M30 | 20 pips |
| CAD/JPY | M30 | 20 pips |
| EYR/JPY | M30 | 15 pips |
| USD/JPU | M30 | 15 pips |
| USD/CHF | M30 | 10 pips |
| AUD/USD | M30 | 10 pips |
| AUD/JPU | M30 | 15 pips |
| USD/CAD | H1 | 20 pips |
| EUR/CHF | H1 | 15 pips |
| EUR/GBP | H1 | 10 pips |
| CHF/JPY | H1 | 15 pips |
| NZD/USD | H1 | 25 pips |
Already concerning this table, there is a reasonable question, why do many sources refer to this strategy as scalping? The take profit level corresponds to day trading strategies, timeframe doesn’t refer to scalping at all.
Another question frequently asked by beginner trades. If the Puria Method is so profitable, why can’t one use it at all the recommended currency pairs simultaneously? It is a common error of those who think only about making money to ignore money management. The price for one lot of the EUR/USD pair with the lot volume of 0.1 is 100 000 * 0.1 * 0.0001 = 1 USD (for the pairs where the USD is the base currency, i.e. in the first place, the formula of the lot price is different, (1 point*market price of the lot)/market price. If the stop loss is 15 pips, a potential loss will be $15 for one trade of one pair. It can be OK for a deposit of $100o, but a deposit of $100 will be ruined.
A piece of advice. Before you launch a trading robot or enter multiple trades, calculate the risk that won’t devastate your deposit. Next, count the lot volume and the distance to put the stop loss based on the risk amount you can accept. That is the risk level rather than a potential profit that should be the basis to develop your trading strategy.
The Puria Method: Practice
To show you the strategy working in practice, as long as some peculiar features of the Puria Method, I will enter two trades for the pairs of EUR/USD and the USD/CHF, deliberately deviating from the basic recommendations, I also entered a USD/CHF trade that meets all the recommendations by the strategy developers.
1. EUR/USD. The first is the EUR/USD trade entered in the M30 timeframe. At first, I tried to visually assess the signals’ efficiency. I want to specify in the beginning that the fourth digit after the comma, although the quote is written in five digits. At the time of writing the article, there was a good signal in the chart, based on which I entered a trade, though a little late.
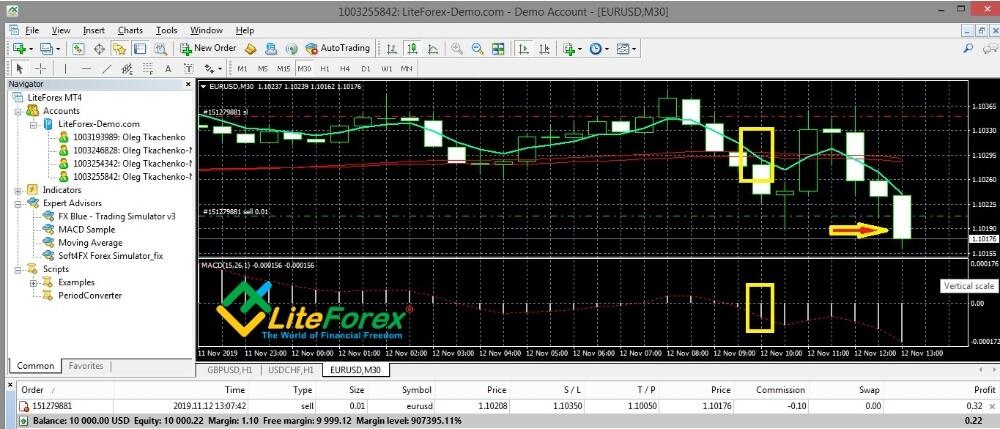
Yellow boxes mark the meeting of all conditions, the blue fast MA crosses the two slow MAs that are red, the MACD painted a bar below zero. At the next bar that is rising (with a long shadow down), one should have entered a trade.
I will repeat myself, I was a little late to discover the signal, so I entered a trade at the bar marked with the arrow (5 pips lower, the take profit is only 10 pips, instead of 15 ones recommended by the author); so, the red dotted line (a stop loss) is for this bar. If I entered based on the first signal, the stop loss would have been at least 5 pips higher than it is. Differently put, although the price goes up after I have entered the trade, it moves for just 8 pips, and the stop loss is not hit. I leave the position open and will return to it later. Now, I suggest we look at the history.
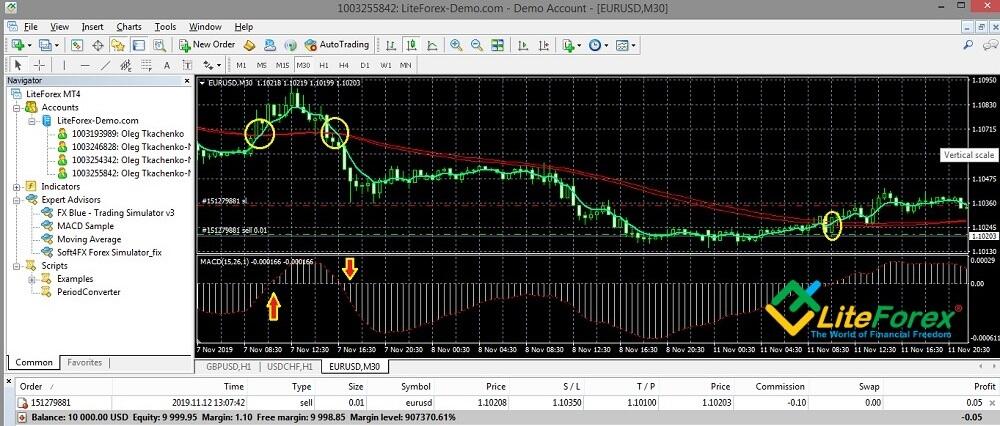
Before, for this currency pair, the signals have appeared three times during the recent week. In the first two cases, the MACD pained the confirming bar too late. If a trader had waited until it appeared, the trade would have entered when the price had covered about 50% of its way already. But even opening a position after MACD paints the bar at the light level, the trader would have gained about 10 pips in all the three cases. In general, it is quite well, taking into account that there have been no reversals in the direction of a stop in all three cases. All trades would have been closed during the same day they were opened.
This snapshot displays an example of a losing trade. However, an attentive trader would have closed it in four or five candlesticks after it was entered, without waiting for the stop to work out.
2.USD/CHF. Now, I’ll address the second chart, the USD/CHF. Here, on the thirty-minute USD/CHF chart, the situation is similar. The strategy doesn’t work in the sideways trend, but the sideways trend itself is clear. There are losing trades, but a couple of trades out of the last 10 winning trades could have yielded more than 50 pips a day.
For the sake of the experiment, I do not follow the developer’s recommendation and switch to the hourly chart for the USD/CHF pair instead of the recommended M30 timeframe. I discover a signal, at the MACD second bar, I enter a long trade with a take profit of 10 pips and a stop loss of 15 pips (1-1.5 pips of difference in the parameters set due to the slippage).
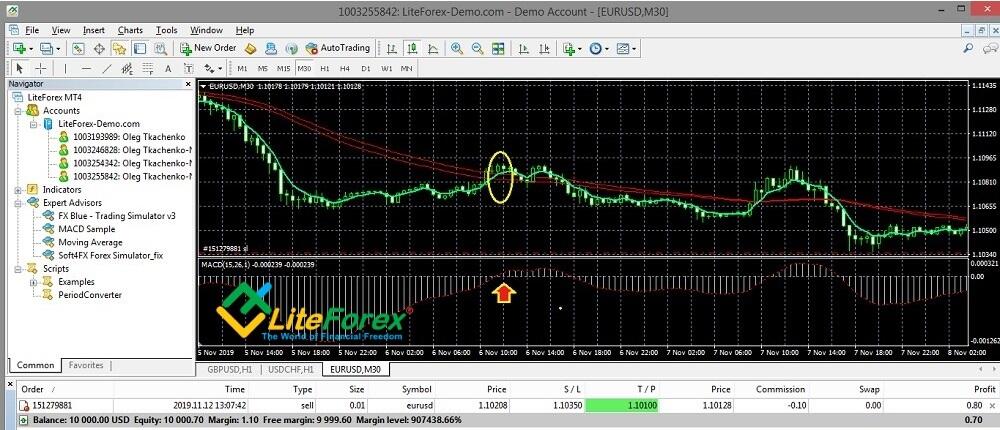
The result of the two positions. The USD/CHF trade entered on the hourly timeframe is losing. If I followed the author’s recommendation concerning the M30 timeframe, I would see that it makes no sense to enter this trade, this proves that one should strictly observe the rules. The trade EUR/USD closes with a take profit, which is clear from the screenshot below.
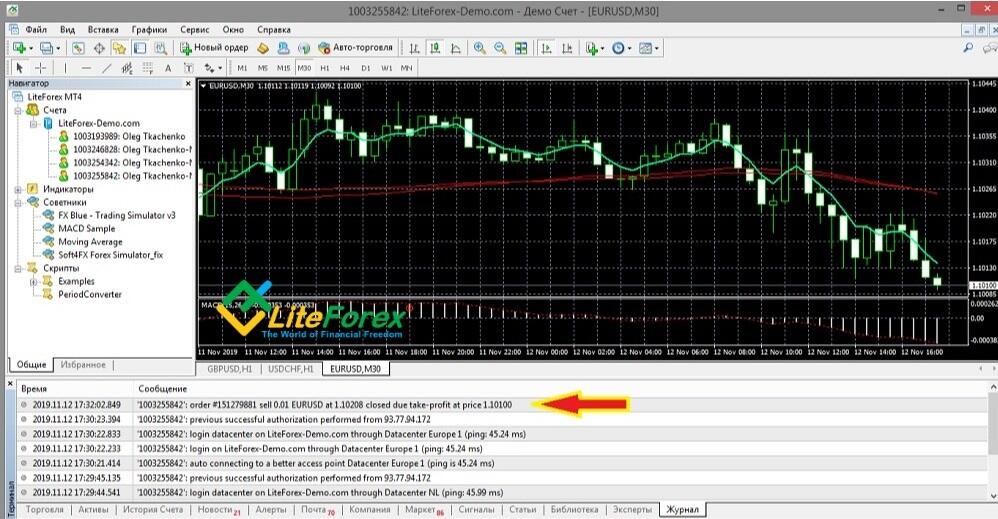
Concerning the USD/CHF pair, I violated the strategy rule, so the reasons for the loss are obvious. With EUR/USD trade, everything is done following the recommendations. The total result: although I entered the trade only at the third down bar (with a delay of 5 pips), the trade still closed at a take profit. It is also clear that there was a short correction that put the price to the entry-level at some point. It is enough to wait it through and take the profit from the price drop further. I will again repeat myself, at least a few minutes in each half an hour, I had to be in front of my computer, monitoring only two positions.
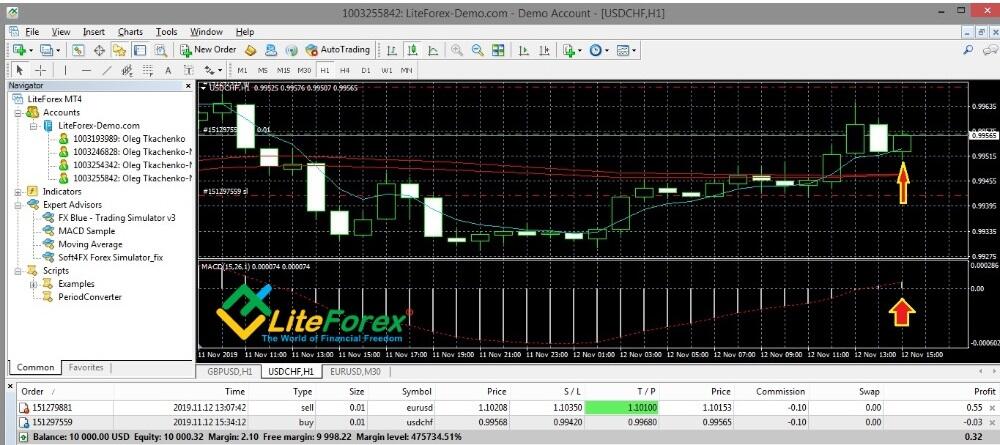
3. USD/CHF with all conditions met. There is emerging a signal in the 30-minute time frame: MACD starts painting a bar below a zero level, the fast MA already crossed the slow MAs.
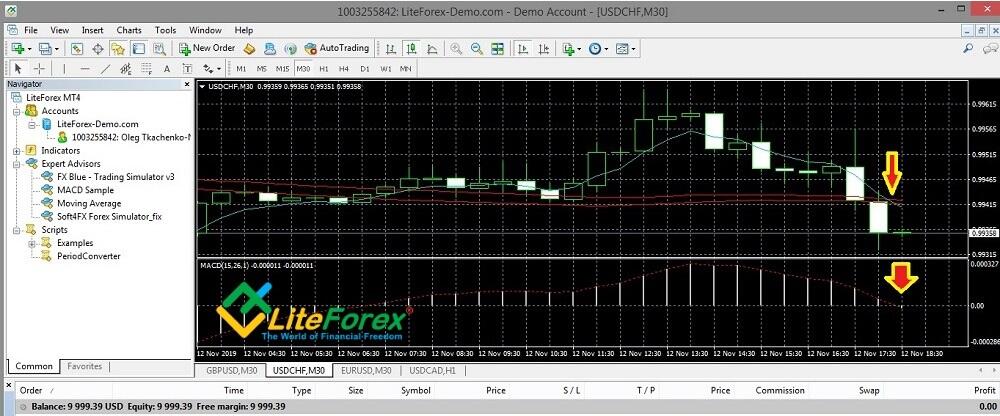
According to the recommendations, you enter a trade when the oscillator’s bar closed. Forex doesn’t like haste, a half-complete bar might eventually turn out into an opposite one; and the fast MA, after crossing the levels, might move back. It is better to enter a trade at the next bar following the closing of the signal bar after the fast MA crosses the other two. In this case, it would have been enough to look at the longer timeframes to see a clear downtrend emerging.
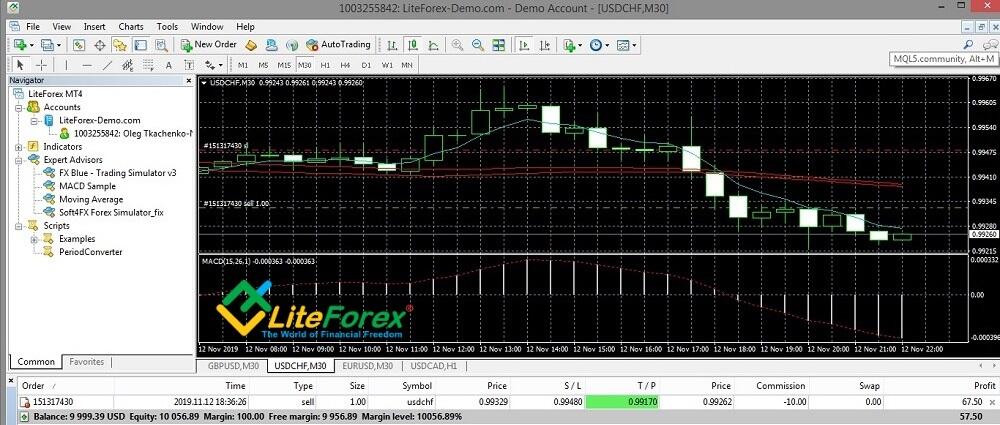
This screenshot shot shows that the price continues moving down. The green dotted line is the entry-level, red dots mark the stop loss and the take profit. The trade of 1 lot has already yielded more than $55, including spread.

And there is the total result of all the three trades. One USD/CHF trade is exited at stop loss, the other two trades are exited with a profit at a take profit. As the third trade was entered in the evening, but all signals indicated the trend should continue, so it was left in the market. Although the swap (a fee for rolling the trade over to the next day) was $13.59, the profit was $160 compensated for all the commission fees and losses.
My notes:
- A think a profit of 15 is an ambitious claim, especially if one enters the trade one or two bars following the signal. So, I recommend you to be in front of your computer all the time, monitoring your positions in real time, and exit your trades manually at any sign of a possible reversal (two consecutive reversal bars).
- The trades are most commonly exited during the same day as they have been entered. But it takes at least 5 or 6 bars to complete on average, which is about three hours for a 30-minute timeframe. If you enter a trade in the evening.
- On average there is one losing trade and 4 winning ones. If you do not monitor the chart, one losing trade will ruin the profit of two or three winning ones. If you want to improve your trading performance, exit the trades manually.
- The settings are optimal, in fact. Any shift of the period of slow MAs by 10 (85 and 65 or 95 and 75). a mismatch of their readings with MACD. However, I think that for each currency pair they can be adjusted. Or you can learn to intuitively, “by eye”, determine the signal, without waiting for its confirmation.
- It makes no sense to set long timeframes. On the H4 interval, the signal was delivered once or twice per month, and it wasn’t always accurate.
There has already been designed a trading robot based on the strategy, you can download the template here. An attempt to test it in the MT4 tester on 2 pairs in 2019 was unsuccessful, by the end of the period, in both cases, there was a loss. The matter must have been in the settings, which obviously do not suit for automated strategies. As I wrote above, you can minimize the loss by manually closing the position without waiting for a stop, as well as by increasing the length of the take profit in case of a strong trend. The Expert Advisor does not take all this into account, that is why the profitable trade is “cut off” almost at the very beginning and closing at the stop profit ruins already small profit.
There are several suggestions for optimizing the robot on the trading forums. For example, as a slow MA, there used not LWMA, but EMA. Another tip is to change the MACD settings, choosing them so that the oscillator is not late or ahead of the moment of crossing the MAs ones. So, there is a wide scope for experimentation.
Advantages of the Puria Method
- You can make more profit than you planned. Is it reasonable to put a take profit at 10-20 if indicators allowed to enter a trade at the very beginning of a strong trend? With the average volatility of a currency pair of 50-80 pips, you can gain even more. If you are not too greedy and employ a trailing stop. According to the recommendation, ideal daily volatility is 60 pips and more.
- You can combine the Puria Method with other trading strategies or trade several currency pairs with the Puria Method forex strategy. Signals are relatively rare, in the M30 timeframe, all conditions for one pair are met 1 or 2 times a day.
Drawbacks of the Puria Method
- The settings are basic, and it is better to adjust them to the constantly changing situations in the forex market. That is, if the results are worse, you need to adjust the customs and run the strategy in the MT4 strategy tester. You can learn more about when you should optimize the strategy in this article.
- The strategy suggests constant monitoring multiple charts, which beginners may find difficult.
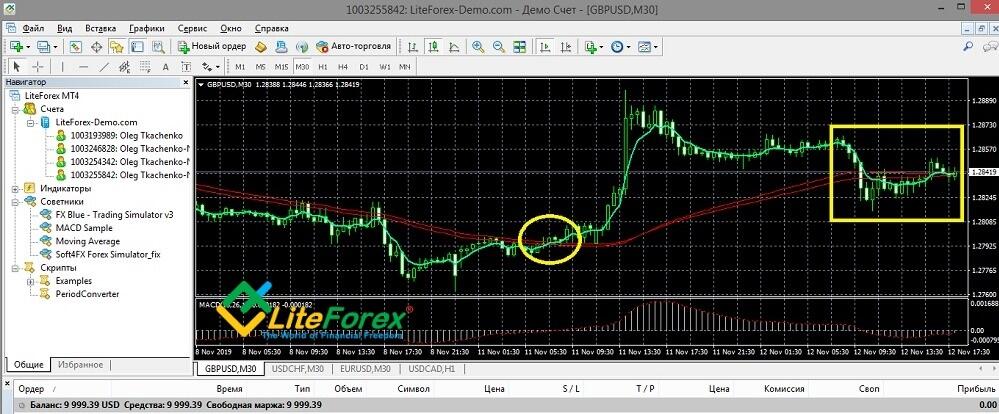
- This is a trend trading strategy, so it works only in a highly volatile market with clear up or down price moves. In flats and at the moment of important news releases, the signals are invalid. The trading flat is displayed in the screenshot below. Besides, it won’t suit all kinds of trading styles.
Conclusion
There is no need to invent a bicycle again. Common, time-proven, indicators, rightly combined and correctly adjusted parameters may yield as good results as complex trading systems. The Puria Method is a good example of such a strategy, simple and profitable at the same time. The strategy is not ideal, but it is worth trying. It can be especially helpful for beginner traders. It teaches not only using tools of technical analysis in trading correctly but also following the risk management, and it trains one’s attention as well. I welcome any constructive criticism and notes in the comments, as well as any additions, amendments and personal opinions.
P.S. Did you like my article? Share it in social networks: it will be the best "thank you" :)
Useful links:
- I recommend trying to trade with a reliable broker here. The system allows you to trade by yourself or copy successful traders from all across the globe.
- Use my promo code BLOG to get a 50% deposit bonus on the LiteFinance platform. Simply enter this code in the appropriate field when funding your trading account.
- Telegram chat for traders: https://t.me/litefinancebrokerchat. We are sharing the signals and trading experience.
- Telegram channel with high-quality analytics, Forex reviews, training articles, and other useful things for traders https://t.me/litefinance

The content of this article reflects the author’s opinion and does not necessarily reflect the official position of LiteFinance broker. The material published on this page is provided for informational purposes only and should not be considered as the provision of investment advice for the purposes of Directive 2014/65/EU.
According to copyright law, this article is considered intellectual property, which includes a prohibition on copying and distributing it without consent.