The Indian rupee versus the U.S. dollar has hit a fresh low on March 3. Among the major reasons, there are new cases of coronavirus, the outflow of overseas investment capitals and the strengthening of the U.S. dollar. But the real reasons are much more complex. Read on and you will learn what is really going on with the Indian rupee exchange rate based on fundamental and technical analysis.
The Indian rupee hits all-time low versus the U.S. dollar
On March 3, the Indian rupee crashed against the U.S. dollar, breaking through level 73, thus hitting a new all-time low. Although the Indian stock markets have a little stabilized after the crash amid the coronavirus outbreak, the local currency continues the downtrend started more than a week ago. The previous record lows were recorded on the eve of March 2 (72.91) and on February 28 (72.57). The following rises turned out to be just local corrections.
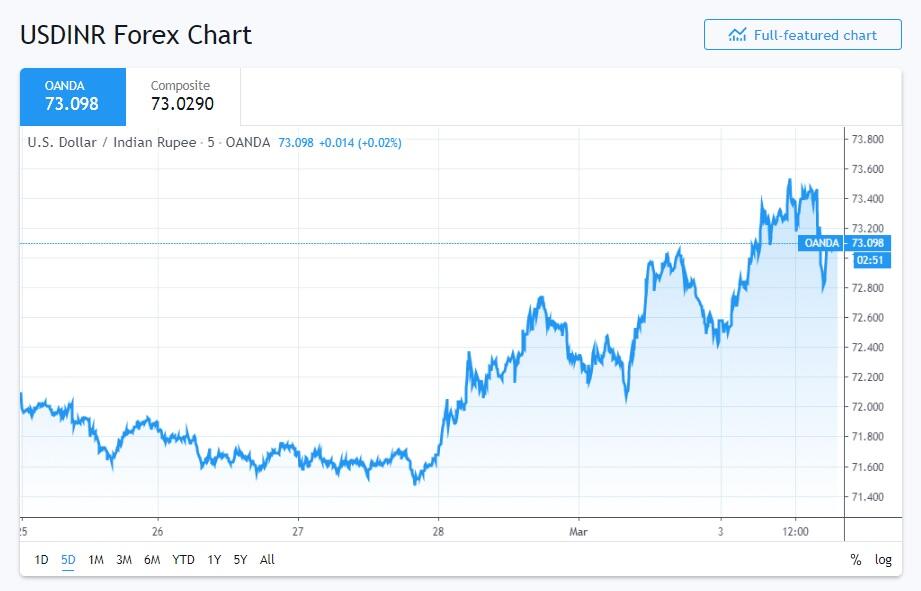
Over the past month, the rupee has depreciated versus the dollar by about 3.16%, which is one of the worst crashes over the past few years.
The major factors that pressed down the rupee value are:
Panic resulted from the spread of the coronavirus outbreak. After Italy was reported as a new site of contamination, the global stock market has lost over $ 5 trillion, partially followed by currency markets trading the so-called “exotic currencies”. The situation was fueled by the news that coronavirus found its way to India. Although there are yet only 5 people infected (the death rate is little over 3%), the news was enough to support the downtrend. According to the media, there were registered two new cases of infection, in Delhi and Telangana, on Monday, March 4.

Strengthening of the U.S. dollar. On Tuesday, the Fed made an emergence rate cut by half of a percentage point, the Fed’s benchmark target range is 1.00%-1.25%. This has somehow halted the further strengthening of the U.S. dollar, but it has had a little effect on the dollars to rupees exchange rate.
Reallocation of the foreign capitals away from the Indian economy. An early analysis of the exchange trading session data indicates that overseas investors sold the shares of the Indian companies worth about $500 million and the government bonds worth about $400 million. This also strengthened the dollar to rs.
According to the WHO, the number of daily coronavirus cases decreased in early March. Global stock indexes and major assets of commodity markets grew a little on Tuesday, giving hope that the global economy should start recovering soon. Nonetheless, the Indian rupee went on devaluing at the same pace. Analysts say the coronavirus has only accelerated the INR decline, without being the original reason. The problems stem from much deeper, confirming the system problems of the Indian economy. It means rupee falls against the dollar naturally, and the fresh record lows will be hit following a short retracement.
On the other hand, economists say there no reasons for panic, the main factors restraining inflation stemmed from the growth of USD to Indian rupee:
Oil prices. India is one of the biggest oil importers. As a result of the supply chain disruptions, problems in the transport industry, a slump in production, the global demand for oil has contracted. Therefore, the Brent price has been more than 12% down over the past two weeks, at $50 per barrel.
The Reserve Bank of India's efforts to support the rupee. As, amid the coronavirus and the outflow of foreign investments, the rupee falls versus the dollar faster than it was expected, the Reserve Bank of India may take some monetary measures to anchor the inflation. It may partially satisfy the domestic demand by selling dollars to rupees from its FX reserves, thereby mitigating the rupee fall.
The situation with the US dollar to Indian rupee exchange rate remains unstable. Positive signals, giving them hope for the rupee strengthening, are canceled by Indian rupee negative news. The USDINR daily volatility is too high to make any somehow accurate forecasts, but in general, the rupee to dollar outlook is rather gloomy.
The Indian rupee to the U.S. dollar exchange rate: a brief historical overview
The problems of the Indian economy started about 10 years ago, and since then, the rupee down trend has been developing, only interrupted by short upward corrections from time to time. The first rupee dramatic crash occurred in 2013 when the Indian currency lost about 16% just in a few months. Two years before the inflation surge, some inefficient economic reforms failed to solve the budget deficit problems. Following the inflation, overseas investors started withdrawing their capital from the country? And the local people were buying out gold (traditional Eastern love for golden jewellery, exaggerated by the crisis).
The budget deficit problem resulted from the shift in the trade balance. The economic growth was supported by the exports of services and natural resources, the country’s economy depended on their prices. All this was accompanied by vote-winning social programs that didn’t solve the problem of low employment. The rupee down fall hit mostly poor and middle classes of the population, which were the majority.
The Indian government said the foreign factors were the reasons for the further rupee devaluing versus the dollar. The Fed’s policy to support the emerging markets should have supported the rupee value. Therefore, the end of QE programs would mean the crash of the stock and currency markets in the developing countries. However, the Indian economic problems result from the foreign trade deficit that isn’t managed even through the additional import tariffs.
At present, the Indian rupee has hit the record low against the U.S. dollar, and it will hardly recover unless there are radical economic reforms or an economic miracle.
Let's make a technical analysis for USD/INR. I asked my colleague in this blog, Mikhail Hyipov, to help me with this.
Indian rupee: forecast for 2020 and further
![]()
Dear friends,
The Indian rupee’s sharp movements have attracted much attention lately amidst general calmness. Today I am doing an analysis of USD/INR, starting from the global scenario and ending with the forecast for the current year. In my analysis, I will use the Elliott wave breakdown, analyze the supercycles of the USD/INR pair and the projection of the candles in the price chart, as well as build a trading plan and provide signals.

The chart above shows India’s national currency fall by 3% within a few days. It’s not a secret that the Indian Central bank is in favour of soft monetary policies and doesn’t prevent, at the very least, the national currency from falling in order to get a competitive advantage in the global market for goods export.

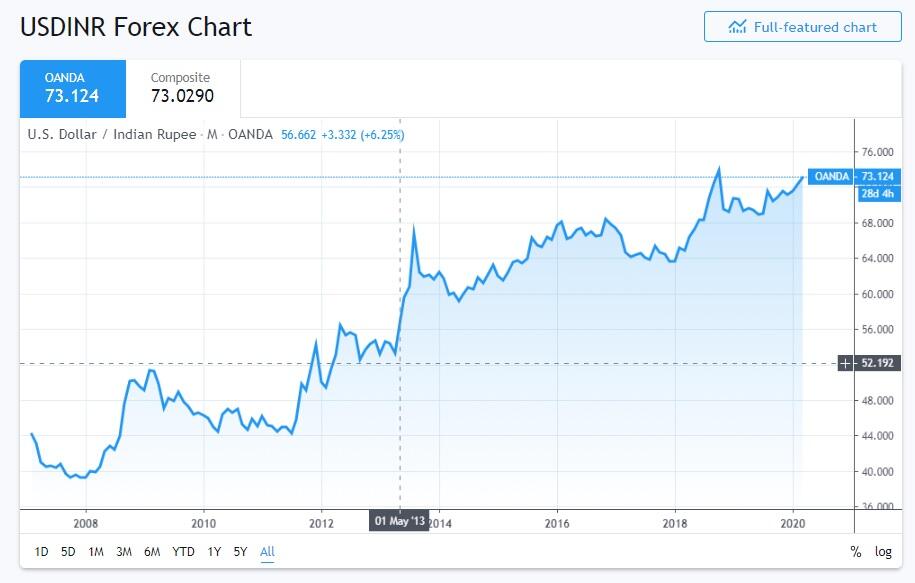
Looking at the weekly chart above, we see that such sharp movements of the rupee aren’t a rare thing and the descending trend has been obviously there for 10 years in general. To estimate INR’s prospects against the dollar, let’s conduct end-to-end technical analysis using wave patterns and Tom DeMark’s tools.

The 12-month chart above clearly shows 3 waves. The first one started in the 70-s and ended in 2002. Next, the market had traded sideways for a few years and a new growth wave began. Obviously, we’re in the third growth wave now which has to be the longest one according to the classics of wave analysis. The exception may apply only to a wave pattern where the first wave is extended. In that case, the length of the third wave won’t exceed the first wave and the growth limit of the third wave of the supercycle will be located at 86 INR to 1 USD. Considering INR’s weakening rates, it may happen in 2027.
If the price reaches that level, we may say a certain psychological barrier is overcome. The confidence in the national currency will be low, which will only boost sales and let the rate reach 100 rupees to 1 USD. These are faraway hypothetical prospects. To make a more accurate forecast, let’s check the third wave of the supercycle.

The chart above visualizes one of the eventual wave patterns. We see a combination of two 5-wave impulses with a corrective zigzag in the middle. Based on this pattern, the approximate peak of the current third wave may be at around 1.618 of the first wave’s length, which is 87.5 rupees to 1 USD. As stated above, this level is supposed to be the peak of the third wave of the supercycle and the fifth wave will be therefore truncated and unable to overcome a new historical maximum. Afterwards, it will consolidate in the fourth wave of the supercycle under the bears’ pressure
This forecast may apply to a few years, but what should be expected this year?

A version of the wave pattern (violet lines) of the supercycle’s third sub-wave (green lines) is shown in the chart above. The grey rectangle frames the year 2010 within 1 annual projection of the candlestick. Two very important key levels can be seen in this chart. The first level is the peak of the first wave. It’s extremely important to break out this value of 74.6 rupees and consolidate above it for the development of a 5-wave impulse to be confirmed. The other important level and the third wave of the supercycle is the thin red line which is the trend line here and the bulls’ support. A breakdown of this trend will demand a revision of the whole wave pattern, including the analysis of supercycles.

Let’s zoom in to understand the most likely scenario for 2020.
We see that the maximum of the annual candlestick’s projection is located near the first wave’s peak. As a consequence, it’s very unlikely that the rate will exceed 74.5 rupees to 1 USD this year. On the other hand, TM differential arrows point to a sideways movement without any clear trends, which also hints at a sideways trend this year.
I estimate that the maximum won’t go above 74.5 this year, then we may see a natural correction within 74.50 - 72.00. Once the rate falls below the traded channel of 70 - 72 INR/USD (which by coincidence is the tolerance zone of the annual candlestick’s projection), the whole wave pattern will be broken and will require a revision starting with the uppermost level of supercycles.
The time will show the way it’s gonna be. I’d like to remind you that all the materials are provided for educational purposes only. They aren’t financial advice and don’t guarantee any profits. All trading decisions you make are your responsibility only.
Take care of yourself and your money!
Subscribe to always get the latest articles!
FAQs
When the Indian rupee falls against the U.S. dollar, the costs of imports to India increase, foreign capital inflows decrease and inflationary pressure mounts up.
There are several reasons as to which the Indian rupee falls against the U.S dollar. These include coronavirus-caused panic, strengthening of the U.S. dollar and the recent outflow of foreign capital.
P.S. Did you like my article? Share it in social networks: it will be the best "thank you" :)
Useful links:
- I recommend trying to trade with a reliable broker here. The system allows you to trade by yourself or copy successful traders from all across the globe.
- Use my promo code BLOG to get a 50% deposit bonus on the LiteFinance platform. Simply enter this code in the appropriate field when funding your trading account.
- Telegram chat for traders: https://t.me/litefinancebrokerchat. We are sharing the signals and trading experience.
- Telegram channel with high-quality analytics, Forex reviews, training articles, and other useful things for traders https://t.me/litefinance
The content of this article reflects the author’s opinion and does not necessarily reflect the official position of LiteFinance broker. The material published on this page is provided for informational purposes only and should not be considered as the provision of investment advice for the purposes of Directive 2014/65/EU.
According to copyright law, this article is considered intellectual property, which includes a prohibition on copying and distributing it without consent.