

Gold trading strategies enable traders to grow their capital using proven tactics. According to data from the World Gold Council, gold remains one of the most liquid assets, and since financial markets operate nearly around the clock, it offers unique profit opportunities for those ready to start trading.
Trend-following, breakout, intraday, and swing trading strategies are considered some of the best trading strategies in the gold market, especially when combined with volume analysis and momentum indicators. To trade gold successfully, traders should develop a solid grasp of market structure, learn the unique behaviors of gold as an asset, and adhere to risk management rules. This article examines the essential aspects of the XAU/USD currency pair and provides advice on trading gold.
The article covers the following subjects:
Major Takeaways
- The main strategies for trading gold can be divided into trend-following and counter-trend strategies, as well as scalping, short-term, intraday, and long-term strategies.
- XAU/USD often shows clear price trends. These trends can last for months or even years. Gold rises or falls in extended cycles influenced by macroeconomic factors such as interest rates and central bank policy.
- A trend-following strategy requires a trader to make a few key decisions: which timeframe to trade on, how to identify the trend, when to enter a position, where to place a stop-loss, and how to set take-profit targets.
- A breakout strategy is based on the idea that once the price of gold moves beyond a significant high or low, it is likely to keep moving in that same direction.
- Scalping strategies have regained popularity due to gold's high volatility, tight spreads, and lower trading costs.
- Swing trading gold is popular among medium-term traders who aim to find optimal entry points and hold positions for several days. Since gold often shows clear reversal patterns, including temporary pullbacks, traders can take advantage of these price movements.
5 Gold Trading Strategies for XAU/USD
This section covers the most effective trading strategies. All of them can be categorized as follows:
By trading approach:
- Trend-following strategies.
- Counter-trend strategies.
By holding period:
- Scalping strategies.
- Short-term strategies.
- Medium-term strategies.
- Long-term strategies.
- Investment strategies.
Effective gold trading methods include trend-following, scalping, and short-term and medium-term strategies.
Trend Following Strategy for Trading Gold
A trend-following strategy is the most popular approach to trading gold on Forex. In this market, trends are relatively easy to identify and often persist for extended periods.
Retail traders mostly trade futures or contracts for difference (CFDs), while institutional investors may also use spot gold and gold ETFs to gain exposure to the market. You can trade gold CFDs on the LiteFinance platform.
To trade with the trend, you need to:
- Open the gold price chart;
- Identify the trend;
- Set stop-loss and take-profit orders;
- Practice risk management.
We will use the 20-, 50-, and 190-period exponential moving averages (EMAs) to identify the trend. EMA 20 shows the short-term trend, EMA 50 the medium-term trend, and EMA 190 the long-term trend. When the gold price is below an EMA, the trend is considered bearish; when the price is above, it is bullish.
To avoid market noise, let's use the daily chart. However, you can also trade on other timeframes, from M5 to W1.
All three EMAs are added to the gold chart:
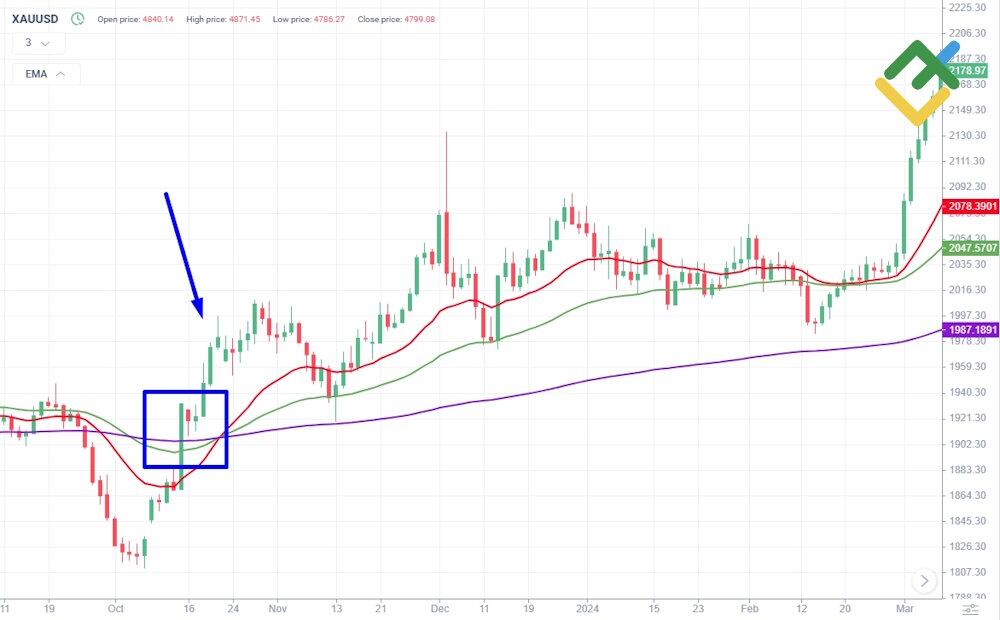
The chart shows that in October 2023, the price broke above all three EMAs and then settled at higher levels (indicated by the blue rectangle), signaling the start of a bullish trend.
As long as the gold price remains above the EMA 190, long trades can be considered:
- Wait for the price to drop to one of the three EMAs.
- Find a bullish Price Action candlestick pattern.
- Open a trade and set a stop-loss and take-profit order.
The first buy signal appeared on November 13, 2023:
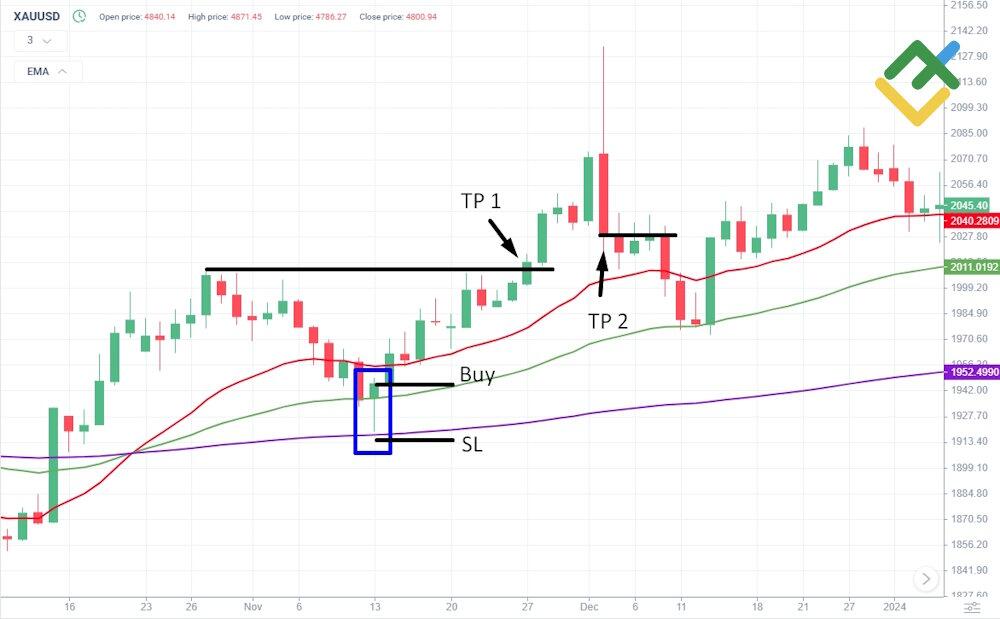
The first take-profit order was set at the previous swing high. The second one was triggered when an opposite price action signal appeared, in this case, a Bearish Engulfing pattern formed on December 4.
The next buy signal emerged on December 13:
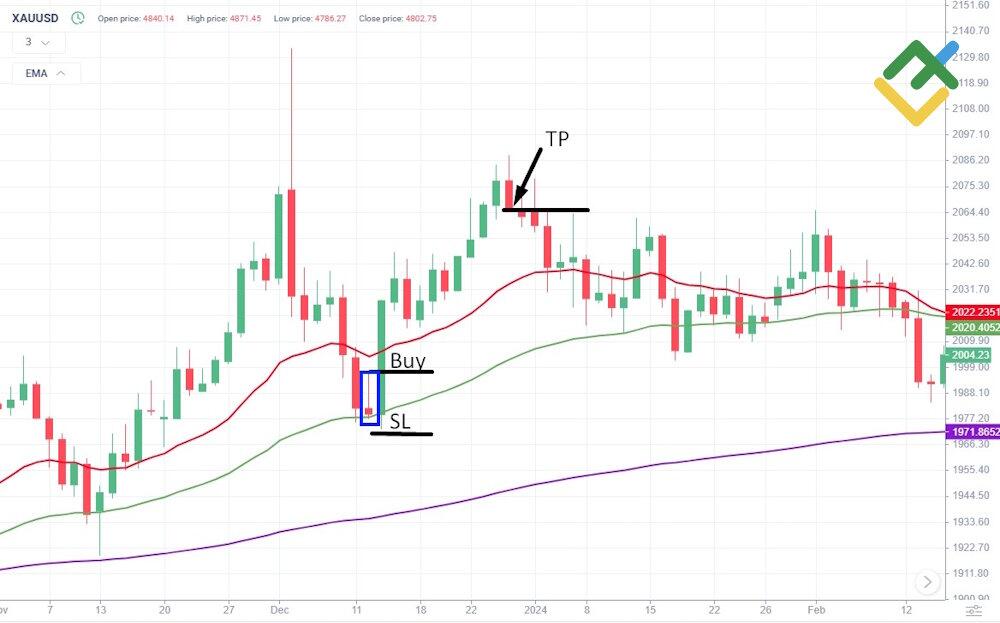
In this setup, a bearish pattern emerged before the price reached its previous high. Therefore, the trade was fully closed after the pattern developed.
Two more signals emerged on January 4 and 19:
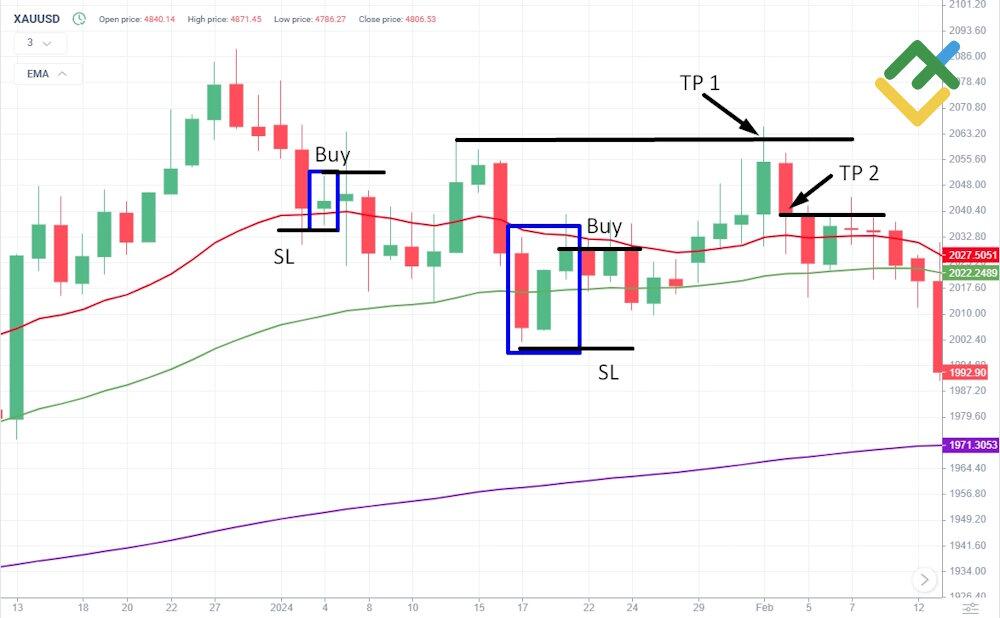
The first trade, marked by the Inside Bar, was stopped out at the stop-loss level. The second trade resulted in a small profit.
The last trade was made on February 23 using the Bullish Outside Vertical Bar (BUOVB) pattern:
The examples above show that the key condition is for the price to remain above the 190 EMA. After that, the price should pull back to one of the moving averages. Once the pullback is complete, monitor the market and wait for a Price Action pattern to form.
The Golden Cross and the Death Cross are often strong signals of a trend reversal. When a Golden Cross forms, the fast EMA crosses above the slow EMA, signaling a reversal. When a Death Cross appears, the fast EMA crosses below the slow EMA, giving a sell signal.
Notably, the uptrend that began in October 2023 is still ongoing. If you want to know what gold's price will be in the future, check out our gold price forecast for 2026.
Breakout Strategy
Breakout strategies are also highly effective. Gold often shows strong momentum, and when key levels are broken in the direction of the trend, the price tends to continue moving in that direction.
Let's stay on the daily chart. For technical analysis, we will use a 190-period EMA to identify the main trend and a 14-period RSI as a filter.
Key steps for trading gold on breakouts:
- Mark key highs and lows on the D1 timeframe.
- Wait for a breakout of a key extreme. This means the price should settle above the high or below the low.
- Open a long position when the price breaks above a high, trades above the 190 EMA, and the RSI is above 50.
- Open a short position when the price breaks below a low, trades below the 190 EMA, and the RSI is below 50.
- If the RSI is in the overbought zone between 70 and 100, do not open a long trade, as a price reversal is possible. Similarly, if the RSI is in the oversold zone between 0 and 30, do not open a short trade.
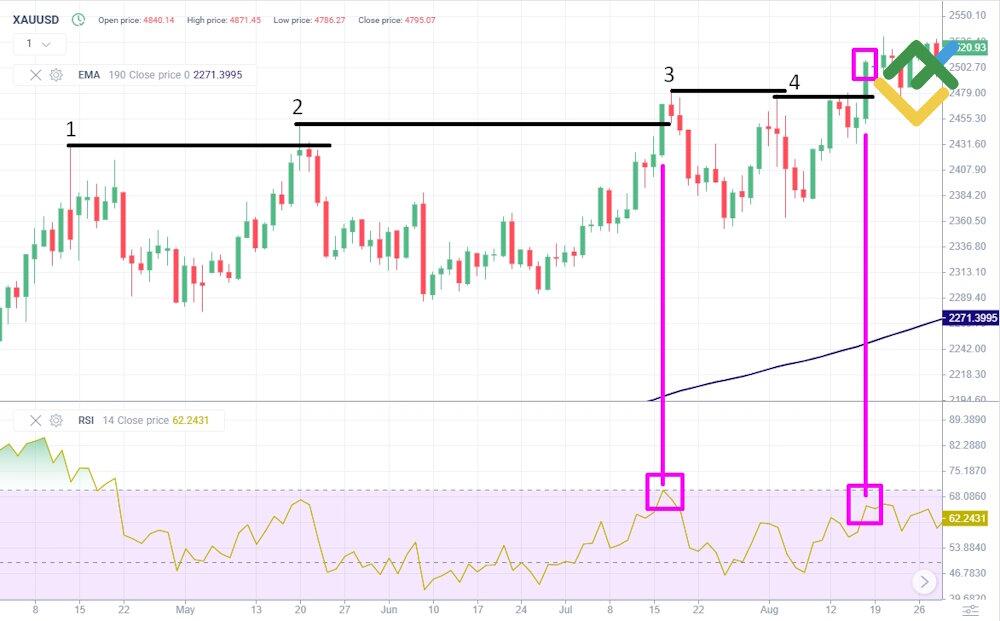
The chart above shows that the price is above the EMA 190, indicating an uptrend and opportunities for buying gold.
The numbered levels mark key swing highs on the chart. At point 2, the price breaks above the previous high (1), but there is no strong bullish close above the level, so the setup is skipped. At point 3, the price again moves above the previous high but quickly pulls back, with the RSI in overbought territory, making the signal unreliable. A cleaner setup appears at point 4: the price breaks above the previous high and holds above the 190 EMA, while the RSI is above 50 but not too high. This creates a more reliable opportunity to open a long gold position.
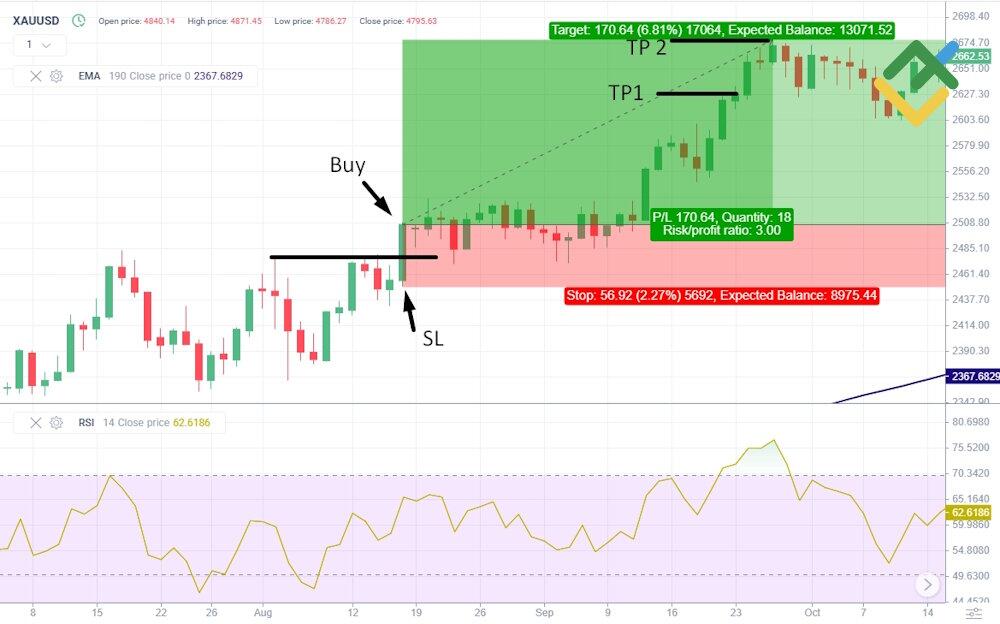
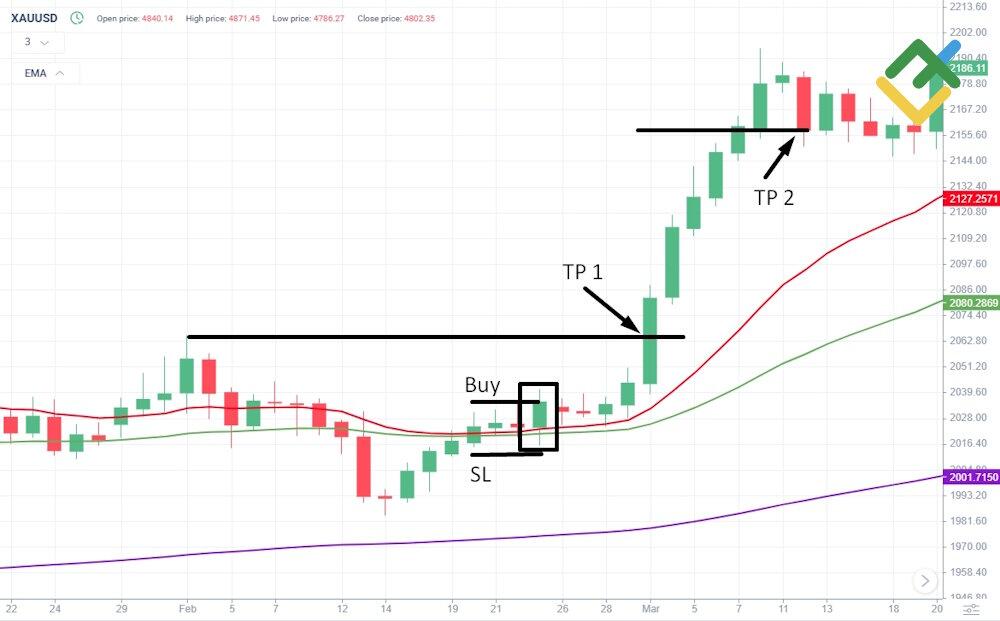
The first take-profit is set at a distance equal to two stop-losses, while the second is set at a distance equal to three stop-losses.
A stop-loss order is placed below the low of the breakout candlestick. If that candlestick is very small, the order is set below the nearest swing low.
This strategy is not tied to any specific timeframe. Breakout setups can be found on any chart, from the 5-minute to the monthly. The key is to clearly define your profit target.
Gold Day Trading Strategy
This section focuses on day trading XAU/USD.
Key steps for day trading gold:
- Identify the intraday trend through technical analysis.
- Use support and resistance levels, as well as Fibonacci retracements, to find potential entry points.
- Apply candlestick analysis to refine entries.
- Place a stop-loss order beyond the signal pattern.
- Take profit when the price moves a distance equal to twice the stop-loss.
Day trading example:
The chart below displays an upward trend that eventually reversed downward.
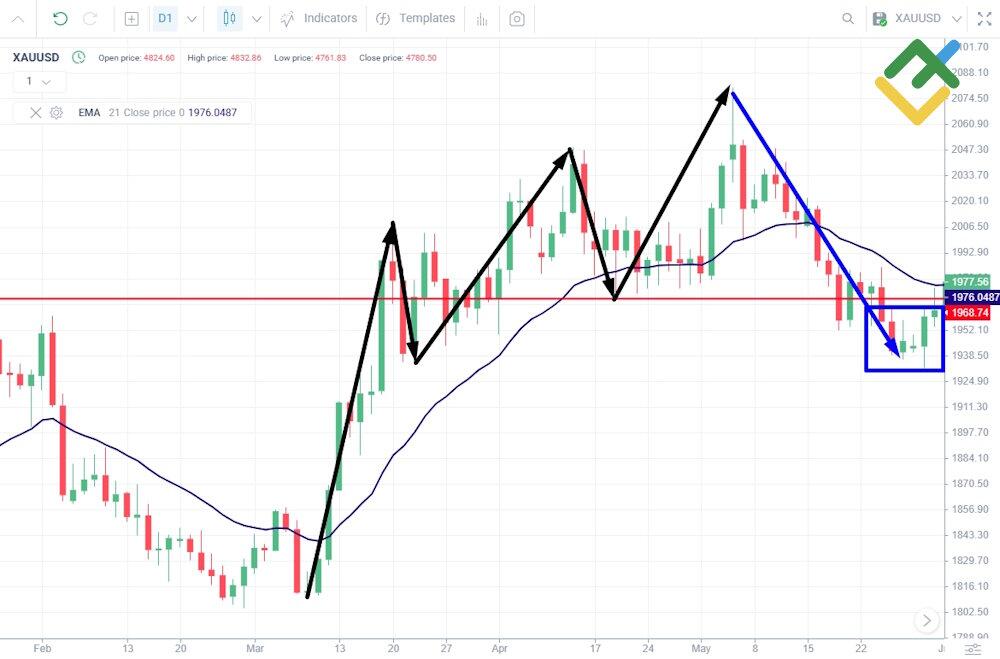
Let's identify the best entry points for selling gold:
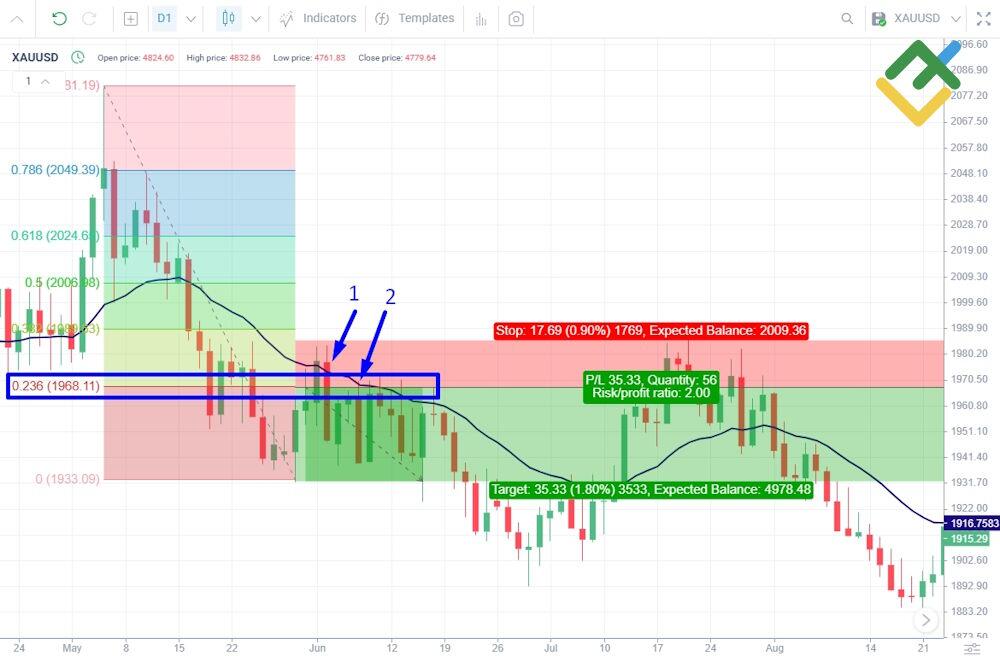
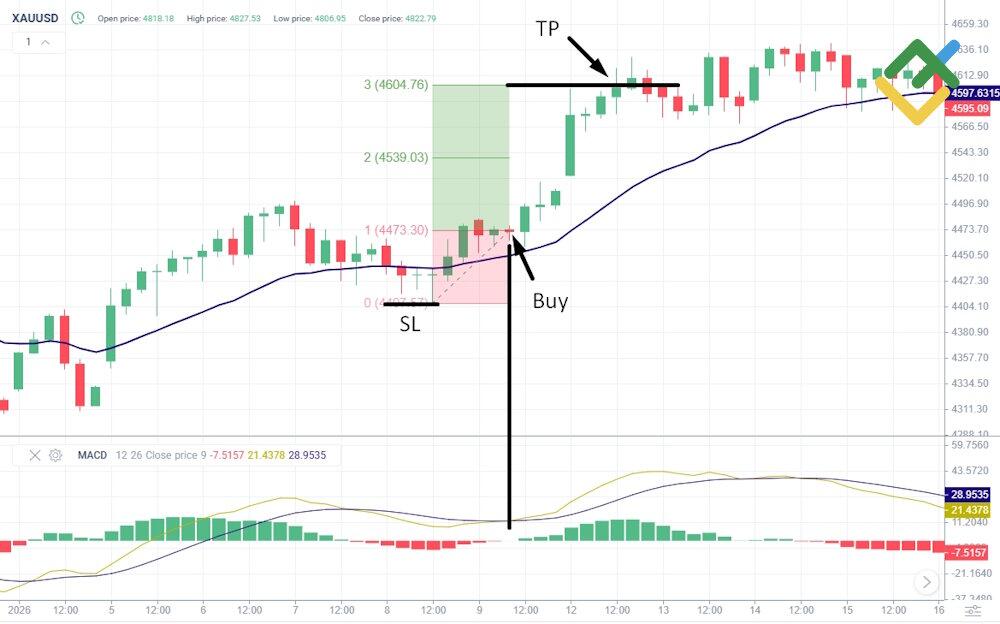
The price tested the 23.6% Fibonacci level. After that, a Bearish Engulfing pattern formed (1). A short trade was opened once the price returned to the 23.6% level (2).
Here's another example:
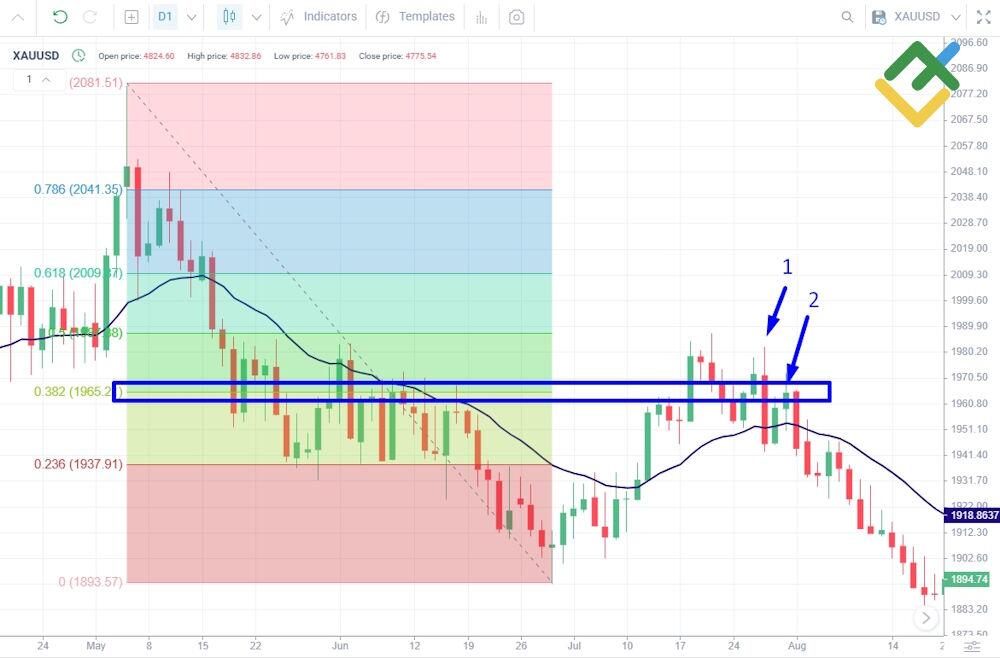
The market is in a steady downtrend. We apply a Fibonacci retracement to the chart and wait for the price to move back up to the recent swing high (1), watching for a signal in that area.
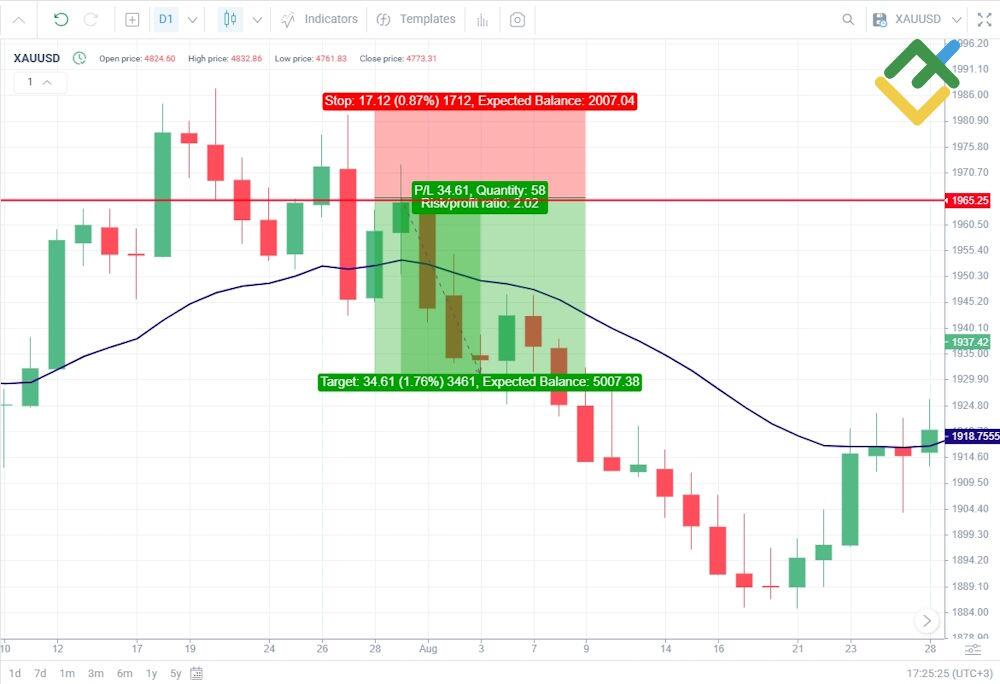
The signal comes from a strong impulsive candle, with no clear patterns beforehand. The strategy is to enter when the price returns to the 38.2% Fibonacci level (2). The trade setup is illustrated in more detail below.
Scalping XAU/USD
Scalping strategies have recently become more widespread in gold trading.
Based on this strategy, a trader enters as momentum begins to build and exits after capturing part of the impulse move. The entire trade typically lasts from a few seconds to a few minutes.
A scalper typically uses M1–M5 timeframes to spot short-term market trends and waits for either a quick pullback or a breakout of a recent high or low. Long or short positions are opened with tight stop-losses and quick profit targets. The goal is not to catch large trends, but to capitalize on small price movements multiple times during a trading session.
From a technical standpoint, traders often rely on the EMA line to gauge the prevailing trend and use indicators like Average True Range (ATR) to assess market volatility and momentum. Fundamental analysis is generally ignored due to the short trade duration.
Scalping rules:
- Trade during high-liquidity hours, when the market is most active, and price movement is strong.
- Strictly adhere to risk management principles.
- Take into account the spread and execution speed, as these costs significantly impact results when scalping.
Key steps:
- Identify the short-term trend on the M1–M5 timeframes using EMA 21.
- Wait until the price returns to the moving average, a key level, or a consolidation zone.
- Look for a pattern to enter the market or wait for an impulsive candlestick.
- Make sure that the 14-period ATR is rising.
- Place a short stop-loss just beyond a swing high or low.
- Lock in profits quickly, without waiting for a major price movement. In scalping, gold traders take profits when the reward-to-risk ratio is 2:1 or 1:1, aiming to improve their overall win rate over a series of trades.
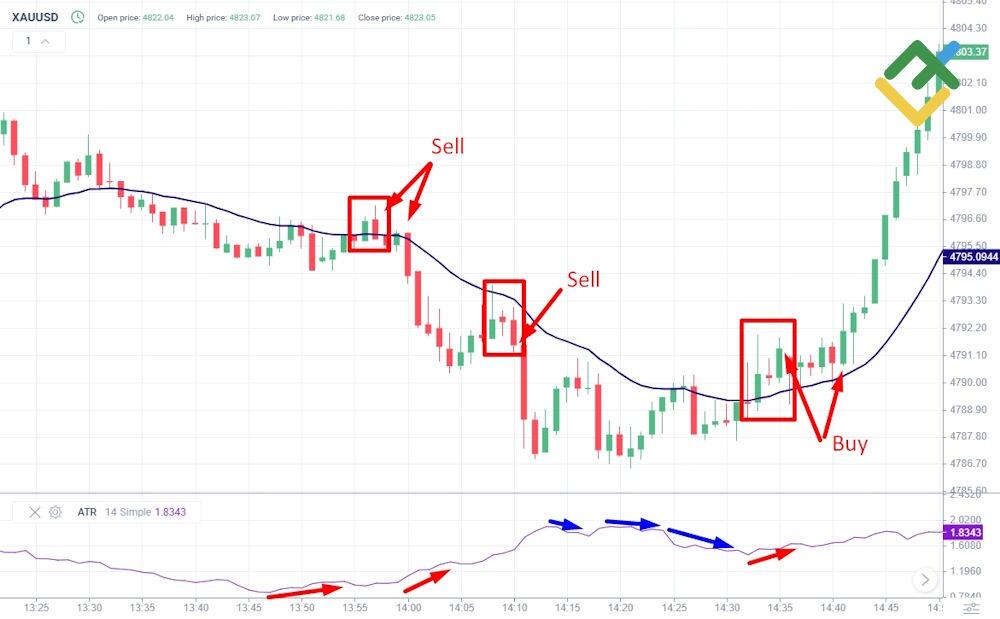
Take a look at the M1 chart above. The red rectangles and arrows highlight potential entry zones, where Price Action patterns or bullish candlestick signals appear. The red arrows in the RSI area show periods when the indicator is rising, providing additional confirmation for trades. The blue arrows mark declining RSI values, suggesting weaker momentum and less favorable conditions for entries. In all cases, the stop-loss is placed beyond the nearest swing high or low.
The main drawback of scalping is the strict discipline it requires. A couple of poor entries in a row, using position sizes that are too large, or trying to hold through a losing trade can quickly lead to significant losses, especially when trading with high leverage. For this reason, beginners are strongly advised to practice on a demo account before trading this strategy with real funds.
Get access to a demo account on an easy-to-use Forex platform without registration
Swing Trading Gold
Swing trading is essentially the opposite of scalping. This strategy focuses not on short-term price fluctuations, but on capturing the full development of a swing, which is a sustained directional move within a trend. The H4 and D1 timeframes are usually utilized.
In swing trading, identifying the primary trend is essential, as trades taken in the direction of the trend tend to have a higher probability of success. The 21-period EMA and overall market structure are commonly used to identify the trend, while the MACD indicator with standard settings often serves as a filter.
Key steps:
- Define the trend by analyzing EMA or the overall market structure.
- Wait for the price to pull back to EMA or a key level.
- During a pullback, the MACD histogram should change color.
- Open a trade in line with the trend.
- Place a stop-loss order at the nearest low or high and set a take-profit order at a level twice as large as the stop-loss.
Look at these examples:
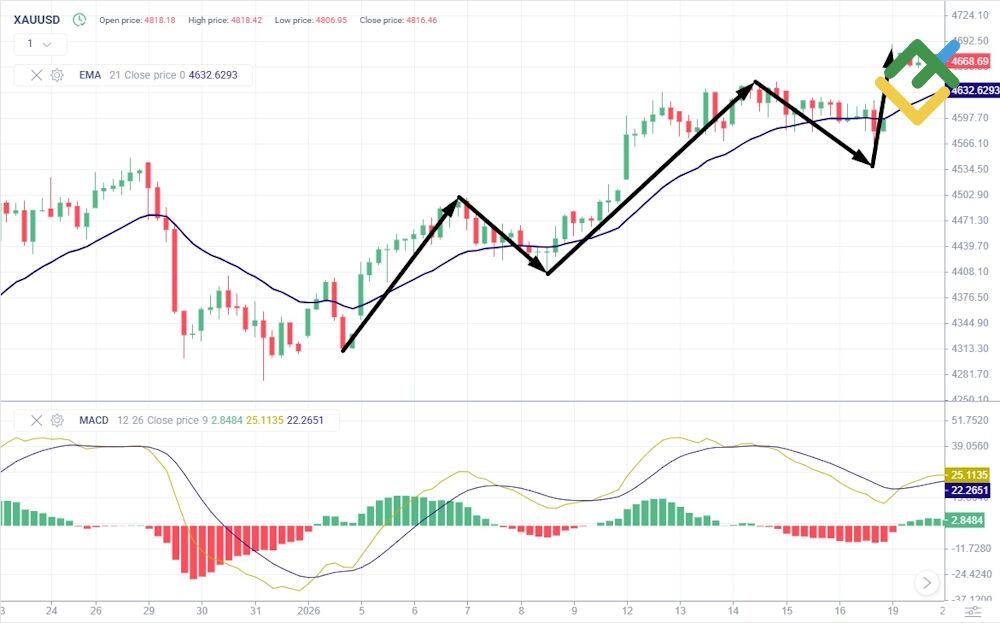
The arrows on the H4 chart above indicate gold price swings.
In the example above, the EMA 21 acts as a key support level during a pullback within the uptrend. The MACD histogram initially turns red, reflecting a temporary loss of momentum. As price resumes its upward move, the histogram shifts back to green near the support level, signaling a potential buying opportunity.
Another example:
Risk Management for Gold Trading
Risk management rules for trading gold are stricter than those for trading other assets. Key recommendations:
- Avoid over-leveraging your positions. Even if a setup looks strong, it is best to define your risk per trade in advance. Many traders limit risk to 1–2% of their account per position. This helps reduce drawdowns during losing streaks and supports long-term consistency.
- Always use a stop-loss. Do not rely on the market to reverse. Gold trends can last for weeks, months, or even years, and trying to ride out a drawdown can quickly damage your account. Place your stop-loss at clear levels, such as swing highs/lows or support and resistance.
- Maintain a favorable risk-reward ratio. Even strong strategies produce losing trades, so your potential reward should exceed your risk by at least 1.5–2 times.
- Pay attention to the news. Gold is highly sensitive to macroeconomic releases and sudden shifts in market sentiment. During such periods, spreads may widen, and price action can become erratic. Before entering a trade, check the economic calendar for key US data and monitor major news sources, especially for geopolitical developments.
- Focus on risk management. Trading is not about predicting every move, but about controlling risk, managing position size, and maintaining discipline. The goal is to prevent a single mistake from causing significant damage to your account.
- Keep a trading journal. It helps you track your performance, see what works and what does not, and spot recurring patterns in the market.
XAU/USD Trading Tips
Remember that gold is a safe-haven asset. When global instability arises, investors sell off risky assets and look for reliable alternatives. There are two main approaches to investing:
- Risk-on is an investment strategy where investors sell off safe-haven assets, such as gold, the US dollar, and the Swiss franc, and shift their capital into riskier assets, like alternative currencies, stocks, and cryptocurrencies.
- Risk-off is an approach in which investors sell off risky assets and buy safe-haven assets, including the US dollar, gold, government bonds, and the Swiss franc.
Gold is generally inversely correlated with the US dollar Index (DXY), although this relationship tends to hold mainly under stable market conditions. During periods of market uncertainty, the US dollar and gold can rise simultaneously.
Do not confuse trading with investing. If you take an investment approach, virtually any purchase will pay off over time, since the price of gold almost always increases. The only question is when you will get a return: in a day, a month, or several years.
In trading, a drawdown lasting several weeks can wipe out your entire account. A "set it and forget it" approach simply does not work. That is why it is essential to define your exit strategy before entering a trade.
Another practical gold trading tip is to choose a timeframe that matches your trading style. Lower timeframes tend to be noisy, while on H1, H4, and D1 charts, price action is usually more structured and entry points are easier to identify. If you are not an experienced day trader, it is often better to stick to higher timeframes and avoid trying to capture small price moves.
Conclusion
Gold trading strategies are divided into trend-following and counter-trend strategies. Based on holding time, XAU/USD trading can be categorized into scalping, intraday trading, swing trading, and long-term trading on larger timeframes. With a long-term XAUUSD trading strategy, it is crucial not to confuse trading with investing, as there are key differences that can affect your capital.
A breakout strategy is also commonly used by traders. It involves looking for a trade in the direction of the trend when a key price level is broken. When used correctly, this approach can yield significant profits, as gold trends tend to persist for extended periods.
Best Gold Trading Strategies FAQs
There is no single most reliable strategy. In practice, traders tend to achieve more consistent results by following the prevailing trend, using confirmation signals, and applying strict risk management with clearly defined stop-loss levels. When trading gold, it is especially important to account for news events and periods of high volatility. It is also essential to avoid excessive position sizes.
It can be profitable, but only with strict discipline, fast execution, and solid risk management. Due to gold's high volatility, this approach is not suitable for everyone. Mistakes, wide spreads, high commissions, and emotional decision-making can quickly lead to losses.
Traders typically test strategies using past performance and a demo account, evaluating entry and exit points, stop-loss and take-profit levels, potential drawdowns, and overall consistency. It is critical to test the strategy over a sufficiently long period that includes different market conditions, and to observe how the price behaves around major news events.
To trade XAU/USD successfully, you need to develop a profitable gold trading strategy, backtest it using historical data, and identify entry patterns. It is crucial to consider gold's volatility, the impact of news on this yellow metal, and to follow a trading system while adhering to risk management rules.
Price chart of XAUUSD in real time mode

The content of this article reflects the author’s opinion and does not necessarily reflect the official position of LiteFinance broker. The material published on this page is provided for informational purposes only and should not be considered as the provision of investment advice for the purposes of Directive 2014/65/EU.
According to copyright law, this article is considered intellectual property, which includes a prohibition on copying and distributing it without consent.