


Absolute Strength Histogram: work principle, advantages, disadvantages, trading signals.
Absolute Strength Histogram is a technical tool that aims at identifying the current trend and filtering the signals of the main indicator. It pretty well performs with trend lines. It is not included in the standard tool kit of the MT4, but it can be downloaded for free from the Internet, or via the link given below in the article. The indicator locates under the working price chart , it looks like a histogram with green and red bars. The bars represent the values of two moving averages: the slow MA and the fast MA, the distance between the MAs and the indicator bottom makes up columns. The formula also includes the indicators of the RSI and a stochastic oscillator.
Based on the location of the moving averages relative to each other, the histogram bars change their color. Green means a growing trend, red – a falling one. The change of the bars' color may mean the trend reversal, which is to be a signal to enter a trade in a new trend.
- The indicator template for the MT4 can be downloaded for free via this link. If you do not know how to install the template on the platform, or Absolute Strength Histogram doesn’t work after the installation, write in the comments. Let us try to solve the problem together!
Basically, the developers did not use any new mathematical algorithms to create this indicator; therefore, it is not very popular among technical analysts. And it is unjust.
Advantages of the Absolute Strength Histogram indicator:
- Convenient visual display.
- A small number of settings.
- Relatively good performance.
However, the indicator has a common flaw, it often lags behind the price movement . Therefore, the recommended timeframe is M15-M30, where time-lags do not have such a strong influence on anticipating the future price move. The problem can also be solved by the joint use of the Absolute Strength Histogram with price predicting indicators or oscillators. It is not a trend indicator or an oscillator. The Absolute Strength Histogram is a kind of supplementary tool. So, it is not used as the main tool, it is rather used to confirm signals delivered by other indicators to supplement other tools.
Parameters of Absolute Strength Histogram
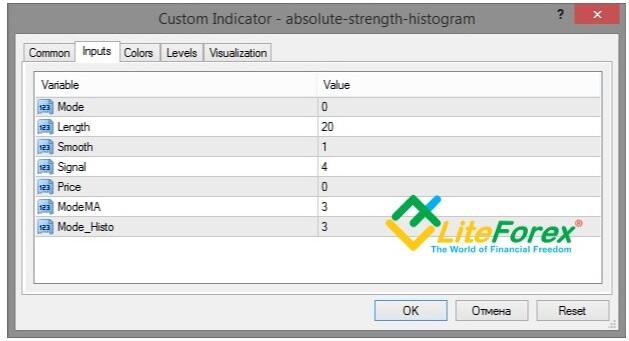
Absolute Strength Histogram has seven parameters:
- Mode. Indicator mode: 0 is the RSI value that is taken as a basis, 1 is the stochastic value. With a default value of zero, the histogram has a “torn” appearance. The columns randomly change the height, which indicates the trend strength. If you set the value 1 in this section, the histogram will take a smooth appearance. There are screenshots for comparison below:
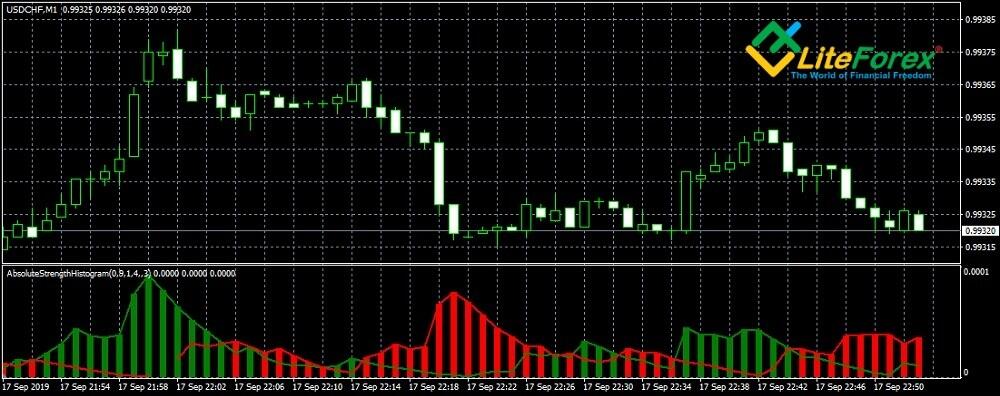
This figure displays the indicator with the value of zero
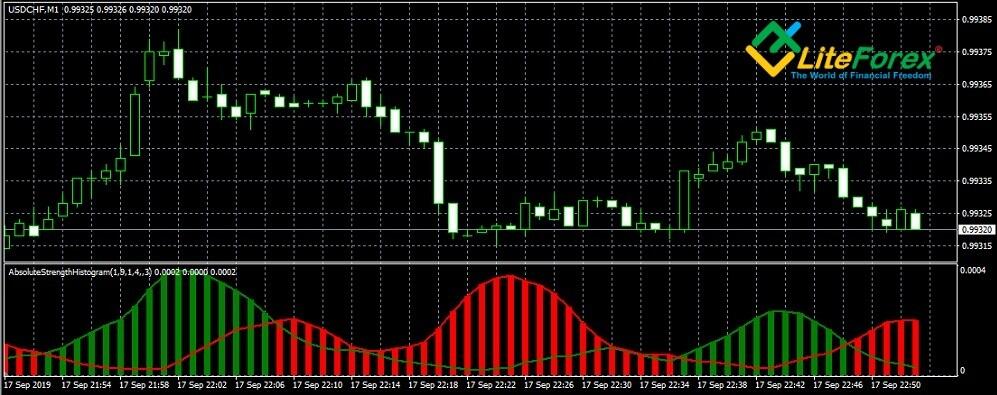
This figure displays the indicator with the value of zero. Pay attention that, in addition to smoothing, there is a clear shift of extremes.
- Length. It is the number of bars moving average calculated. The default value is 9 but as the indicator tests show, with this value the number of false signals is significantly higher than the number of valid ones. The greater is this value in the settings, the less frequent are the signals of the indicator, but they are more likely to be accurate. Also, the greater is the value of the parameter, the more smoothed it is. It is recommended to set the value of at least 20-30.
- Smooth. Smoothing period. It is not recommended to change the default value of 1.
- Signal. The period of the indicator signal line.
- Price. The type of average price to be used in indicator calculations (0 - close, 1 - open, 2 - high, 3 - low, 4 - median, 5 - typical, 6 - weighted). By default, it analyzes closing prices.
- ModeMA. It is the mode of MA. An accepted value is from 0 to 3.
- Mode_Histo. It influences the histogram display. Leave the default value of 3.
You can find the values of the parameters in the indicator code.
Absolute Strength Histogram signals (theory)
Absolute Strength Histogram entry signal is when the column changes its color. If the column goes red, it is a sell signal, it changes to green, it is a buy signal. The recommended distance for a stop loss is 15-20 points.
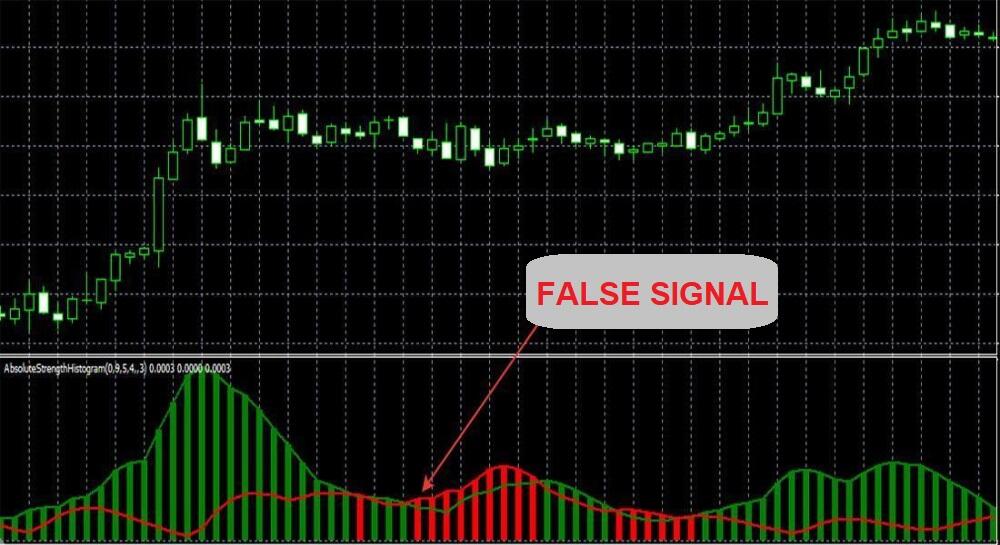
It seems easy, but there is a peculiarity that should be taken into account when you employ this indicator. If a new column is repainted in green, it must be higher than the previous red column. Otherwise, the signal can be considered false and it is better not to enter a trade based on it.
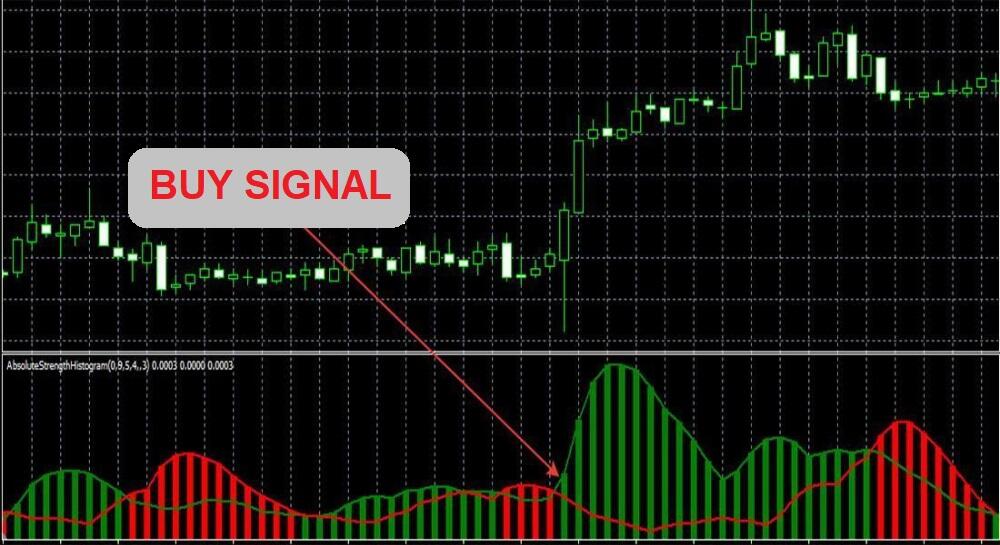
The same is with the sell signal. A new red column should be higher than the previous green one.
It is a bit more complex with the exit signals. Basically, the exit point should be at the peak of the histogram of a particular color; but, if the histogram goes on painting the columns of a particular color but a little lower than the previous ones, it can be considered as a divergence with the price action.
That is, the indicator has delivered an exit signal, but the price continues rising. To get more accurate signals, you need to reduce the Length value in the settings, but in this case, there will be more false entry signals.
On the chart below, the Length value is 5. Over a short time, indicator sends numerous signals most of which are false.
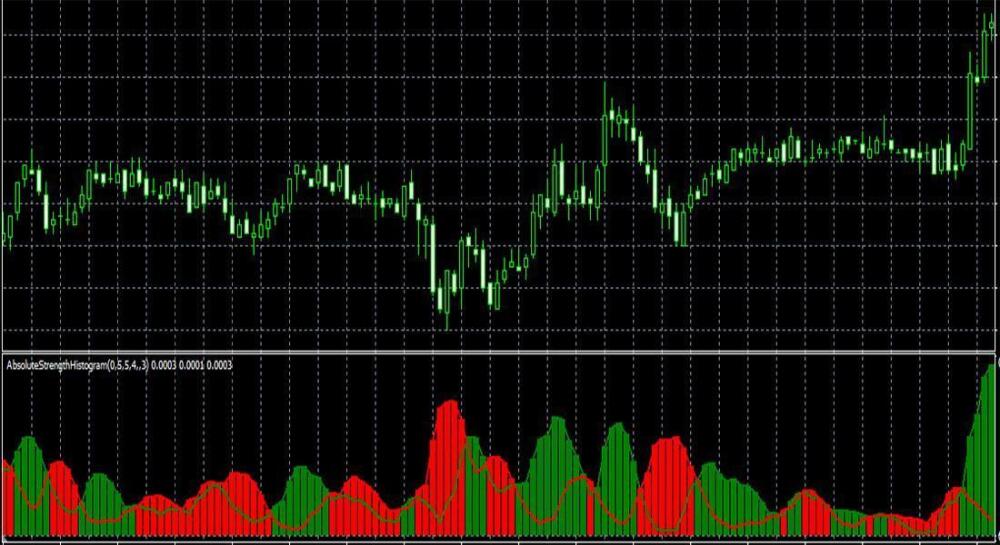
Absolute Strength Histogram signals (practice)
Most Internet resources describe only the general meaning of the indicator signals
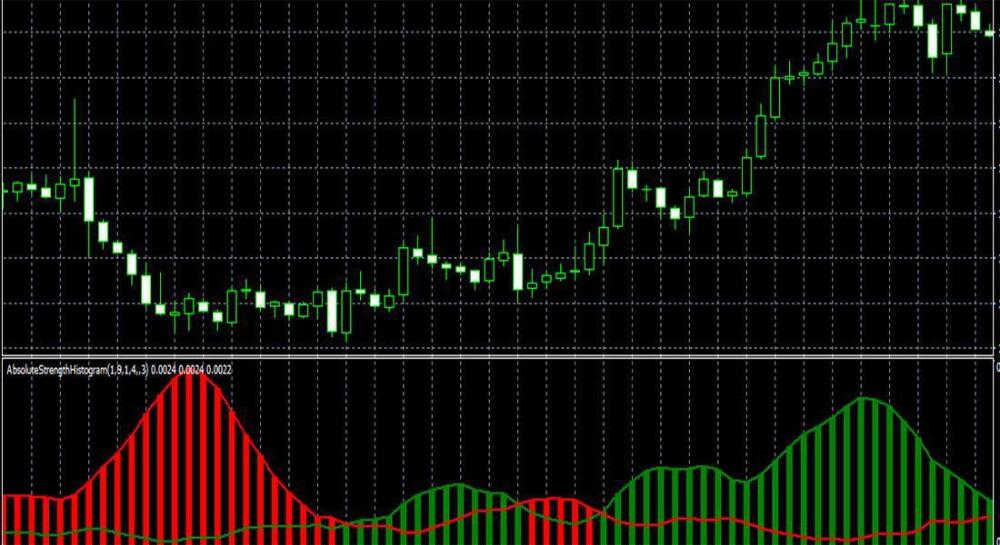
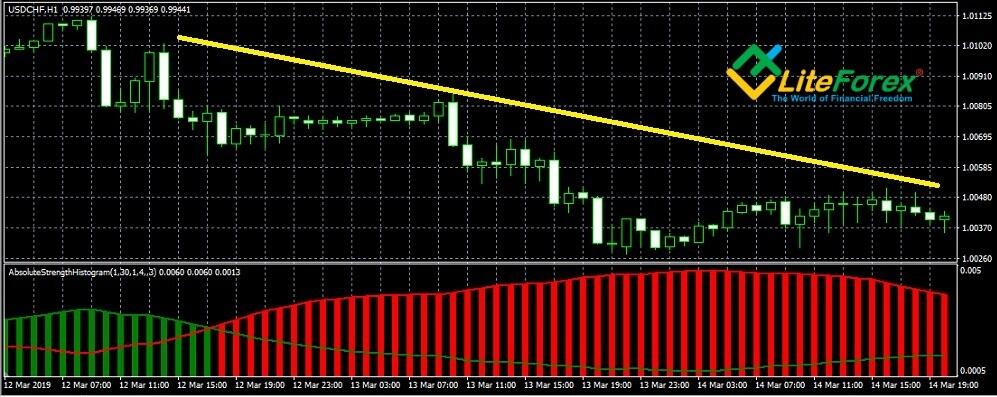
The first thing that confuses you is the radically different display of the price extremes with different values of the Mode. This prevents the right interpretation of signals. The second problem that is clear from history is that the indicator basically confirms the general direction of the long-term trend but hardly responds to short-term price fluctuations. For example, on the hourly chart, it actually shows the general trend (the example is in the screenshots below). But this suits only long-term trading strategies. It won’t work in short time periods.
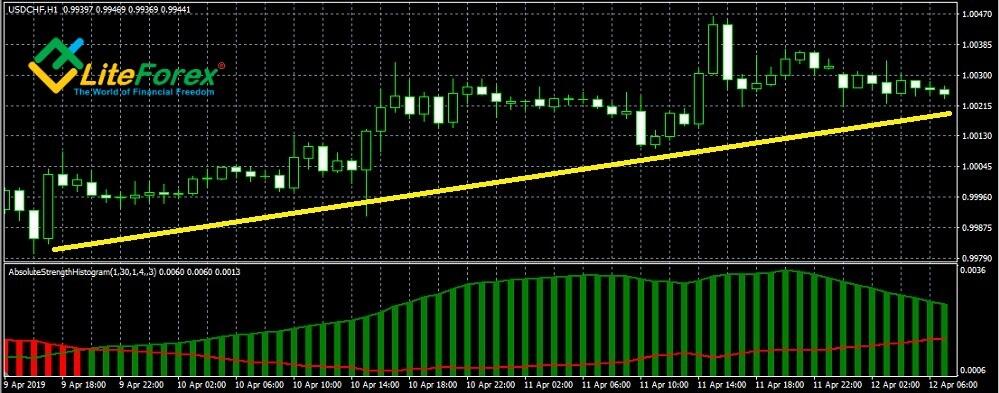
Uptrend:
Downtrend:
As you see, the indicator performs quite well on the M30 timeframe with Length = 20 (when it was 30 or 10, there were much more false signals).
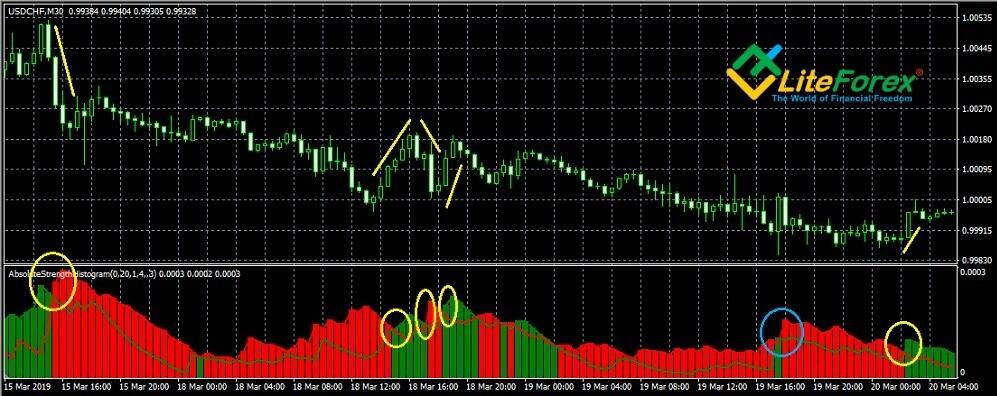
This figure shows that five signals (yellow circles) are winning. I want to stress once again these settings are optimal only for the USD/CHF pair. Timeframes should be adjusted for each pair.
A short summary. Recommendations for the use of Absolute Strength Histogram:
- Entry signal: the columns change their color. Buy signal: the green column is clearly higher than the previous red one. To confirm the signals, you may expect until two bars after the change of the color close. For example, If the first green column is higher than the red, the second green column is higher than the first green one, you enter the trade on the third bar.
- Exit signal:
- The most recent column is lower than the previous one,
- A target profit is 20 points when it is reached, you close 50% of the position, move the stop loss to the break-even level, protect the position with a trailing stop at the distance of 20 points.
Working timeframes are from M15 to M30, the number of analyzed bars is 20.
Conclusion: Absolute Strength Histogram may seem to an ordinary indicator with many flaws:
- It has no mathematical algorithm, no unique idea, the signal accuracy is average
- You can make profits from trading with this indicator only if you use additional tools, bothe trend indicators located on the main window and oscillators located below the trading chart.
Therefore, you may, of course, doubt in the feasibility of using the Absolute Strength Histogram, especially since there are many other, more accurate indicators, which are easier and more convenient to work with.
Do not jump to any conclusions! Remember that there can be no perfect indicator and there can’t be always winning forex trading strategy. Each indicator performs its task at a particular timeframe and for a particular trading instrument. That is why there no bad indicators, there are traders who can’t use technical tools properly.
Absolute Strength Histogram is a classical indicator based on Moving Averages, and MAs are a toll from which the mastering of technical analysis starts. Therefore, download the indicator template, train, test it and shares the results in the comments!
I wish you success in trading!
P.S. Did you like my article? Share it in social networks: it will be the best "thank you" :)
Useful links:
- I recommend trying to trade with a reliable broker here. The system allows you to trade by yourself or copy successful traders from all across the globe.
- Use my promo code BLOG to get a 50% deposit bonus on the LiteFinance platform. Simply enter this code in the appropriate field when funding your trading account.
- Telegram chat for traders: https://t.me/litefinancebrokerchat. We are sharing the signals and trading experience.
- Telegram channel with high-quality analytics, Forex reviews, training articles, and other useful things for traders https://t.me/litefinance

The content of this article reflects the author’s opinion and does not necessarily reflect the official position of LiteFinance broker. The material published on this page is provided for informational purposes only and should not be considered as the provision of investment advice for the purposes of Directive 2014/65/EU.
According to copyright law, this article is considered intellectual property, which includes a prohibition on copying and distributing it without consent.
