Trend trading strategy with TD indicators: TD Differential, TD Reverse Differential и TD Anti-Differential, TD Waldo Patterns, TD Range Projection, TD REBO, TD Channels, TD Sequential
Dear friends!
Today, I am going to describe another cryptocurrency trading strategy based on excellent technical tools developed by Thomas DeMark. It is distinguished by the trend identification method. The trend is analyzed with differential arrows and making a projection of the future price bar in longer timeframes. Besides, the entry point will be determined very accurately due to the analysis of hourly and even minute timeframes.
To make the strategy easier to understand, I will describe each indicator and explain its function in this trading strategy.
TD Differential, TD Reverse Differential и TD Anti-Differential
These tools deliver signals on the short-term trend reversal or extension. You can read more in this training post. In this strategy, we shall apply differential arrows to identify the general trend of price moves during a day.
Remember that a TD Differential Up (Down) Arrow appears when the following conditions are met:
- There must be two consecutive closes, each one less (greater) than the one prior,
- Buying pressure (BP) for the current price bar must be greater (less) than buying pressure from the previous price bar, and
- Selling pressure (SP) for the current price bar must be less (greater) than selling pressure from the previous price bar
Next, a TD Reverse Differential Up (Down) arrow appears when there following conditions met:
- There must be two consecutive closes, each one greater (less) than the prior close,
- The current price bar’s buying pressure must be greater (less) than the previous price bar’s buying pressure, and
- The current price bar’s selling pressure must be less (greater) than the previous bar’s selling pressure.
Note: Buying pressure is the difference between the close of the current price bar and its true low. Selling pressure is the difference between the close of the current bar and its true high.
TD Differential compares the bullish and the bearish pressure to identify the trend potential pivot point. And TD Reverse Differential assesses the trend potential extension.
When the price reaches a prospective market bottom, there may occur an anti-differential up arrow, and, if the price is heading into a prospective market top, there is generated an anti-differential down arrow. Both patterns signal a prospective trend direction.
The following conditions should be met to generate an anti-differential up (down) arrow:
- There must be two consecutive higher (lower) closes, each of which is higher (lower) relative to the previous price bar’s close.
- There must be close that is lower (higher) than the close of the previous price bar, and then
- There must be a close that is higher (lower) relative to the close of the previous price bar.
You may learn more about the application of these tools in this lesson.
And now, let us study the examples:
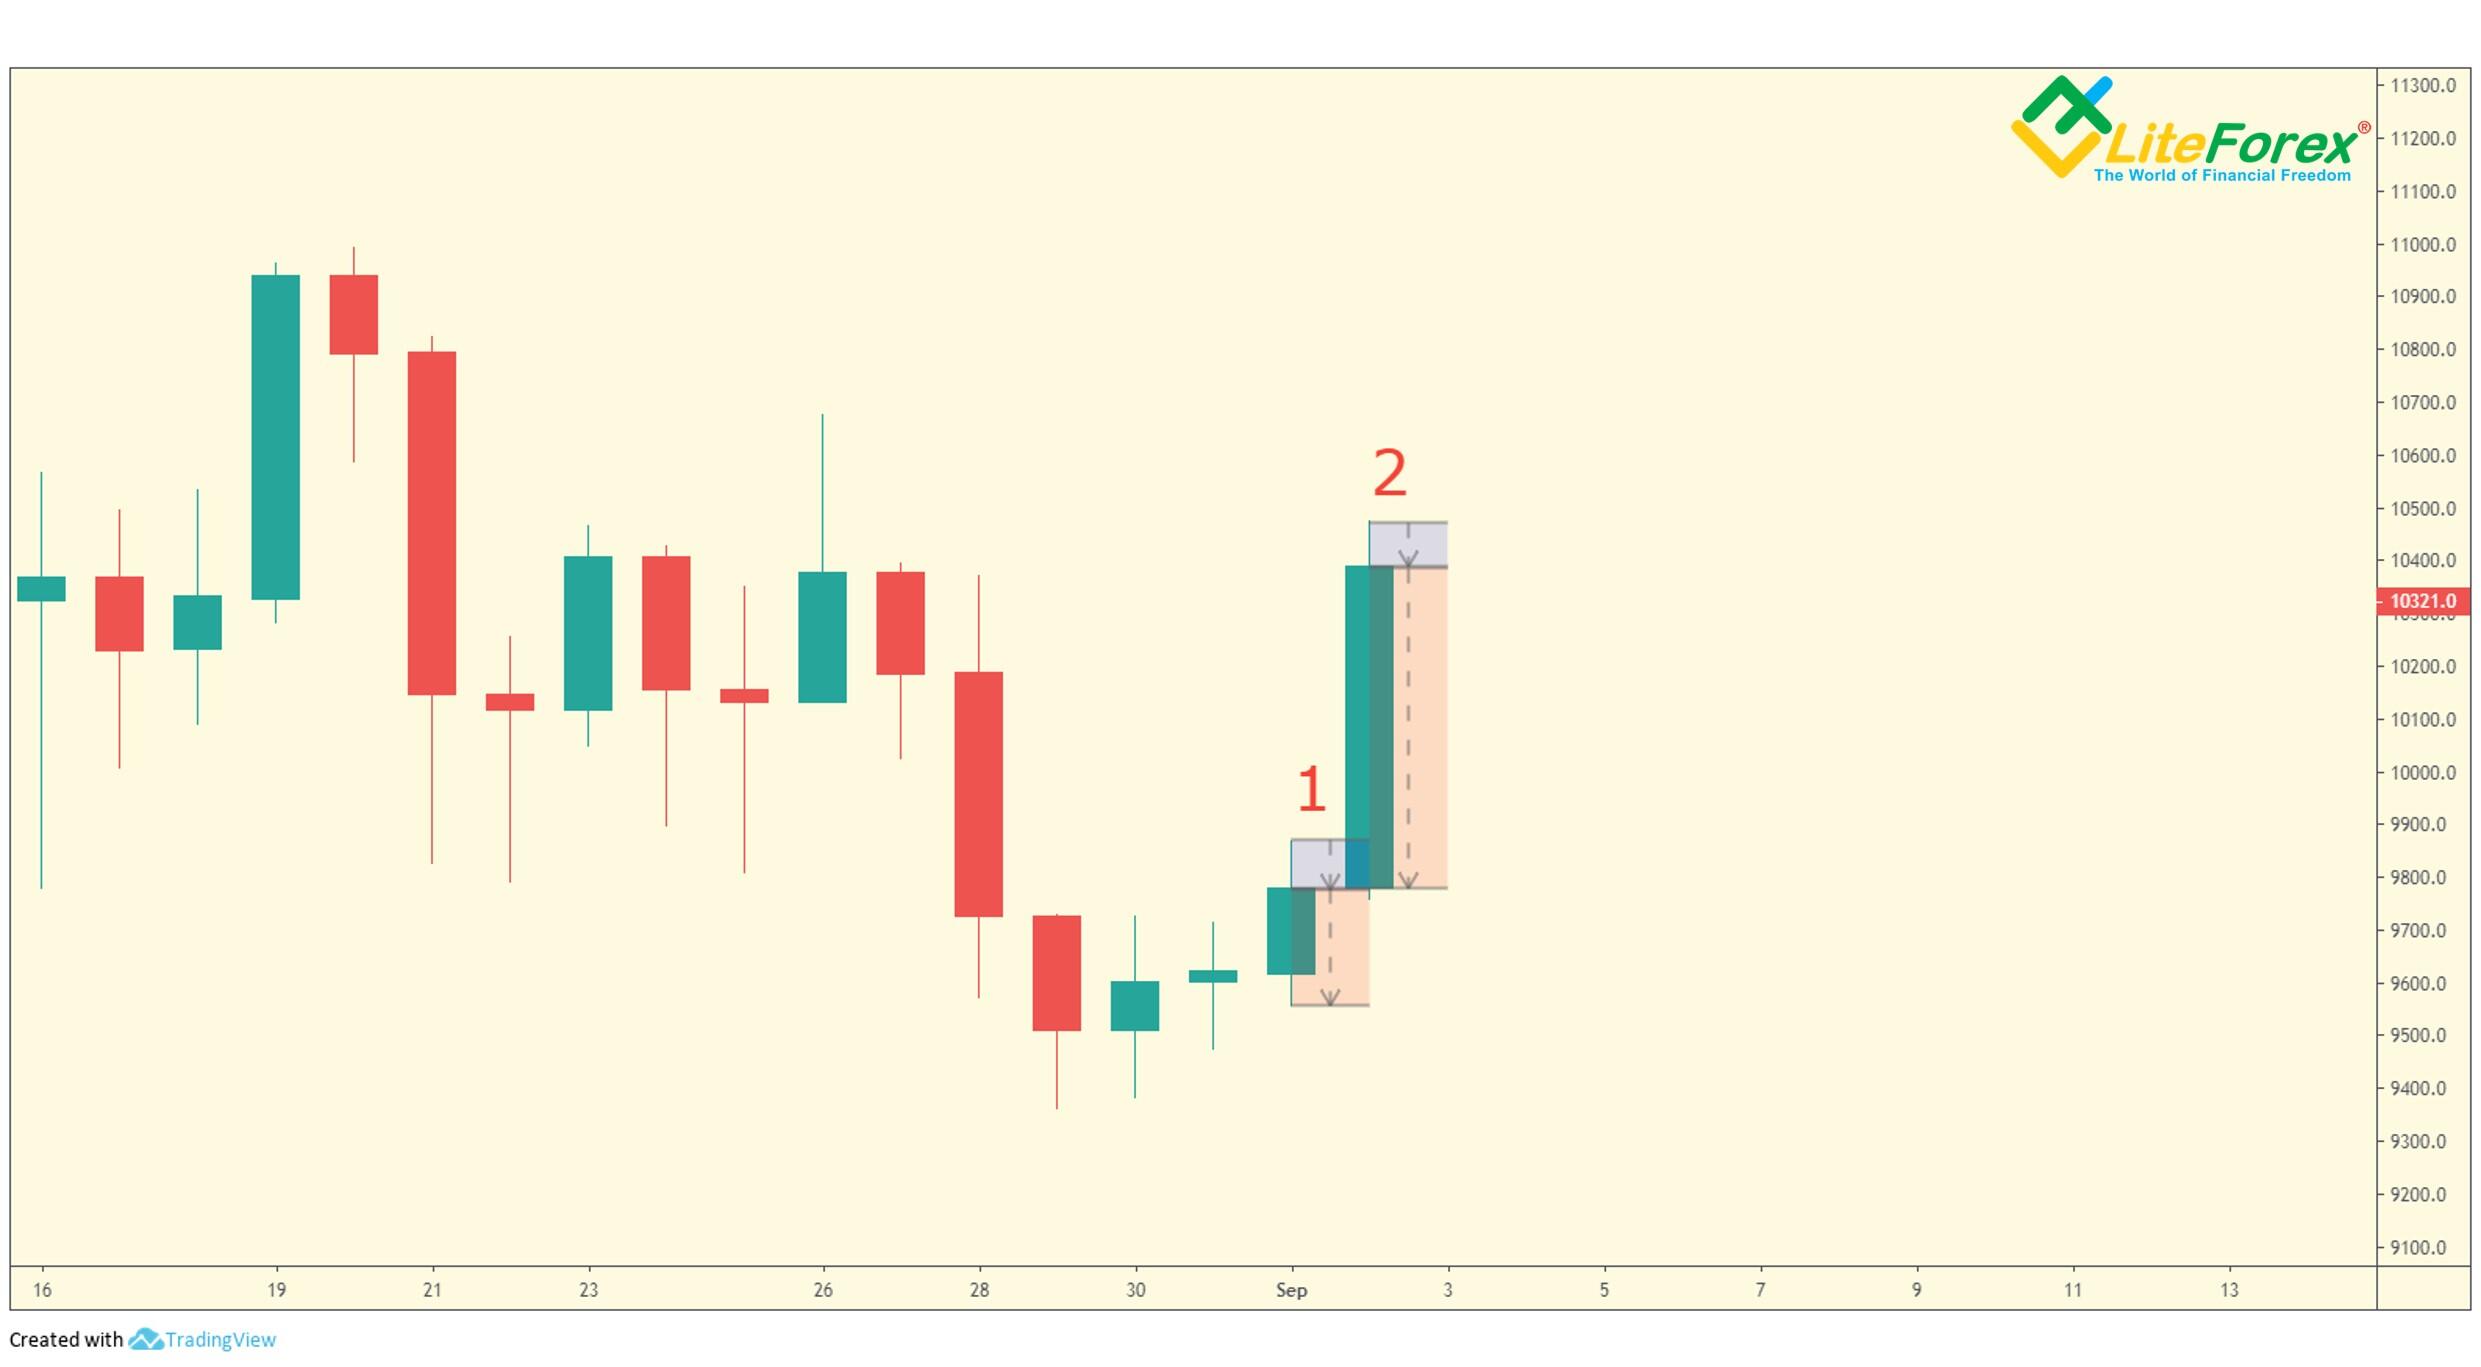
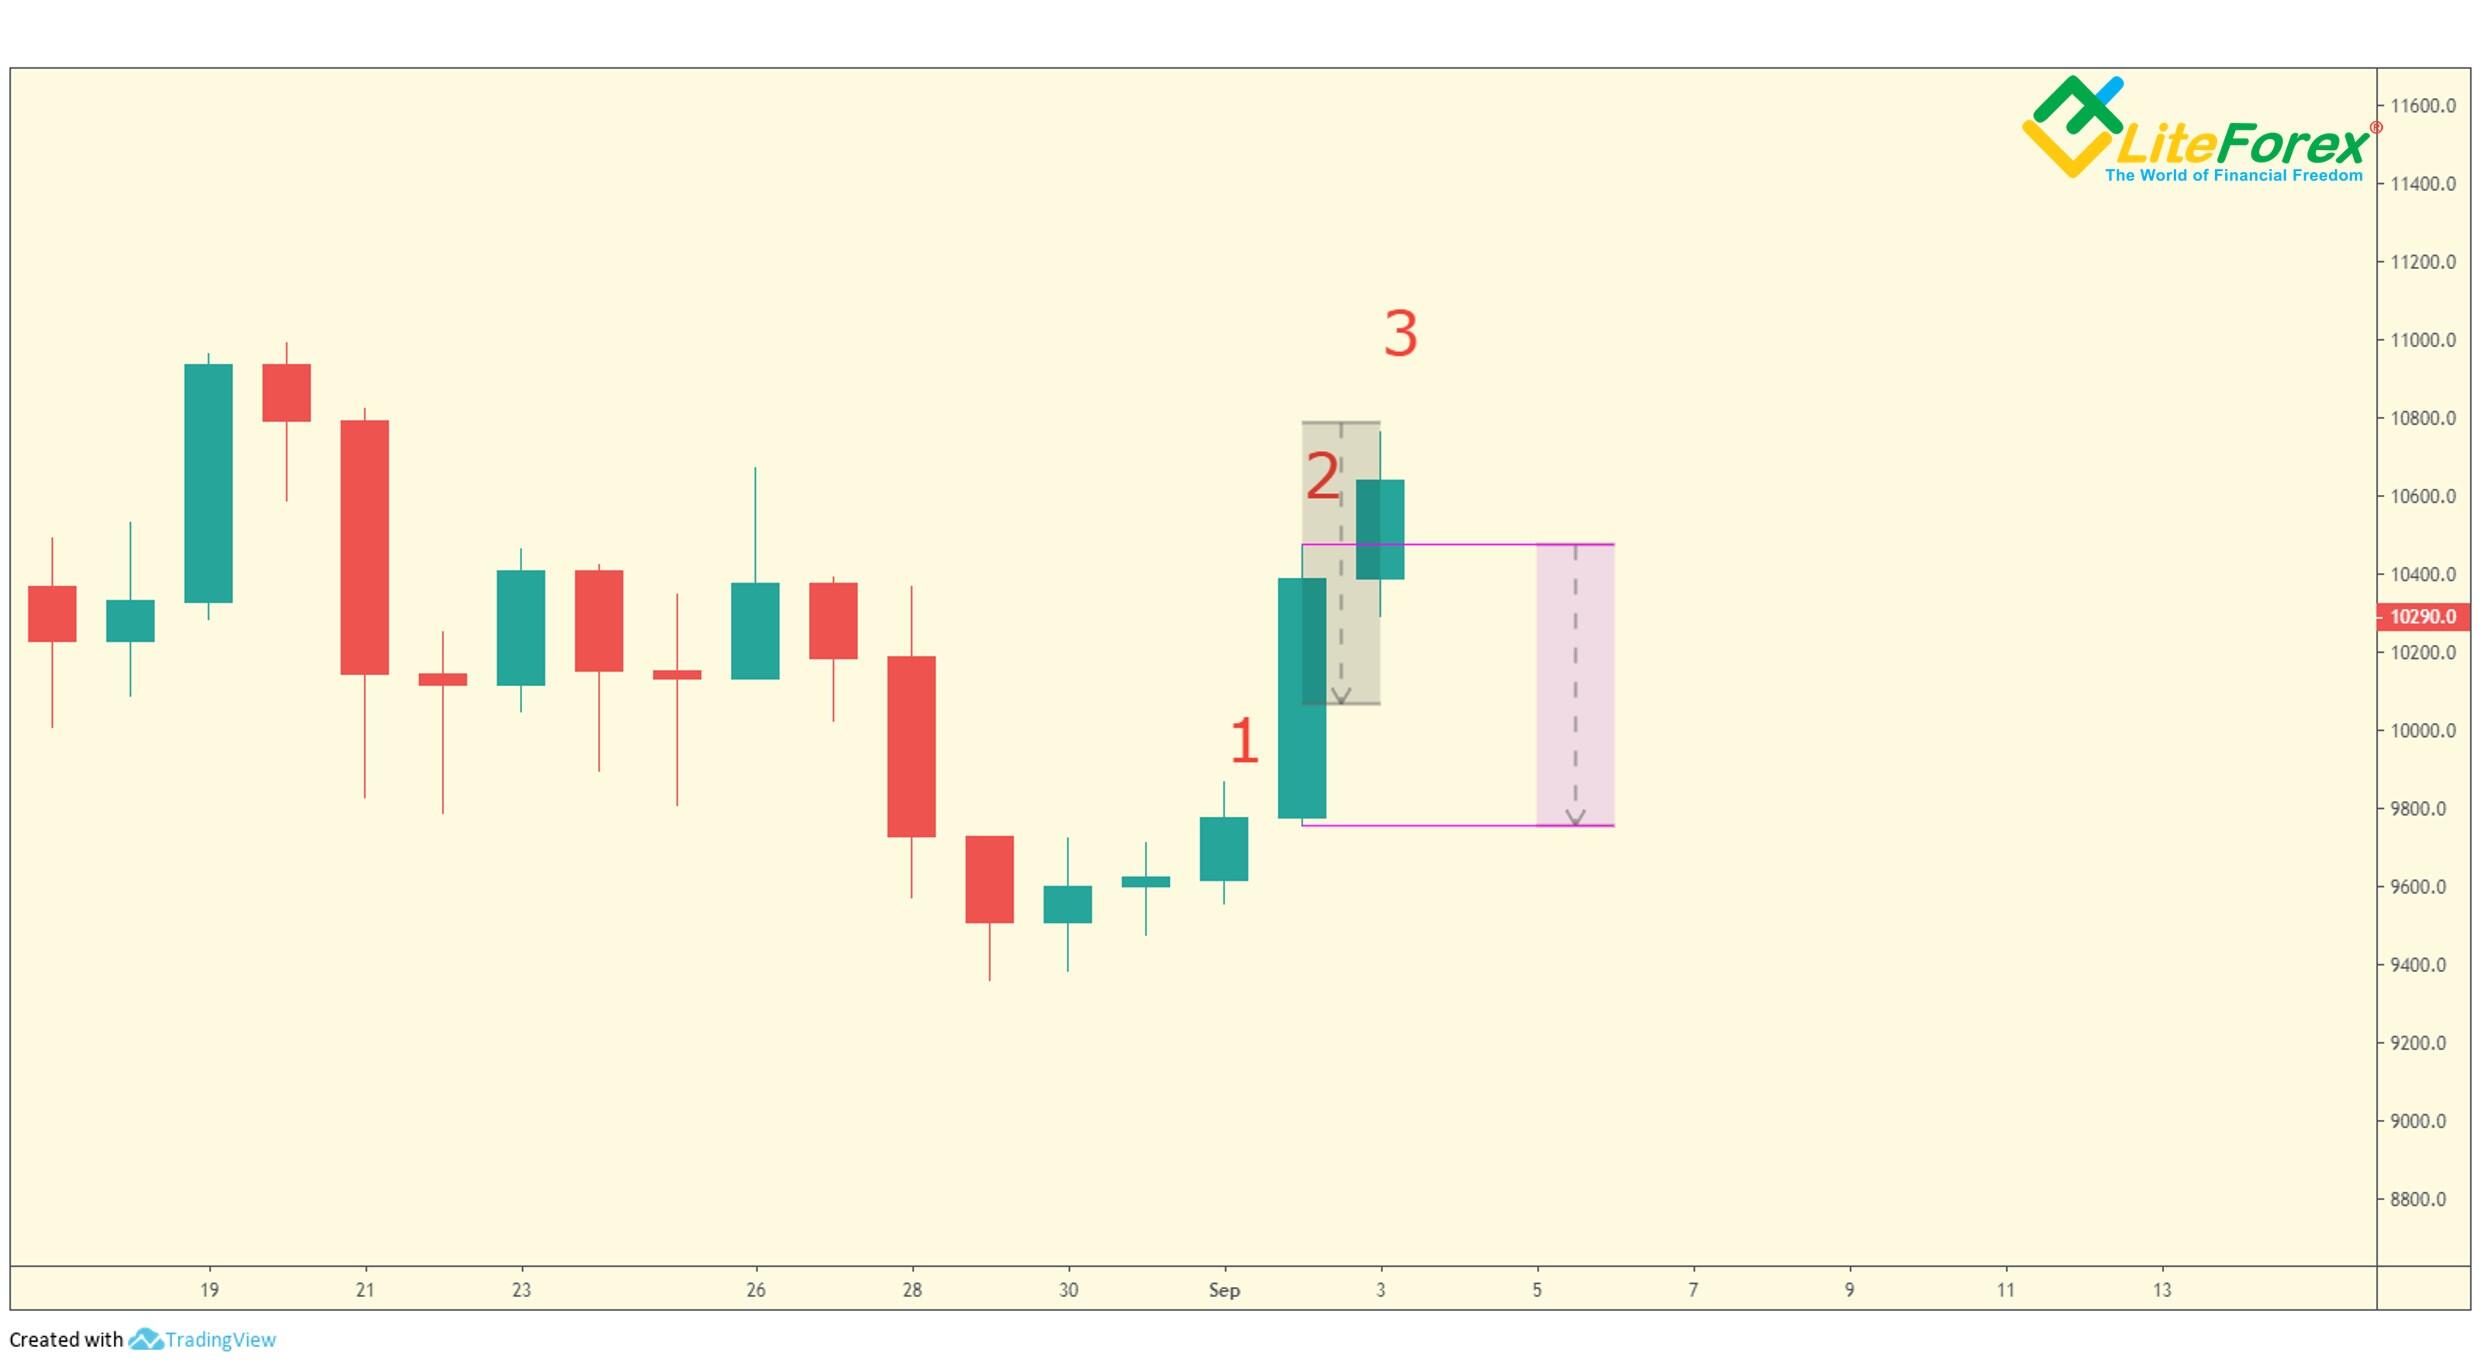
In the daily BTCUSD price chart above, there are two consecutive higher closes, each of which is higher relative to the previous price bar’s close. The bar market with number 2 closes higher than bar 1. Correspondingly, the close of bar 1 is higher than the prior close. The Buying pressure of bar 2 (red zone in the chart) is greater than BP of bar 1. The selling pressure of bar 2, marked with blue, a little less than SP of bar 1. Accordingly, we can state a reverse differential up arrow that suggests the bearish trend should continue.
In fact, the price continued rising on the next day, which confirms our forecast.
As you see, I will use differential and anti-differential arrows in this strategy to identify the general price trend during the analyzed day. Therefore, provided there is a corresponding pattern, I will make my trading decision in favor of either long or short trades. In our case, reverse differential up arrow suggests the continuation of the price rise, and so, during the day trading, I will trade with the general trend and enter only long trades.
TD Waldo Patterns
TD Waldo Patterns are used as a supplementary tool to confirm the signals in this strategy. You can learn more about this indicator here. In this article, I will briefly repeat the material, so that you understand how to make an analysis.
First, I’d like to clarify that TD Waldo Patterns, used as a confirmation, can be in three forms relative to the differential arrows.
1. The pattern confirms the signal delivered by the TD Differential Arrows. In this case, the price trend for the current day is clear, and we enter trades only in the trend direction.
2. There is no Waldo Pattern, or there is a Waldo Pattern, but there are no differential arrows, or both signals are absent. In this case, you should be extremely careful with entering trades. The market sentiment is uncertain. If so, you should look at the previous signal:
- If there is no signal for the current bar, follow the signal of the previous bar.
- If at least one indicator delivers a signal, confirming the previous one, the market sentiment should remain unchanged.
- If at least one indicator delivers a signal, contradicting the previous one, do not enter any new trades, or look for exit points if you have any trades.
3. Differential arrows and Waldo Patterns send opposite signals at the analyzed bar. This signals market uncertainty. In such situations, I try to avoid trading or at least reduce the positions opened.
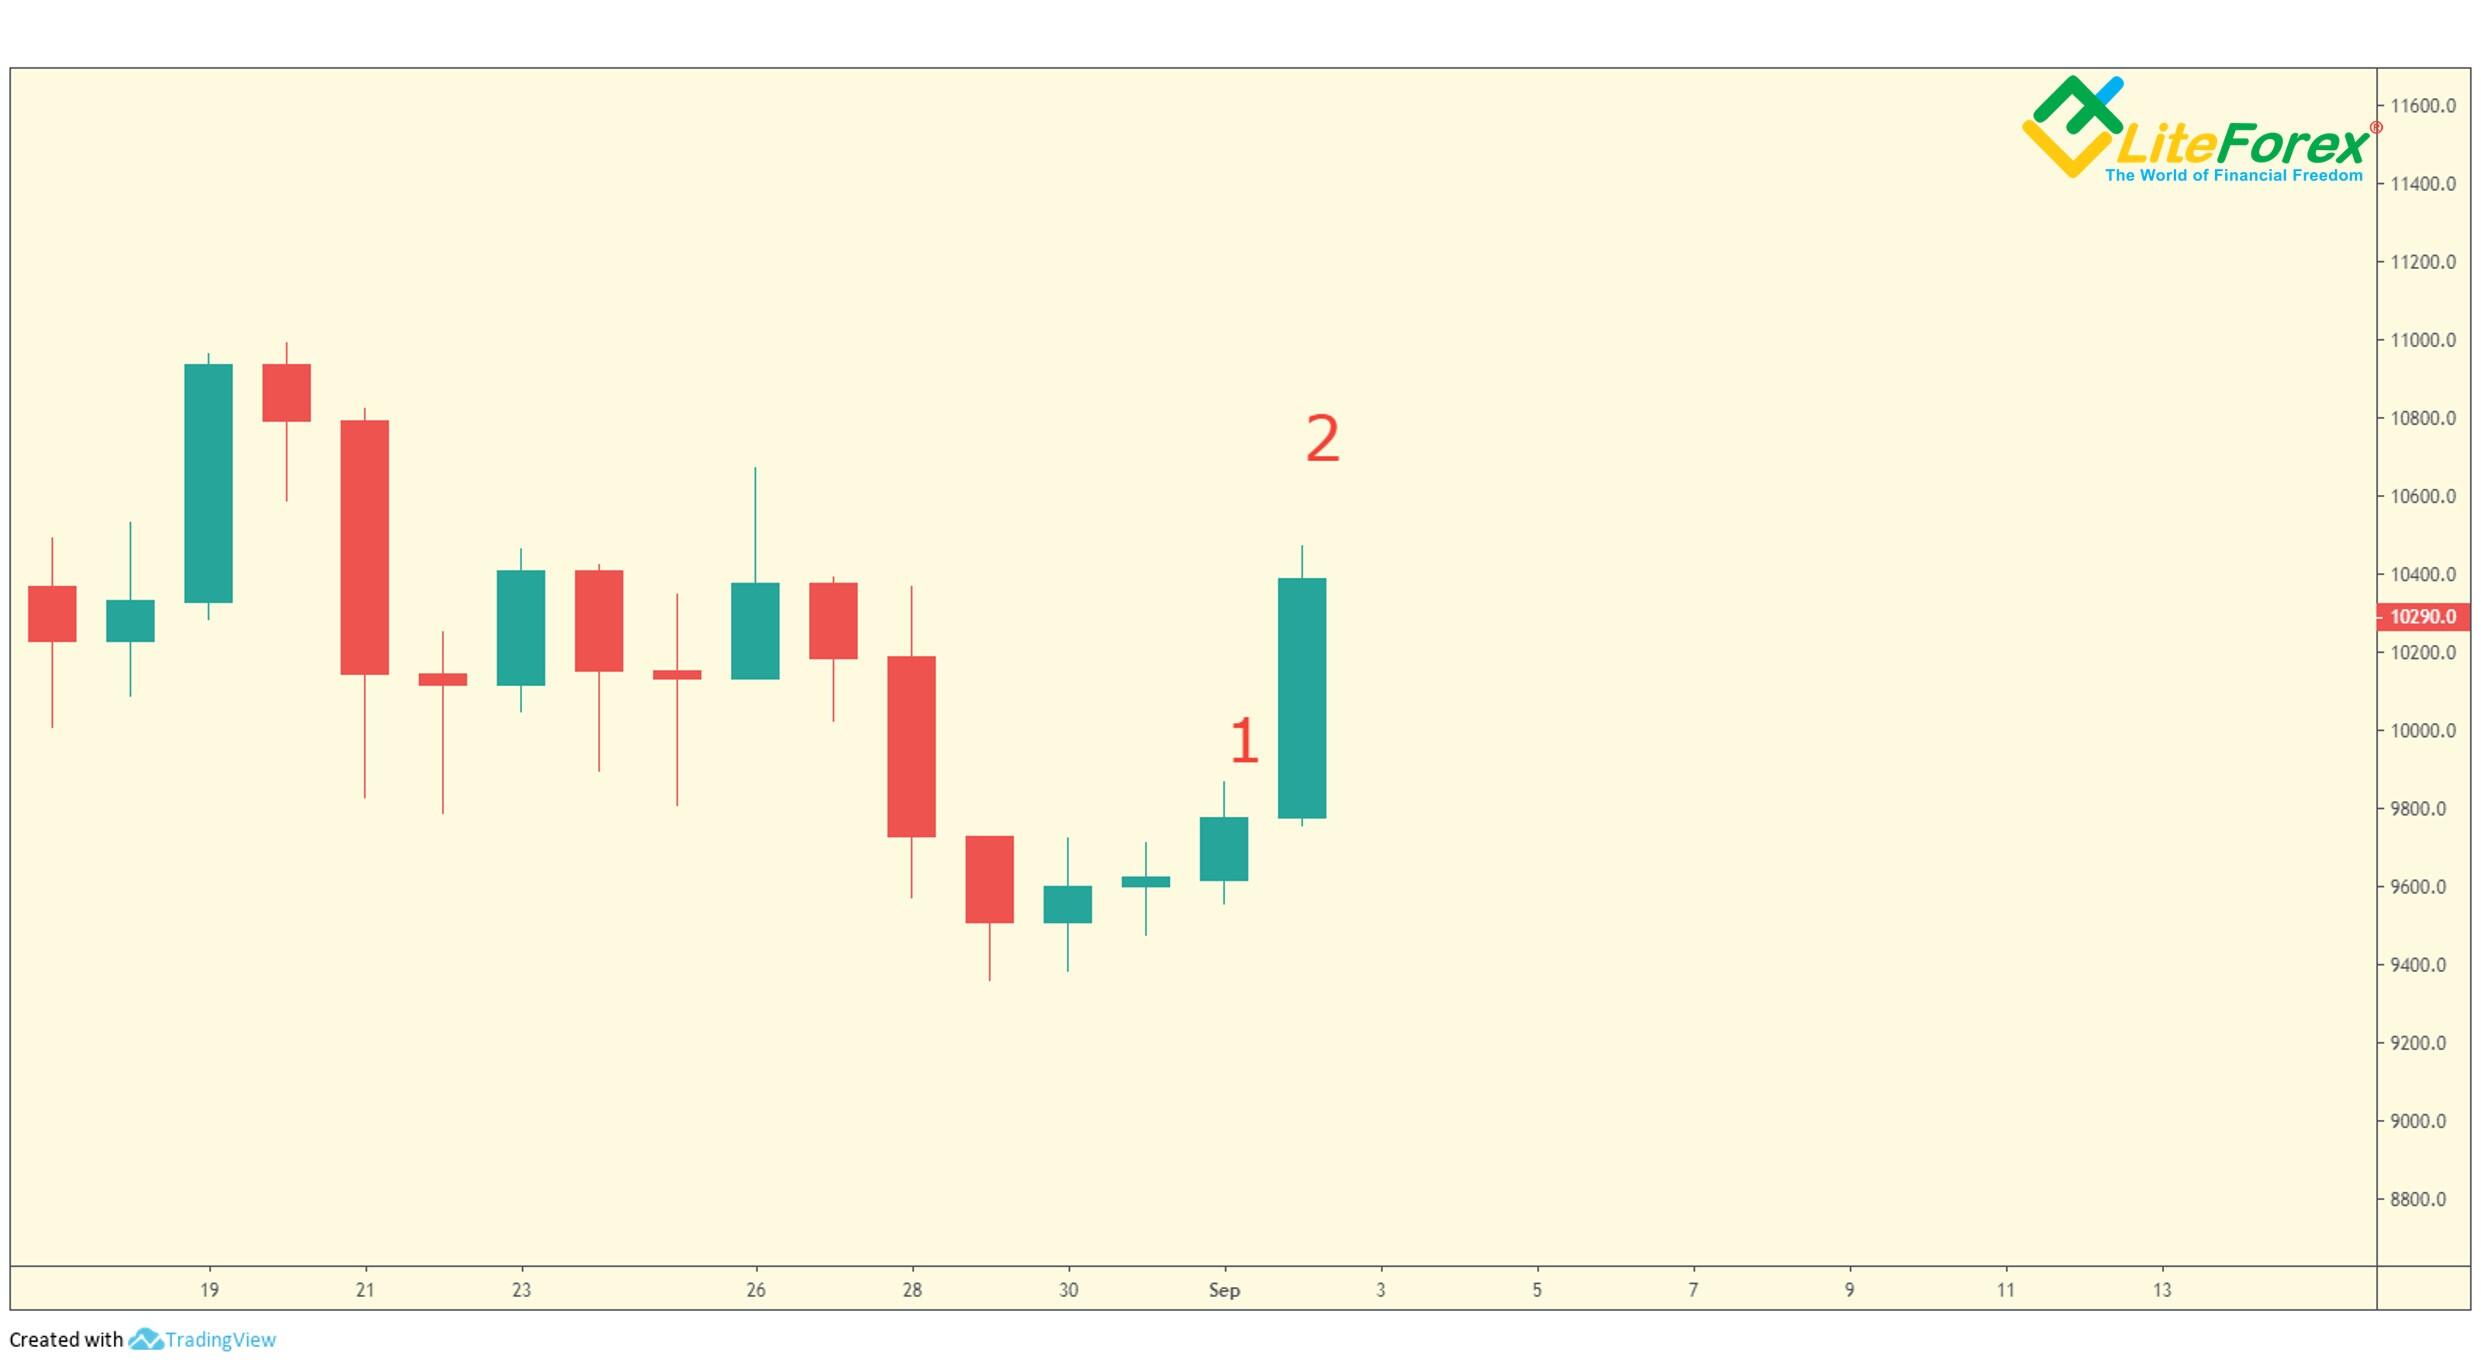
In our example, I haven’t identified any TD Waldo Patterns. So, we follow rule number 2. We identify the differential arrow direction for the most recent closed bar, next, we refer to the previous reverse differential up arrow which signals the continuation of the short-term bullish trend.
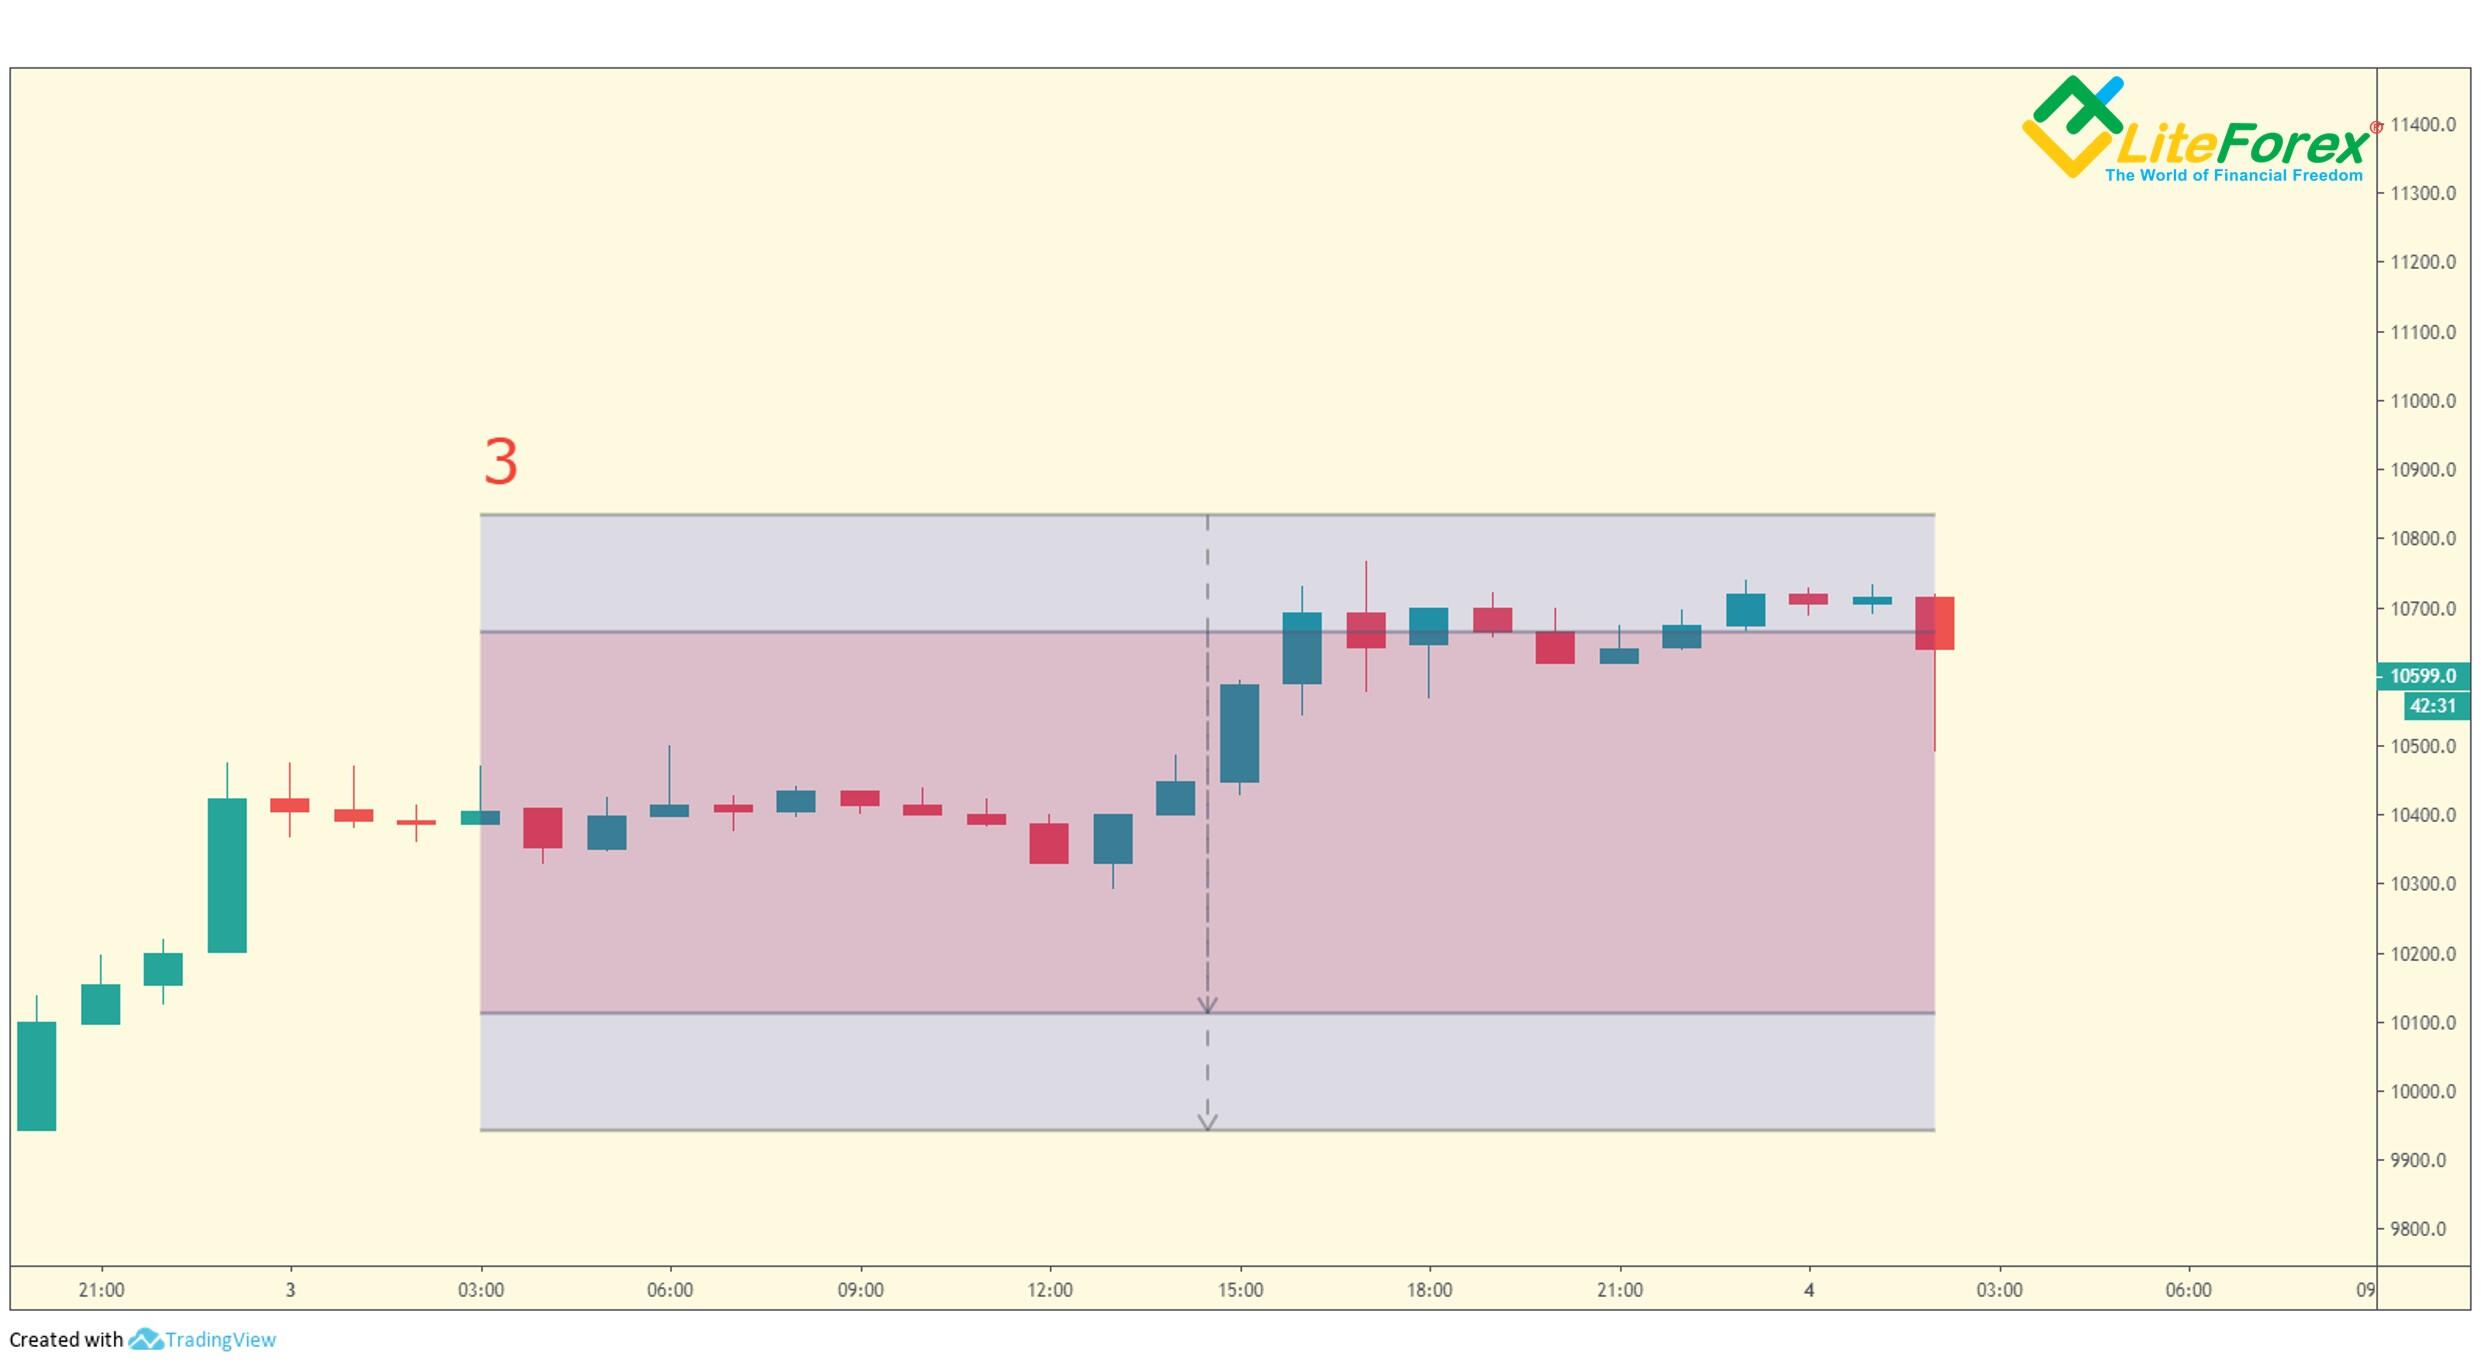
TD Range Projection
This tool will be used to analyze the daily and the hourly charts. It allows the extreme price levels for the next bar and build their projections. You can learn more about the indicator here. In the example below, I will present a detailed description of my calculations.
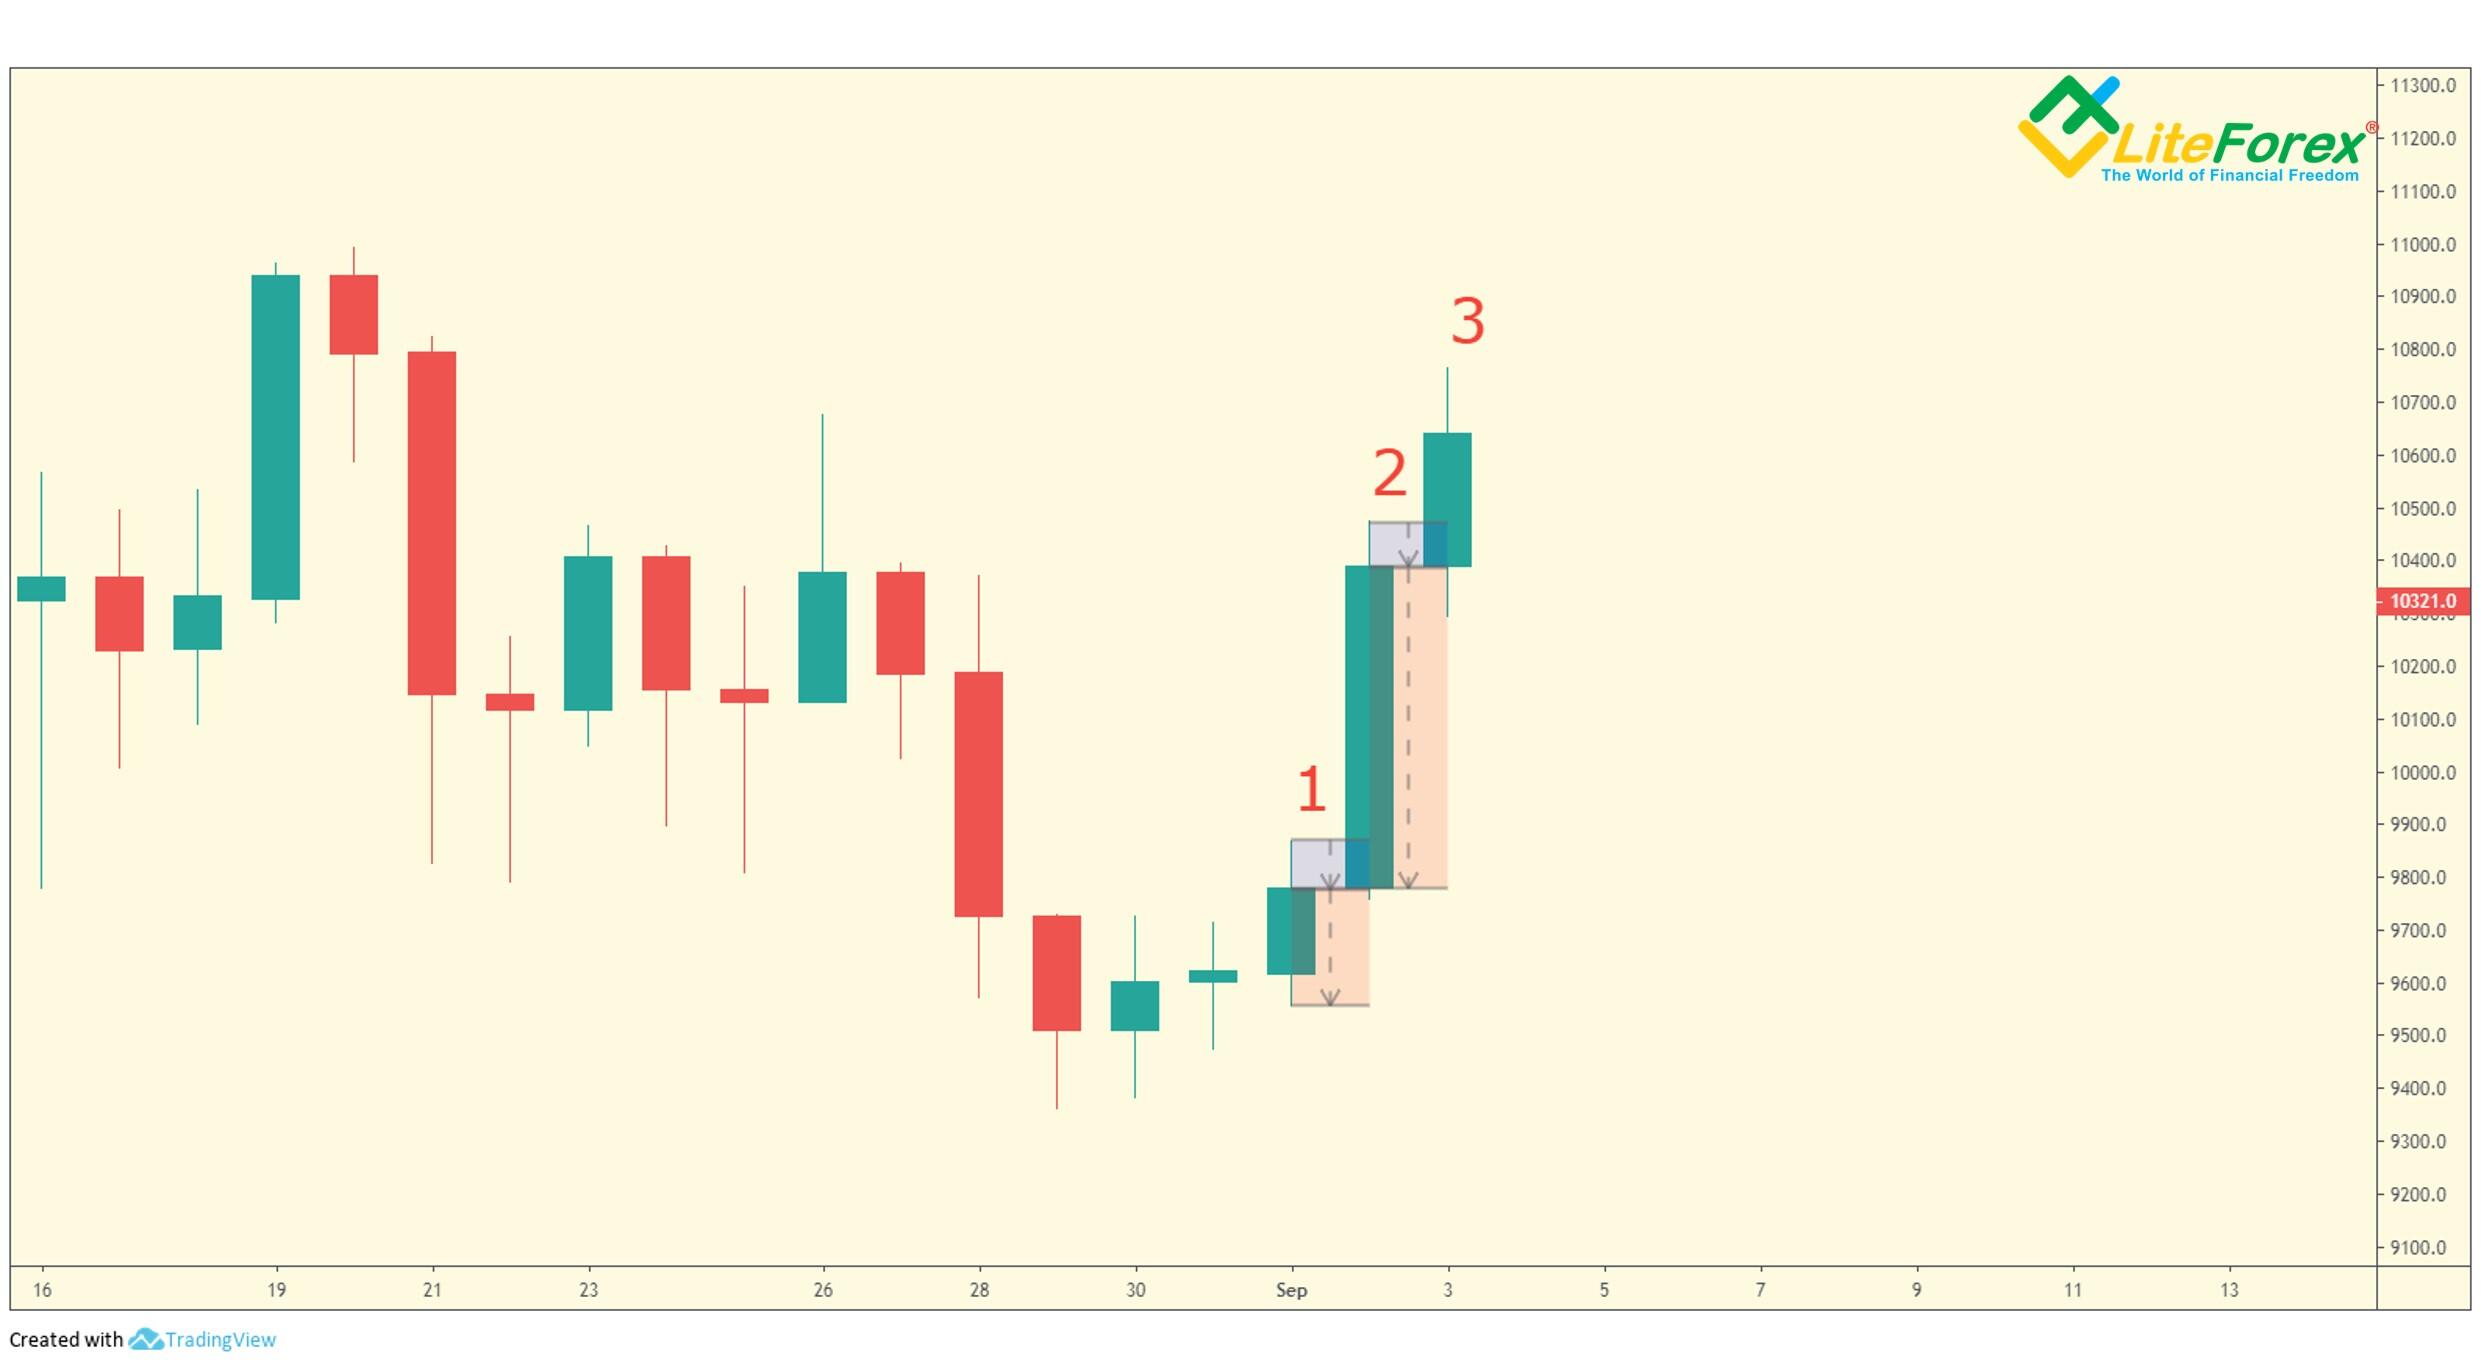
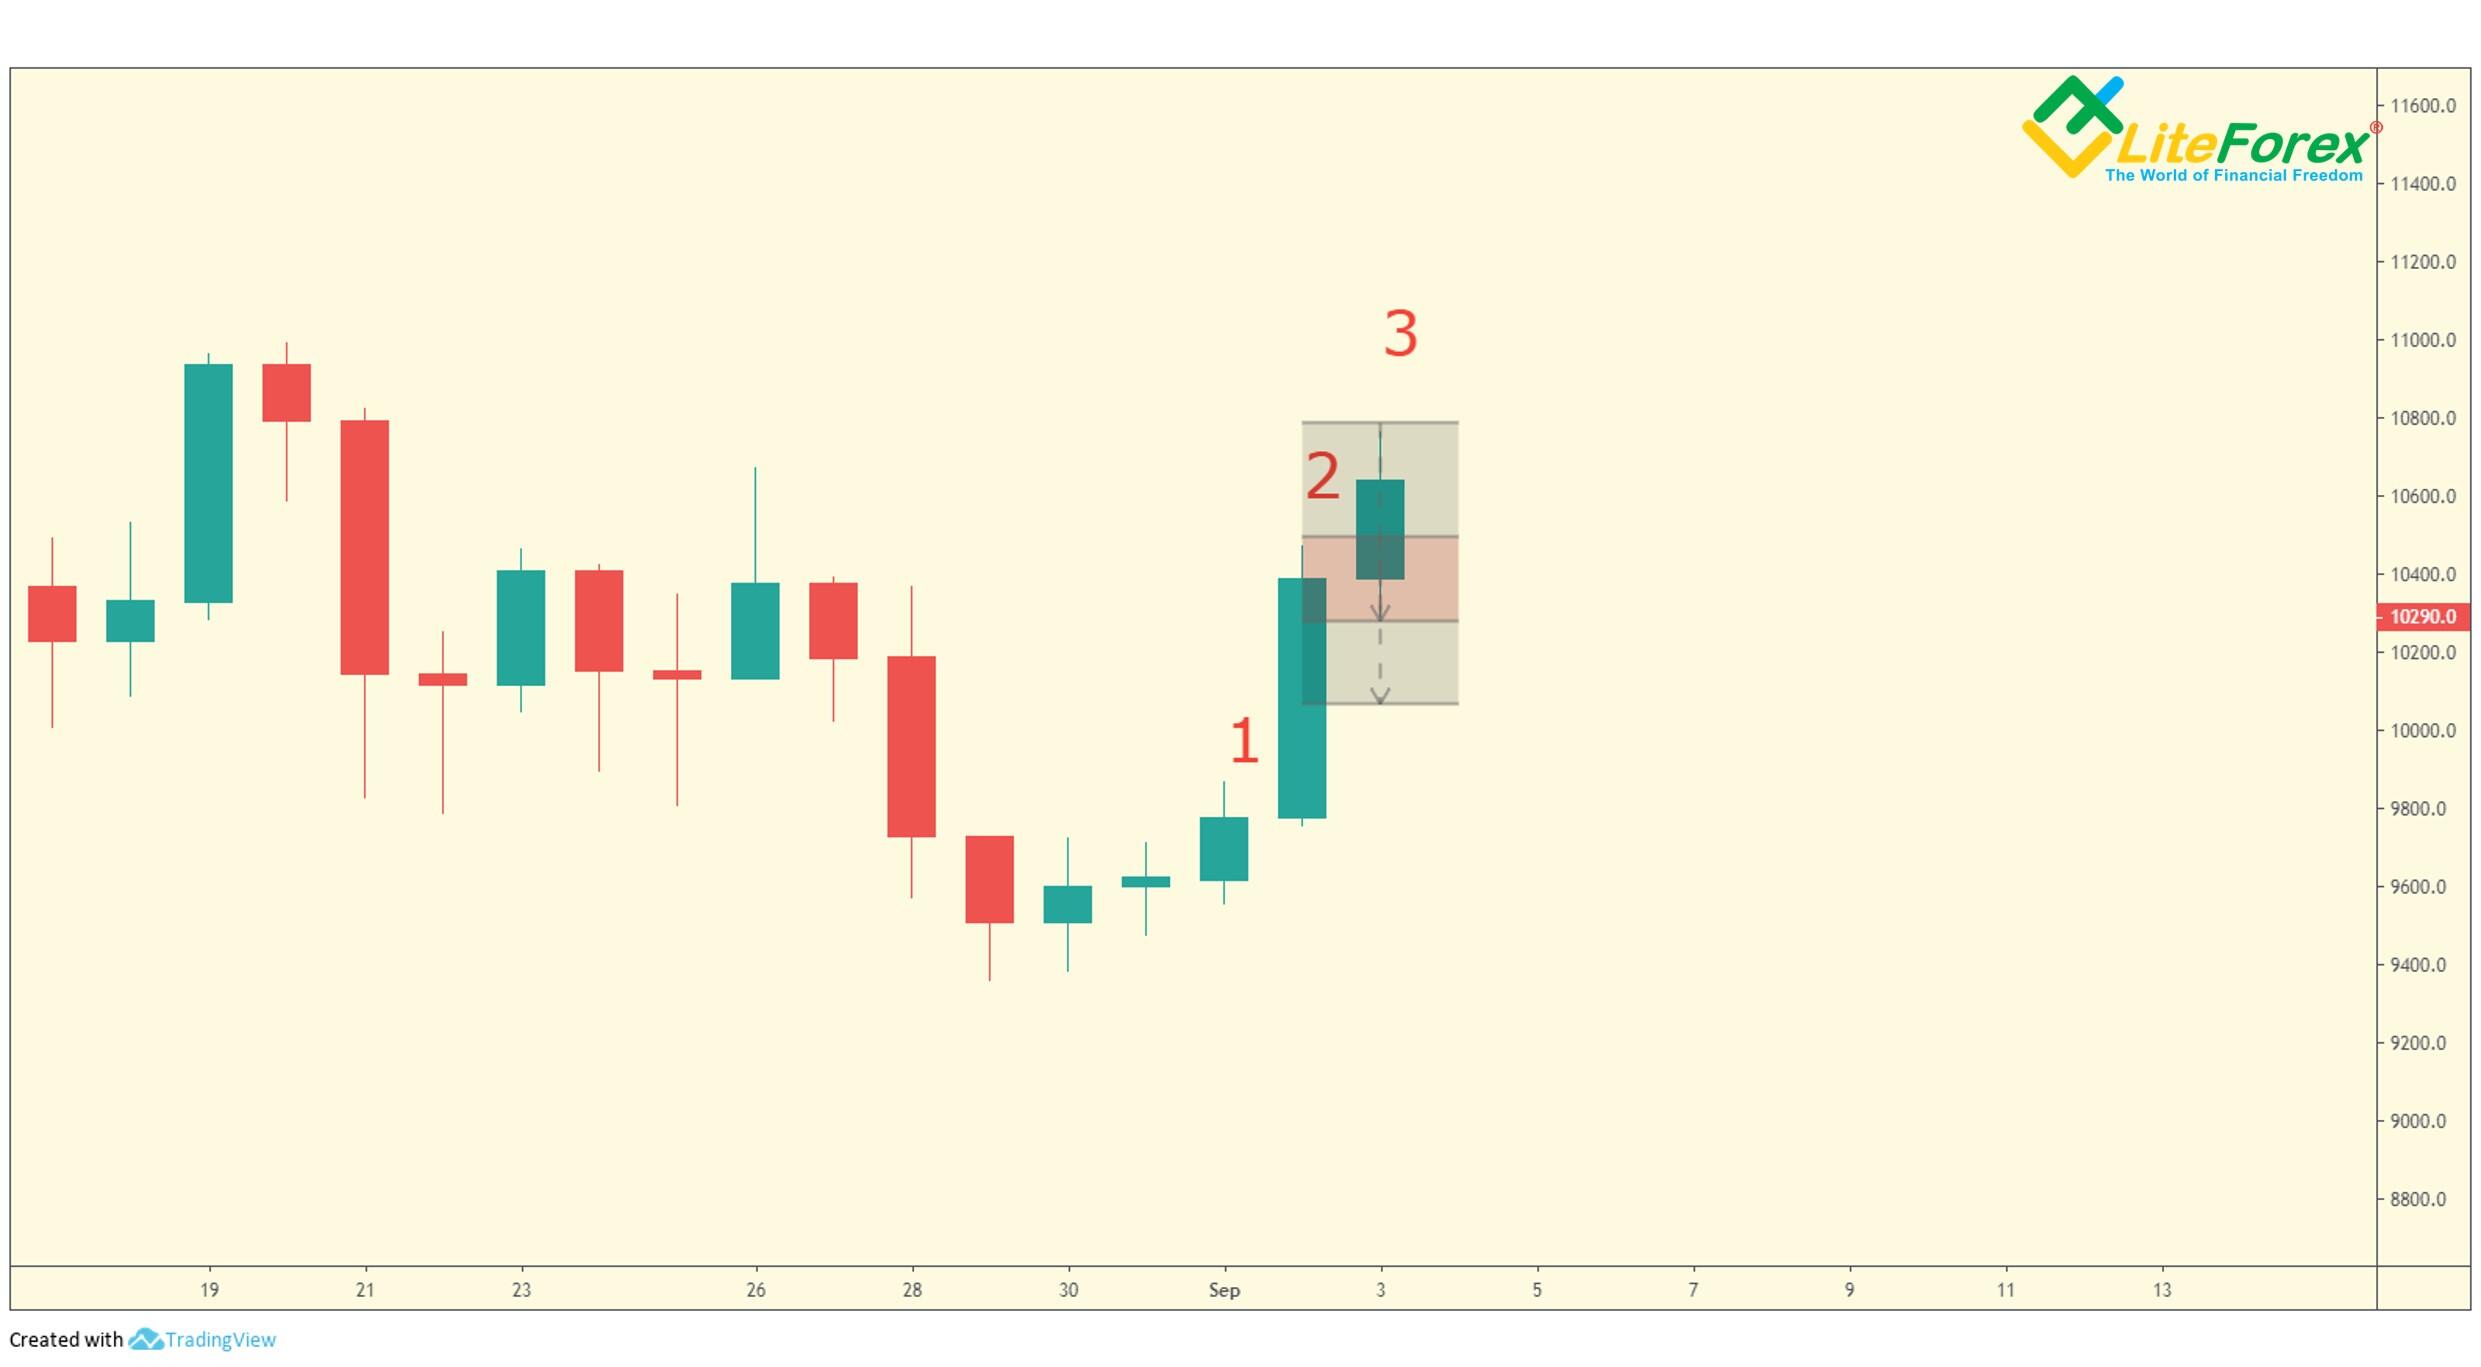
In the daily BTCUSD price chart above, the close of bar 2 is greater than the open. So, the X parameter is calculated according to the formula:
X = (2 * Current High + Current Low + Current Close)/2
X = (2 х 10477 + 9757 + 10385) / 2 = 20548
Now, to calculate the projected high, we subtract the current low from X; to calculate the low, we subtract the current high from X.
MAX = 20548 – 9757 = 10791
MIN = 20548 – 10477 = 10071

So, we have found out the price range between the projected high and low, it is marked with gray. You see that the projected range also indirectly suggests the assumed price growth during the next day, so, it confirms our forecast made by means of TD Reverse Differential.
This information will be acute when differential arrows and Waldo Patterns deliver opposite signals. In this situation, the range defined with the TD Range Projection will indicate the direction the price is likely to be moving in. Or, if the range is opposite the most recent closed bar, it will signal a potential consolidation period and the price correction.
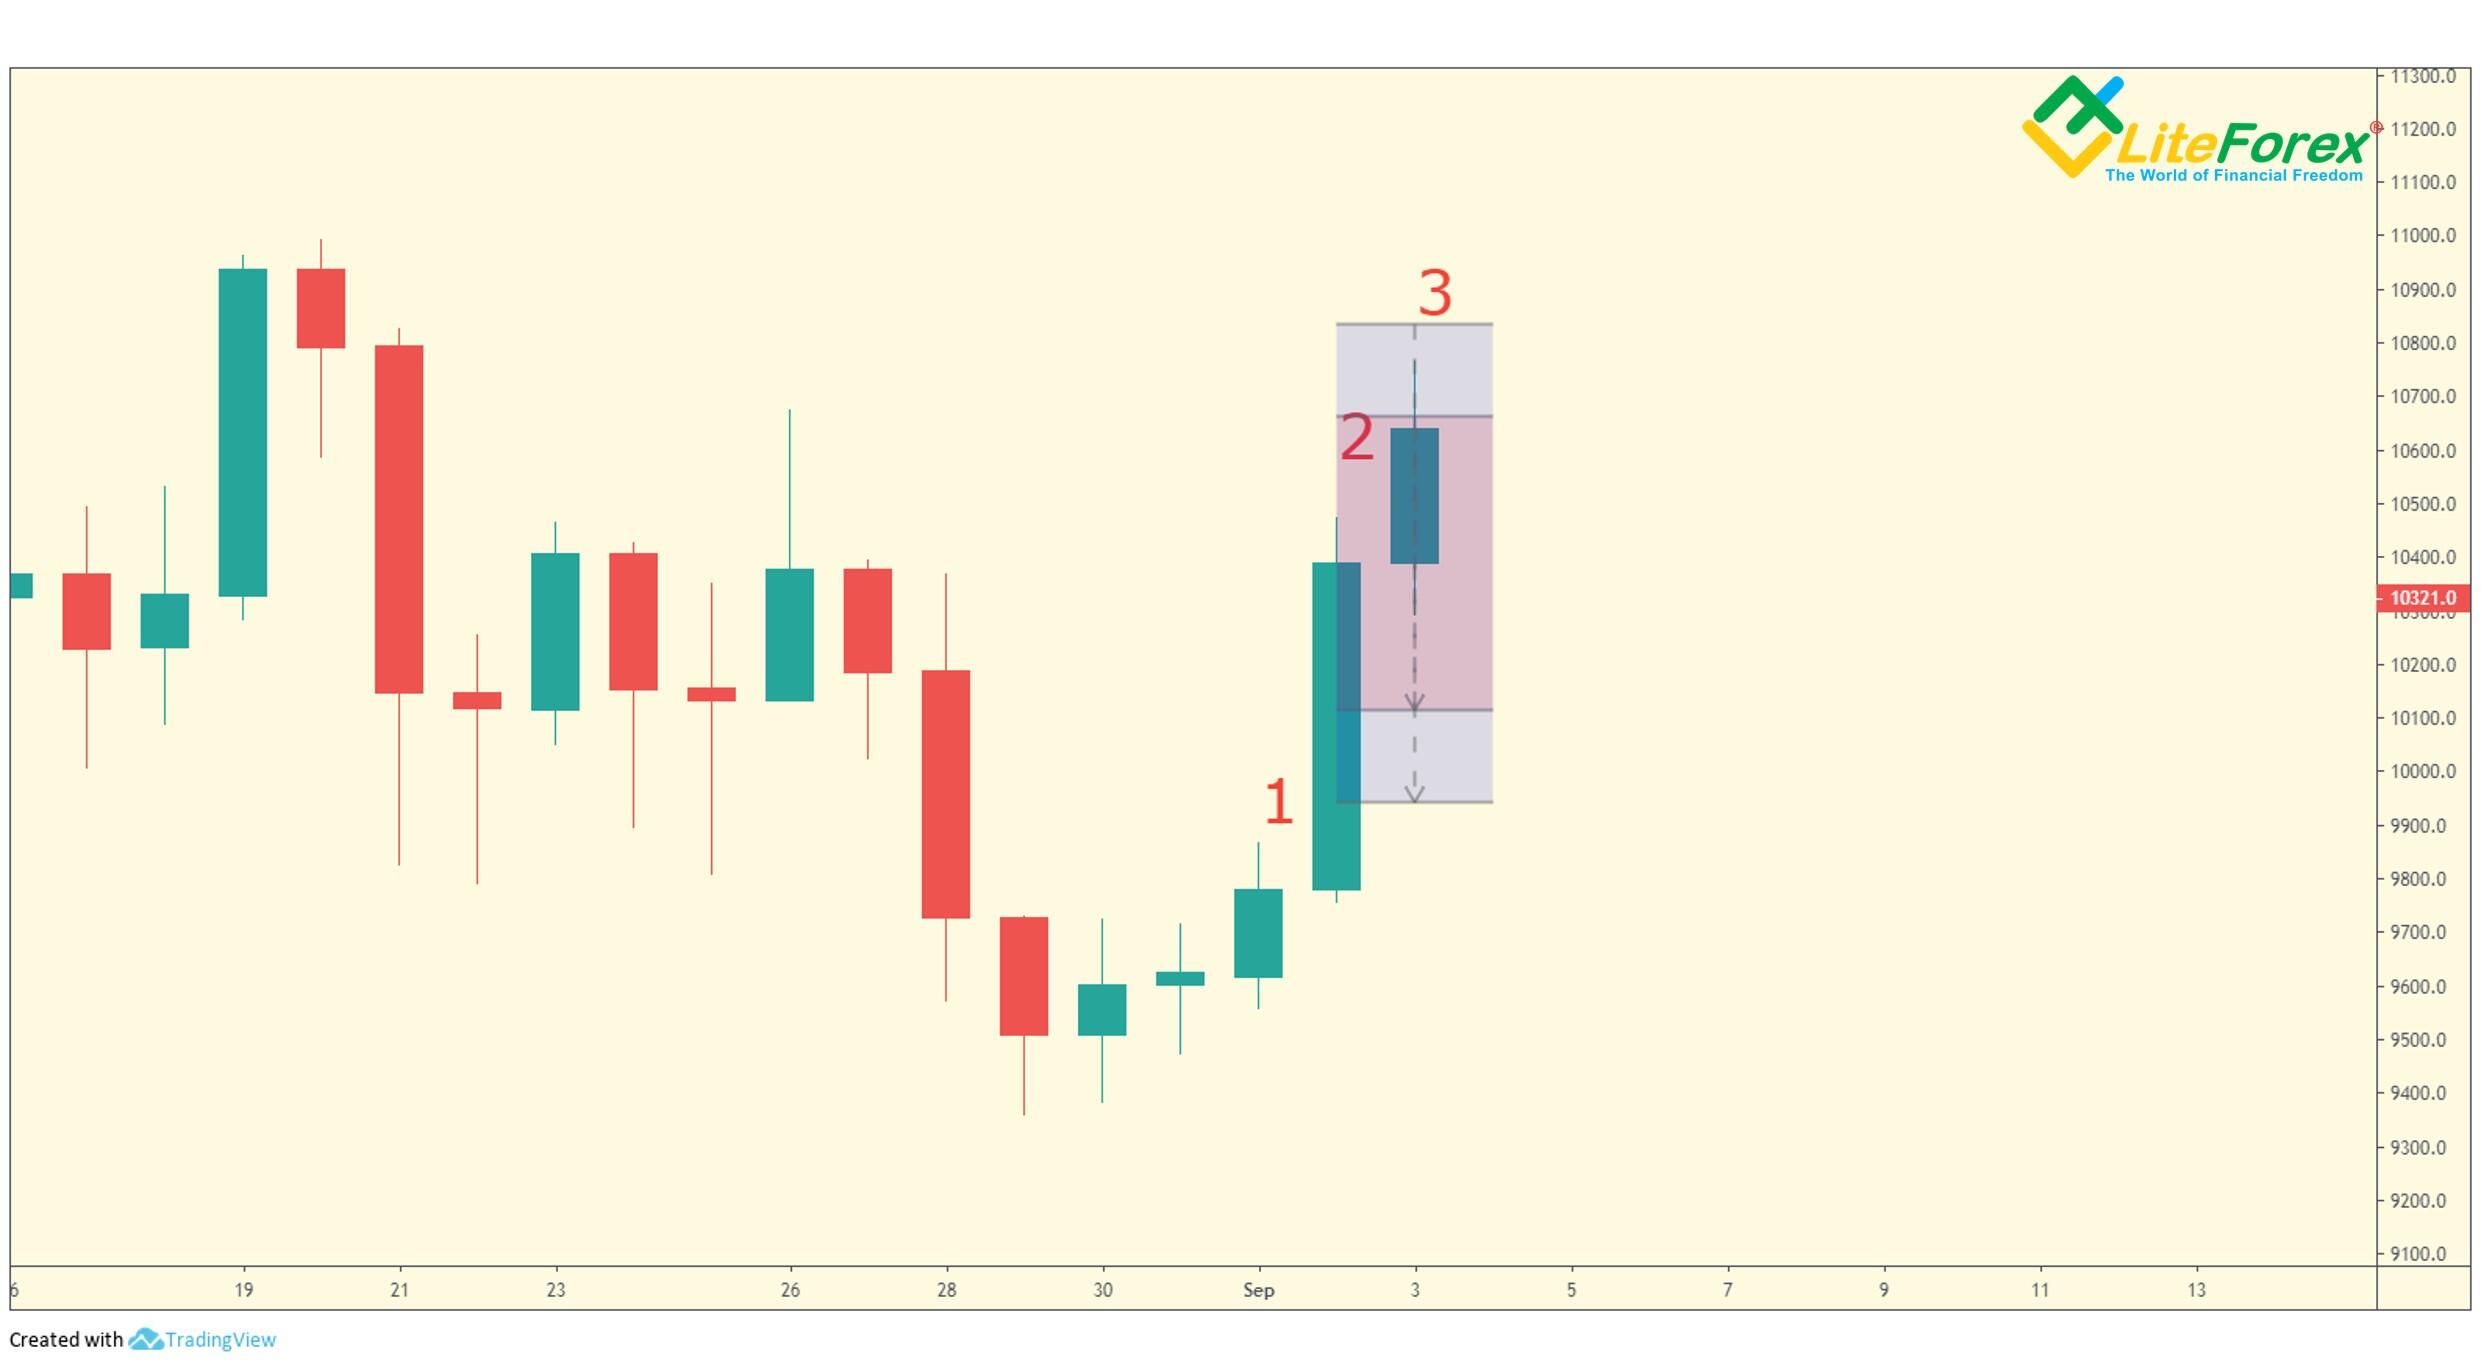
As you see from the chart above, on the next day (bar 3), the price was within the identified zone of TD Range Projection, so the trend direction indicated by TD Differential Arrows was confirmed.
To get more information, I suggest calculating Tolerance Levels. Remember, the TD Tolerance Upside level is calculated by multiplying the previous bar’s true range by the ratio of 0.15 and adding it to the current open. Similarly, the Downside TD Tolerance level is defined by multiplying the previous bar’s true range by the ratio of 0.15 and subtracting it from the current open.
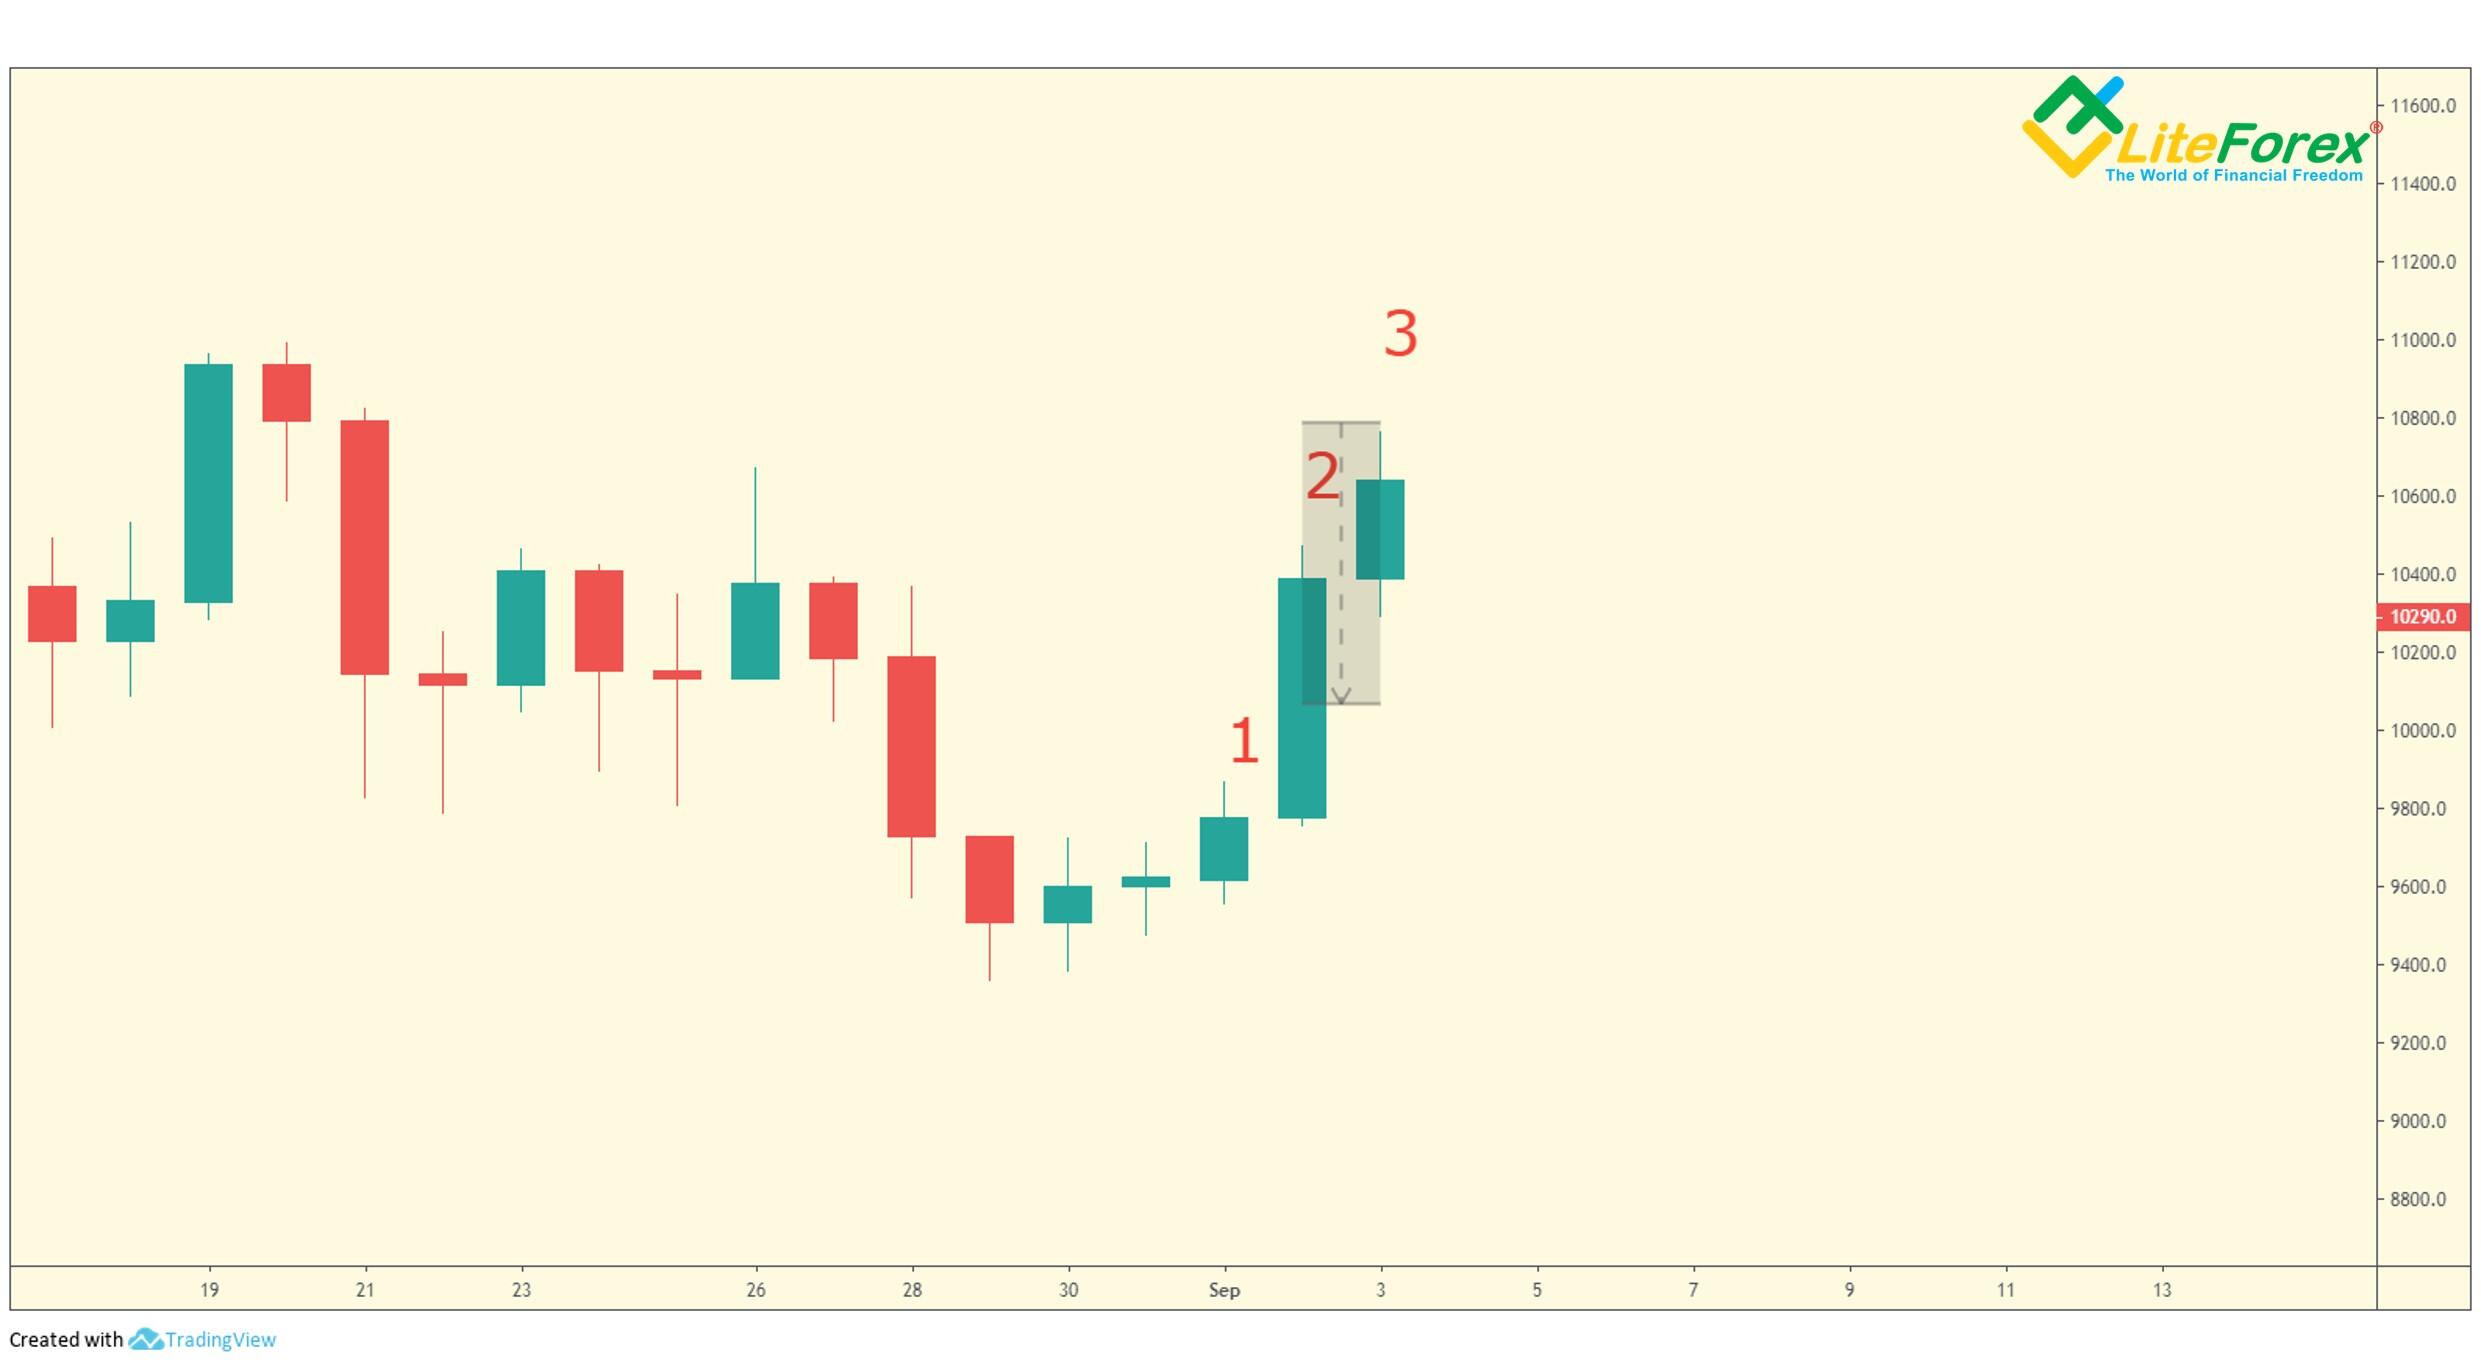
The true high of bar 2 is 10477 USD, and the true low is 9757 USD.
The true range of the bar in the above chart is within the gray zone, it is 10477 – 9757 = 720 USD.
We also need the opening price of bar 3, it is 10389 USD.
Therefore, the Tolerance Levels will be:
Upside TD Tolerance Level = 10389 + 0,15*720 = 10497 USD
Downside TD Tolerance Level = 10389 – 0,15*720 = 10281 USD
The Tolerance Levels are long the borders of the red zone.
I will remind how to apply the TD Tolerance Levels to making BTC price forecasts. There are four rules:
- If price opens within the range and moves below the DownsideTD Tolerance Level before reaching the Range high, then it is likely to close in the range.
- If the price opens within the range and moves above the UpsideTD Tolerance Level before reaching the range low, it is likely to close in the range.
- If the price reaches the Range high before reaching the Downside TD Tolerance Level, it is likely to close above the high indicated by the TD Range Projection.
- If the price reaches the Range low predicted by the TD Range Projection before reaching the Upside TD Tolerance level of the projected high, it is likely to close below the current low of TD Range Projection.
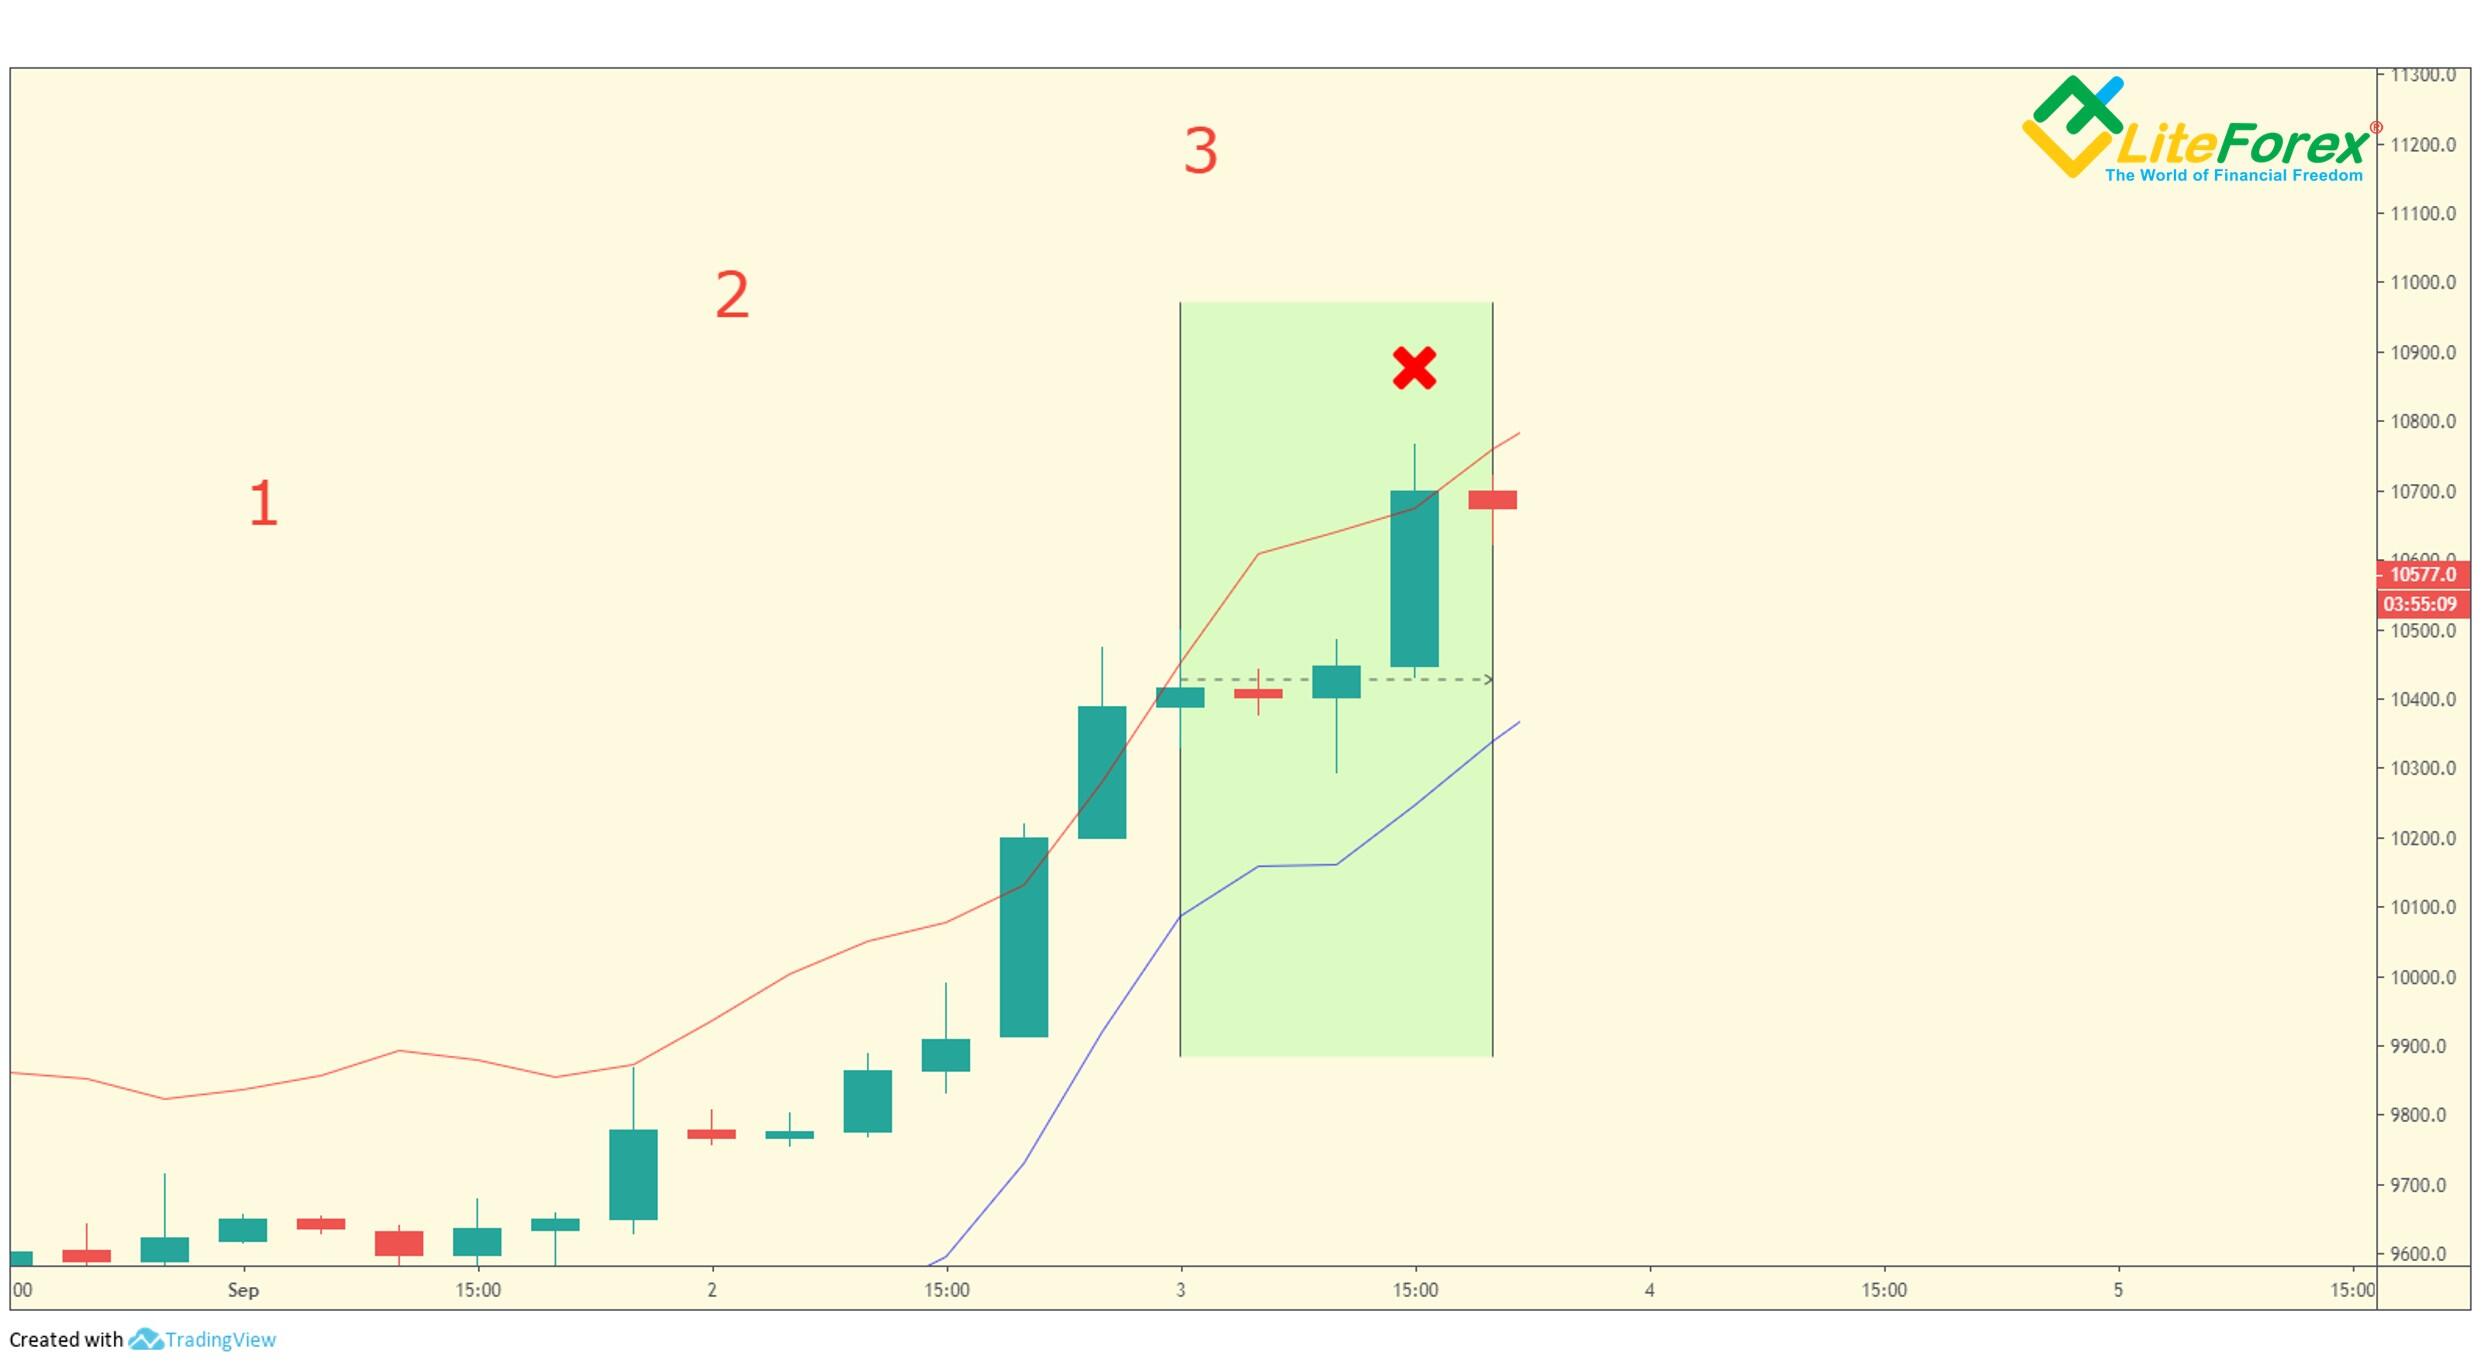
Let us look at the hourly BTC chart below.
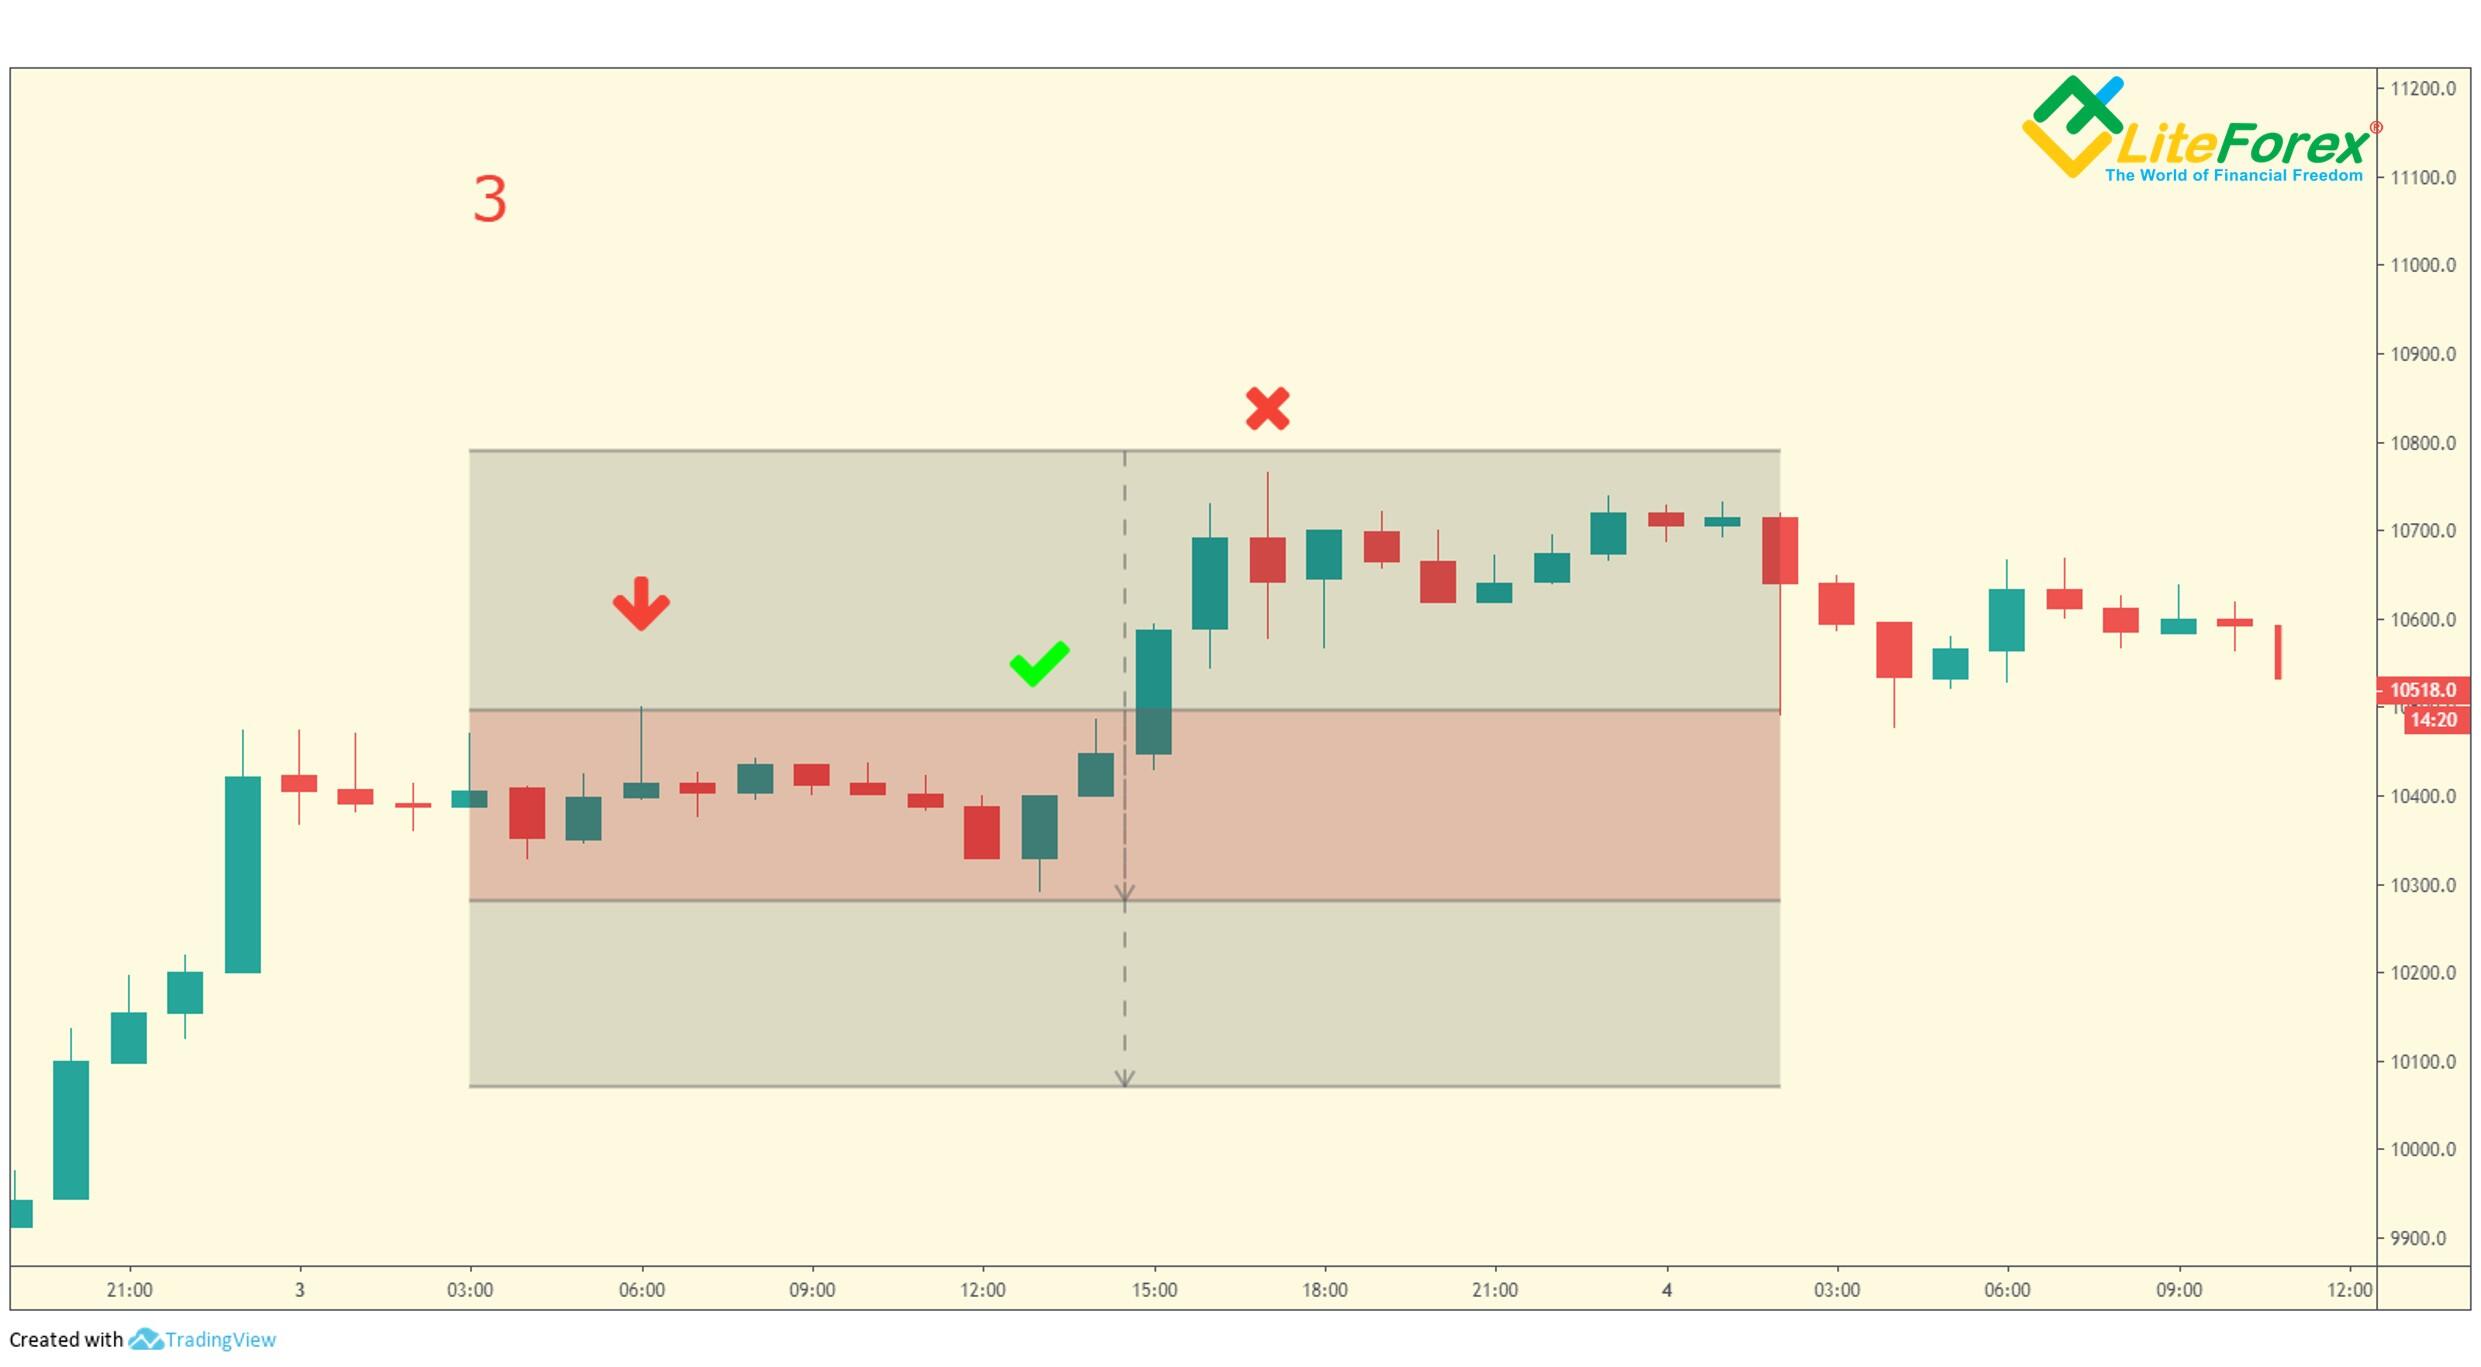
As you see, the price has moved above the Upside TD Tolerance Level before reaching the low of TD Range Projection (marked with the red arrow). So, condition number 2 is met, and the bar should close in the TD Range Projection.
As for the entry point, considering the price rise during the week suggested before, a perfect moment to enter a long would be moment when the price reached the Downside Tolerance level (marked with a green tick), as the bar would hardly close below this level, based on the signals sent by the Range Projection and Differential Arrows.
I would set a take profit around the upper level of the TD Range Projection. That is, the position would be closed automatically when the price was reaching the level (marked with a red cross).
Therefore, the breakout of the TD Range Projection and TD Tolerance Level allows entering profitable short-term trades, knowing the price trend during the day.
TD REBO
TD REBO identifies true breakouts of levels within a bar. I described this indicator in detail in this article.
In this strategy, it is used as an alternative to TD Range Projection with Tolerance Levels. It has one significant advantage as its calculation method is simpler.
An example is below.
We calculate the true range of bar 2, it is 720 USD.
Next, we consecutively multiply it by factors 0.382 and 0.618. To find out the growth levels, we add these values to the current open, and to identify the downside levels, we subtract these values from the current bar’s open price.
L1+ = 10389 + (720 х 0.382) = 10664
L2+ = 10389 + (720 х 0.618) = 10834
L1- = 10389 - (720 х 0.382) = 10114
L2- = 10389 - (720 х 0.618) = 9944
In the chart, the first TD REBO levels are highlighted with purple and the second levels – with light blue. Now, we need to check the signal qualifiers:
- If the last bar’s close is lower than the close of the previous, and the current price is rising and has broken out the first upside level, it is likely to be rising up to at least the second level.
- If the last bar’s close is greater than the previous bar’s close, and the current price is falling fast and has broken out the first downside level, it is likely to continue falling down to at least the second level.
- If the close levels of the current and the previous bars are equal or are next to each other, then the price may be moving both up and down, and it may break out level 1 either upside or downside, but, if one of the Levels 1 is broken out, the target at the Level 2 is likely to be reached.
In our case, the close of bar 2 was higher than the previous close, marked with number 1. Therefore, we should follow the second rule in our forecasts. I will again use the hourly chart as an example.
As you see from the chart above, the further conditions of the qualifier are not met, the price moves up and breaks through the first level but doesn’t reach the second level or goes down to the first level.
So, the qualifier condition is not satisfied, and the buy signal was false.
To mitigate the flaws of the TD Projection indicators, I suggest using TD Channel and TD Sequential in shorter timeframes.
TD Channels
TD Channel I and TD Channel II help us to specify the range of price movements for the next day. Price bands are calculated by multiplying the series of the recent price extremes by particular ratios. You can learn more about price channels and the calculation of price bands in this article. In this article, I will deal with practical examples.
TD Channel I
Remember, when the price is moving within a particular range, the market will be within TD Channel I. When the closing price breaks through the channel’s border, the ongoing trend is likely to be exhausting and could reverse soon.
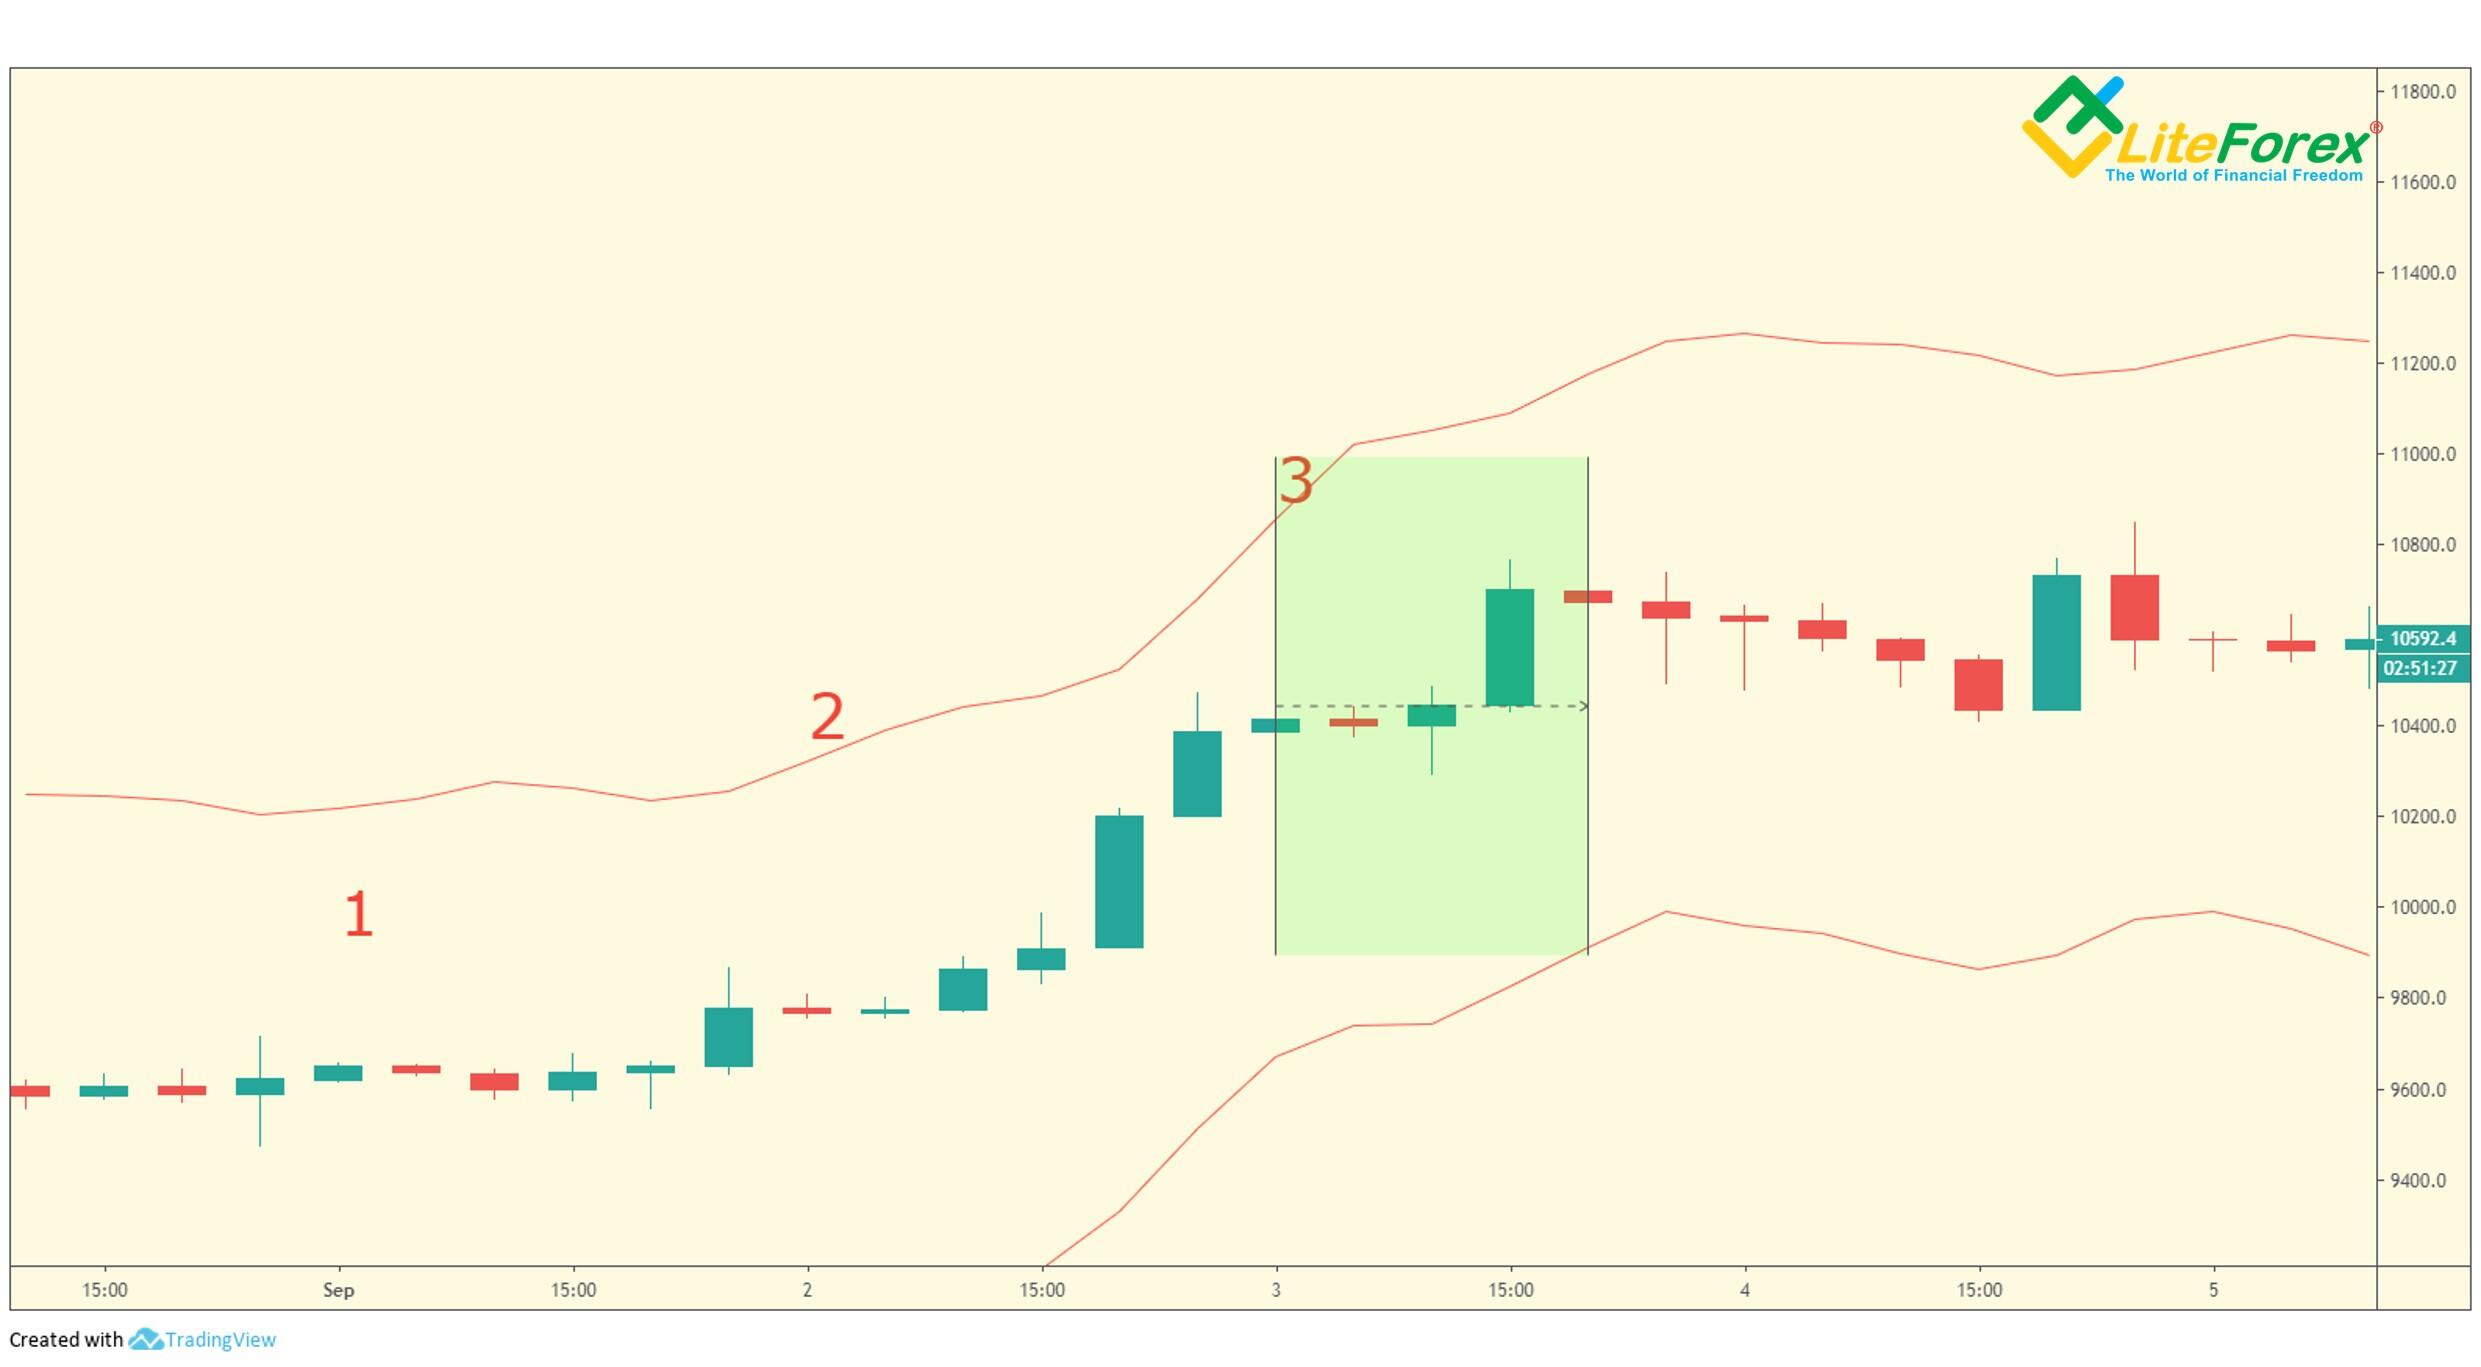
In the case with the BTCUSD, the shortest timeframe, where the TD Channel I and TD Channel II are efficient is H4. So, I use this timeframe in trading. You can also experiment with different timeframes and choose the most convenient period for you.
For a more correct channel display in the 4-hour timeframe, I applied the factors of 1.03 and 0.97. I can also use alternative factors 1.09 and 0.97 in practice.
There no signals indicating the downtrend reversal upward in the 4-hour chart. However, there is a signal that, at the end of the day, the bullish trend has exhausted, and the price should be corrected down soon. So, if we have entered a trade based on the TD Range Projection recommendation, we should have exited it once the bar marked with green cross finished.
Remember, I recommended exiting the long roughly at the same time in the analysis with the TD Range Projection. I will present the chart once again to illustrate.

The difference is that we wouldn’t have taken the maximum profit if we had acted based on the TD Range Projection. The TD Channel I, however, allows us not only to check our assumptions but also to anticipate the reversal in advance and to take the maximum profit.
TD Channel II
If in the case with the TD Channel I, it is enough to suggest the trend exhaustion and its prospective reversal when the close of one bar crosses the channel’s borders, the TD Channel II will deliver such a signal when two consecutive bars close at a needed level. Concerning all the rest, the principle of working with this indicator remains the same.
Depending on the correctness of the channels display, I use either classical factors of 0.995 and 1.005 or their alternatives, 0.930 and 1.070.
Let us have a look at the charts:
There are no signals in the 4-hour BTCUSD price chart. By the way, I used the factors of 0.930 and 1.070 in my analysis. So, we shall refer to similar signals delivered by TD Range Projection and TD Channel I.
Therefore, the TD Channel is employed as a confirming, supplementary tool to identify the entry and exit points. But we can get even more accurate data using the TD Sequential indicator.
TD Sequential
Basically, the indicator shows the end of local trends, helping to identify when the trend is fading and starting to reverse. This is the best tool to find out good entry points. I will describe its application on the example of the hourly timeframe.
This forecasting tool consists of three elements:
- Price flip is a signal of a potential reversal.
- Setup filters out the signals, that is, it identifies where a new trend starts and when there is only a correction within the current trend.
- Countdown calculates the trend length to identify the moment of its fading and the emerging of a new cycle, Price flip element.
You can learn everything about this tool in this article.
Guide to TD Sequential application
You buy (sell) when the TD Buy (Sell) Setup pattern is complete:
- An ideal position has formed.
- None of the bars has broken through the TDST Support (Resistance).
You buy (sell) when there is a completed TD Buy (Sell) Countdown pattern:
- For aggressive trading – after the 13th closes.
- For conservative trading – after the Price Flip forms.
Example:
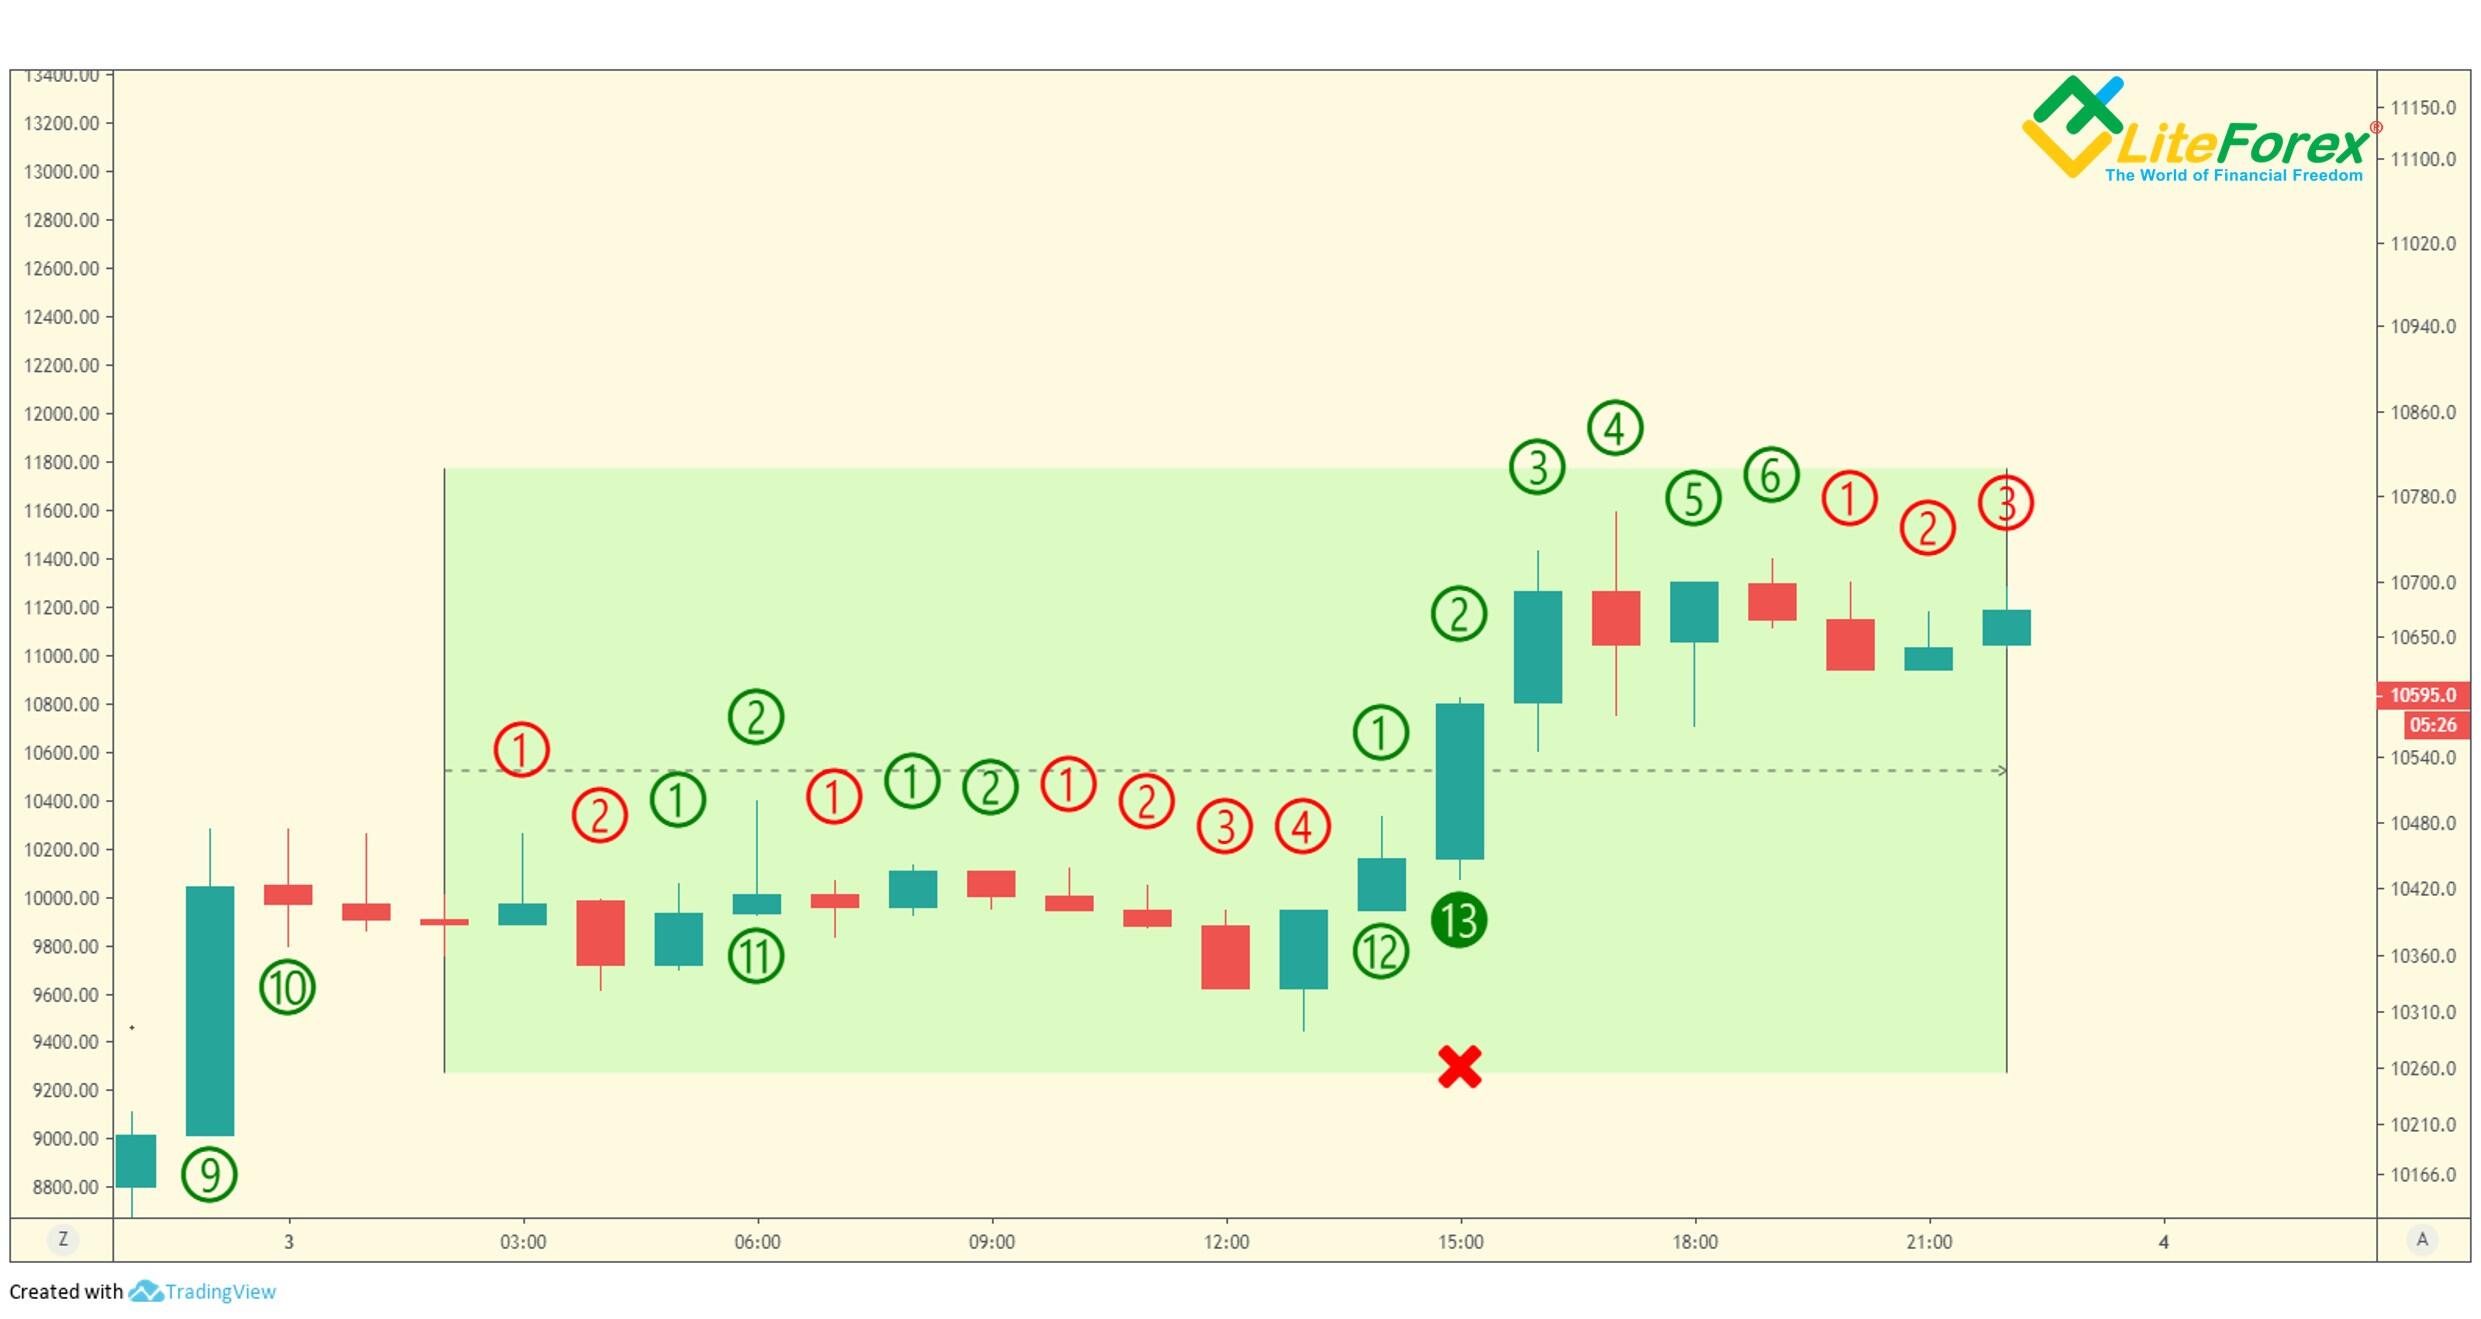
In the hourly chart above (the analyzed day is marked with green), there is a complete TD Buy Countdown pattern. The last 13th bar is marked with a red cross. This signal suggests that the bullish trend should reverse soon. In our case, it is already the third signal suggesting that we should exit the long position at the bar marked with the red cross.
With the help of this tool, you can identify the ideal points to enter and exit trades. Besides, if you are not an aggressive trader, act according to the TD Sequential signals only if they repeat or refine signals delivered by the TD Range Projection, TD Range Expansion Breakout и TD Channels.
Final algorithm of trend trading strategy
- Identify daily trends using TD Differential, TD Reverse Differential or TD Anti-Differential.
- If you can, confirm the forecast for the daily trend using TD Waldo Patterns.
- Use the TD Range Projection and the TD Range Expansion Breakout to identify the range for intraday prices. Further, you enter a trade according to the direction of the daily trend taking into account the price range. When you enter a long position, you set a take profit around L2+ and a stop loss at around L1-. If you are going to enter a short, a stop loss is at a level around L1+, and a target profit will be at L2-.
- You make a primary analysis of the price swings during the day on the hourly chart using TD Range Projection and TD Range Expansion Breakout and refer to the signals discovered when taking the entry/exit decisions.
- You analyze the 4-hour chart using TD Channels. Discover the potential pivot points for short-term trends and use this information to identify the entry/exit points or to confirm the points, identified by means of TD Range Projection and TD Range Expansion Breakout.
- Use the TD Sequential on the daily chart to confirm the forecast made and to find out the best entry/exit point provided that the signals are confirmed in longer timeframes.
Based on my own experience, I can say that this combination of indicators is the most optimal and is suitable for low-frequency trend trading intraday. However, this set of tools is not the ultimate solution. You can combine multiple indicators created by Thomas DeMark like blocks of the constructor. So, the strategies based on DeMark's indicators are very flexible and easily adjusted to any market conditions.
Soon, I am going to publish analytics and forecasts for different trading instruments, not only for cryptocurrencies. This will allow you to assess the quality and reliability of Thomas DeMark’s indicators and better understand their application to different markets.
That is all so far.
Subscribe not to miss anything new!
I wish you good luck and good profits!
PS. If you agree with my ideas, write “+” in the comments; if you don’t agree, put “-”. If you liked the post, just write thank you, and don’t forget to share the post. It is easy for you and I will be very pleased :)
Stay informed on the latest cryptocurrency news, follow my posts on the blog.
Useful links:
I recommend trying to trade with a reliable broker here. The system allows you to trade by yourself or copy successful traders from all across the globe.
Telegram channel with high-quality analytics, Forex reviews, training articles, and other useful things for traders http://t.me/litefinance.

Price chart of BTCUSD in real time mode
The content of this article reflects the author’s opinion and does not necessarily reflect the official position of LiteFinance broker. The material published on this page is provided for informational purposes only and should not be considered as the provision of investment advice for the purposes of Directive 2014/65/EU.
According to copyright law, this article is considered intellectual property, which includes a prohibition on copying and distributing it without consent.