TD Waldo Patterns: calculation formula, necessary conditions, properties, signals, theory and practice of application
Dear friends,
This is so far my final article devoted to Thomas DeMark’s indicators, which will describe the so-called TD Waldo Patterns.
In the previous articles, I described the application of such DeMark's tools as:
- TD Trend Factor and TD Propulsion (see here).
- TD Retracements (see here).
- TD Lines of demand and supply.
- TD D-Wave (see here).
- TD Sequential and TD Combo (see here).
- TD REI and TD POQ (see here).
- TD DeMarker 1 and 2, TD Pressure, TD ROC, TD Alignment (see here).
- TD Moving Averages (see here).
- TD Range Projection (see here).
- TD REBO and TD Channels (see here).
- TD Differential, TD Anti-Differential, TD Reverse Differential (see here).
Where does the name come from?
Waldo is a character of a series of books and cartoons created by a famous author and artist Martin Handford. Where’s Waldo? cartoons depict busy crowd scenes, often containing hundreds of different characters. The challenge for the reader is to find Waldo, who is hidden somewhere amid the hustle and bustle.
These cartoons suggested Thomas DeMark that in much the same way that you can find the cartoon character if you look closely enough, you can find meaningful patterns if you carefully inspect a price chart. So, DeMark described in his book a series of price relationships that he referred to as TD Waldo Patterns.
7 Waldo Chart patterns
At the very beginning of his career, Thomas DeMark faced difficulties in the practical application of traditional market analysis systems. Everything that seemed to be perfect in theory, often failed in practice. Then the young analyst decided to conduct his own research, which led to unexpected results. It turned out that some of the classic market models mean exactly the opposite of what is written in the textbooks.
He discovered a total of seven chart patterns, which he numbered two to eight (don’t ask me what happened to number one). As with many of the TD indicators, you can apply these patterns to any market or time frame. I will traditionally explain the examples on a daily timeframe.
TD Waldo Pattern Two
A prospective reversal bar can be identified when:
- The bar closes higher than the four previous closes. This is a potential upward reversal. There can be an opposite situation, when the market closes lower than the four previous closes (for a potential downward reversal). The first condition is also satisfied, when the close of the trend high is greater than the previous price bar, or the close of the trend low is less than or equal to the previous price bar;
- A down close occurs after a high or an up close occurs after a low, and the close following the high is greater than the close prior to the high, or the close following the low is less than the close prior to the low.
Let me use an example to explain the pattern:
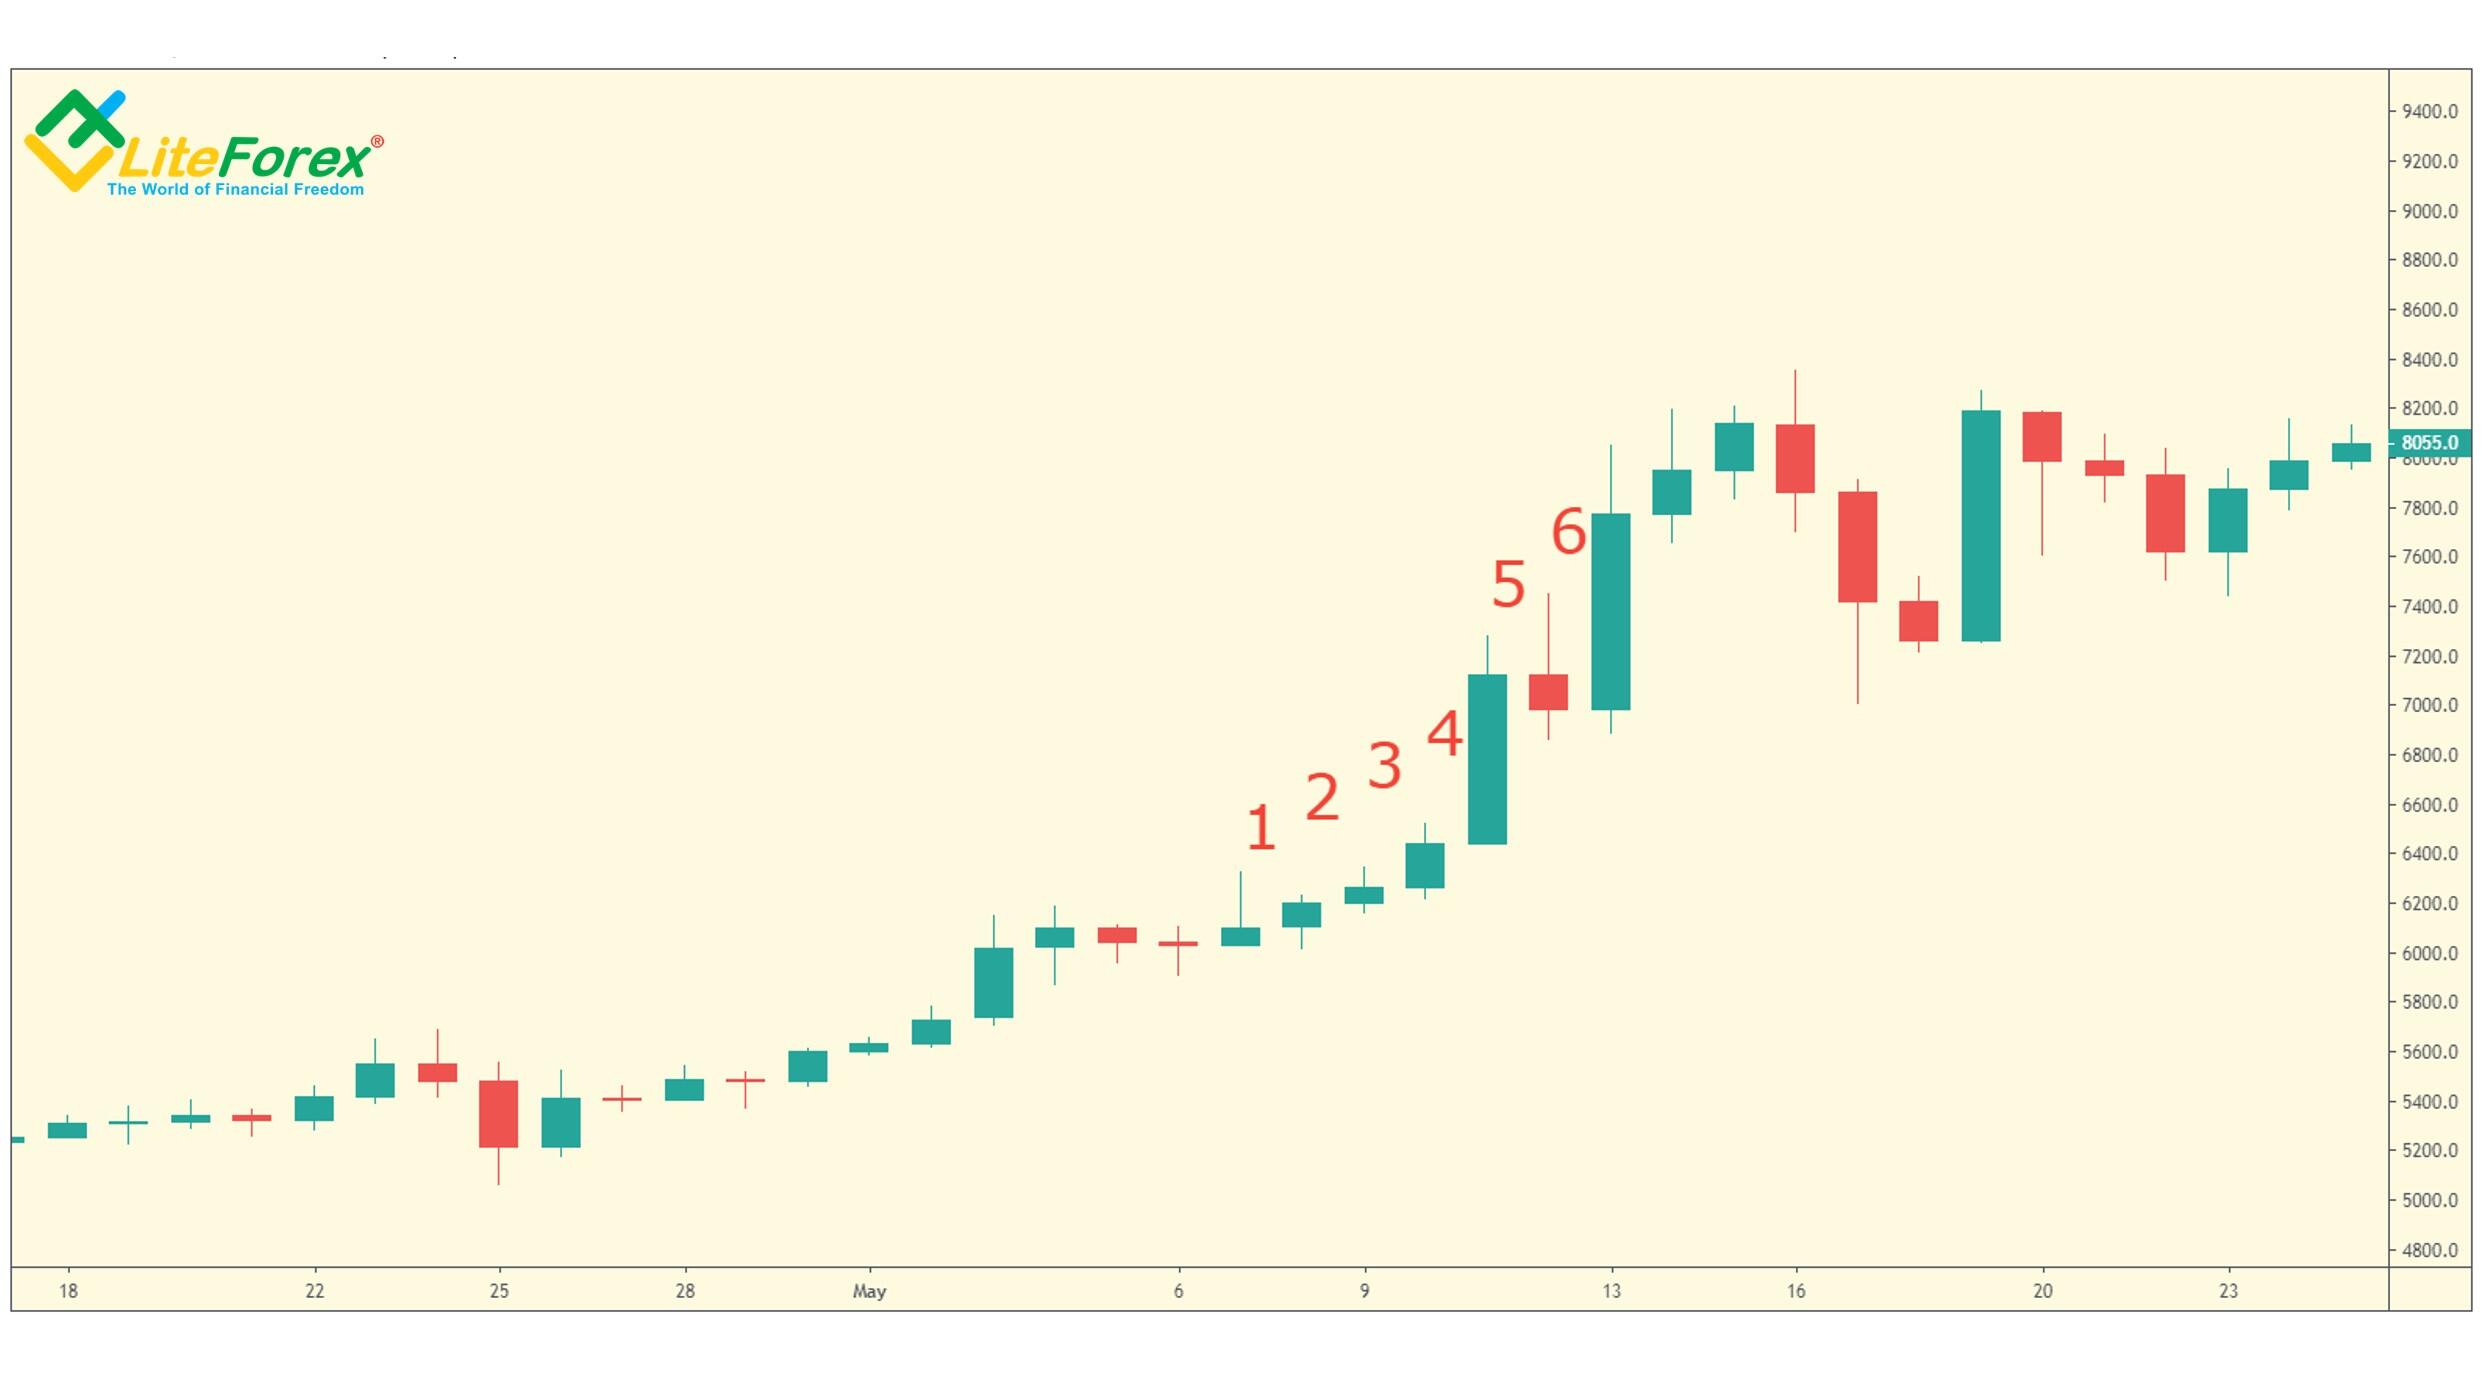
As you see from daily chart above, bar number 5 closes higher than the four previous closes. So, we can assume that the price should be rising in the near future. Following the studied bar, bar number 6 closes down (the close is lower than the opening price, marked with red in the chart). In addition, its close is higher than the closing price of the previous bar, bar number 4. Therefore,
For the second example, I will analyze the BTC monthly timeframe. Bar number 2 makes the local high in the chart; it closes higher than the previous bar number 1. The next bar following the high, bar number three closes down, and it is a little greater than the close prior to the high (bar number 1). So, we can assume a prospective reversal down.
TD Waldo Pattern Three
This pattern suggests that the market should soon enter a consolidation stage or there should soon start a short-term trend:
- If the most recent price bar has a range twice the range of the previous price bar, identify its value. Such bars often emerge when there has been a strong trend for a long time that is now near its exhaustion.
- To identify near-term downside price exhaustion, subtract the value from the close of the previous bar. To identify near-term upside exhaustion, add that value to the close of that bar.
- To signal that the bullish trend will reverse, the high of the previous price bar must be above the high two price bars earlier. Respectively, if there is a bearish trend, it is likely to reverse when the low of the previous price bar is below the low two price bars earlier.
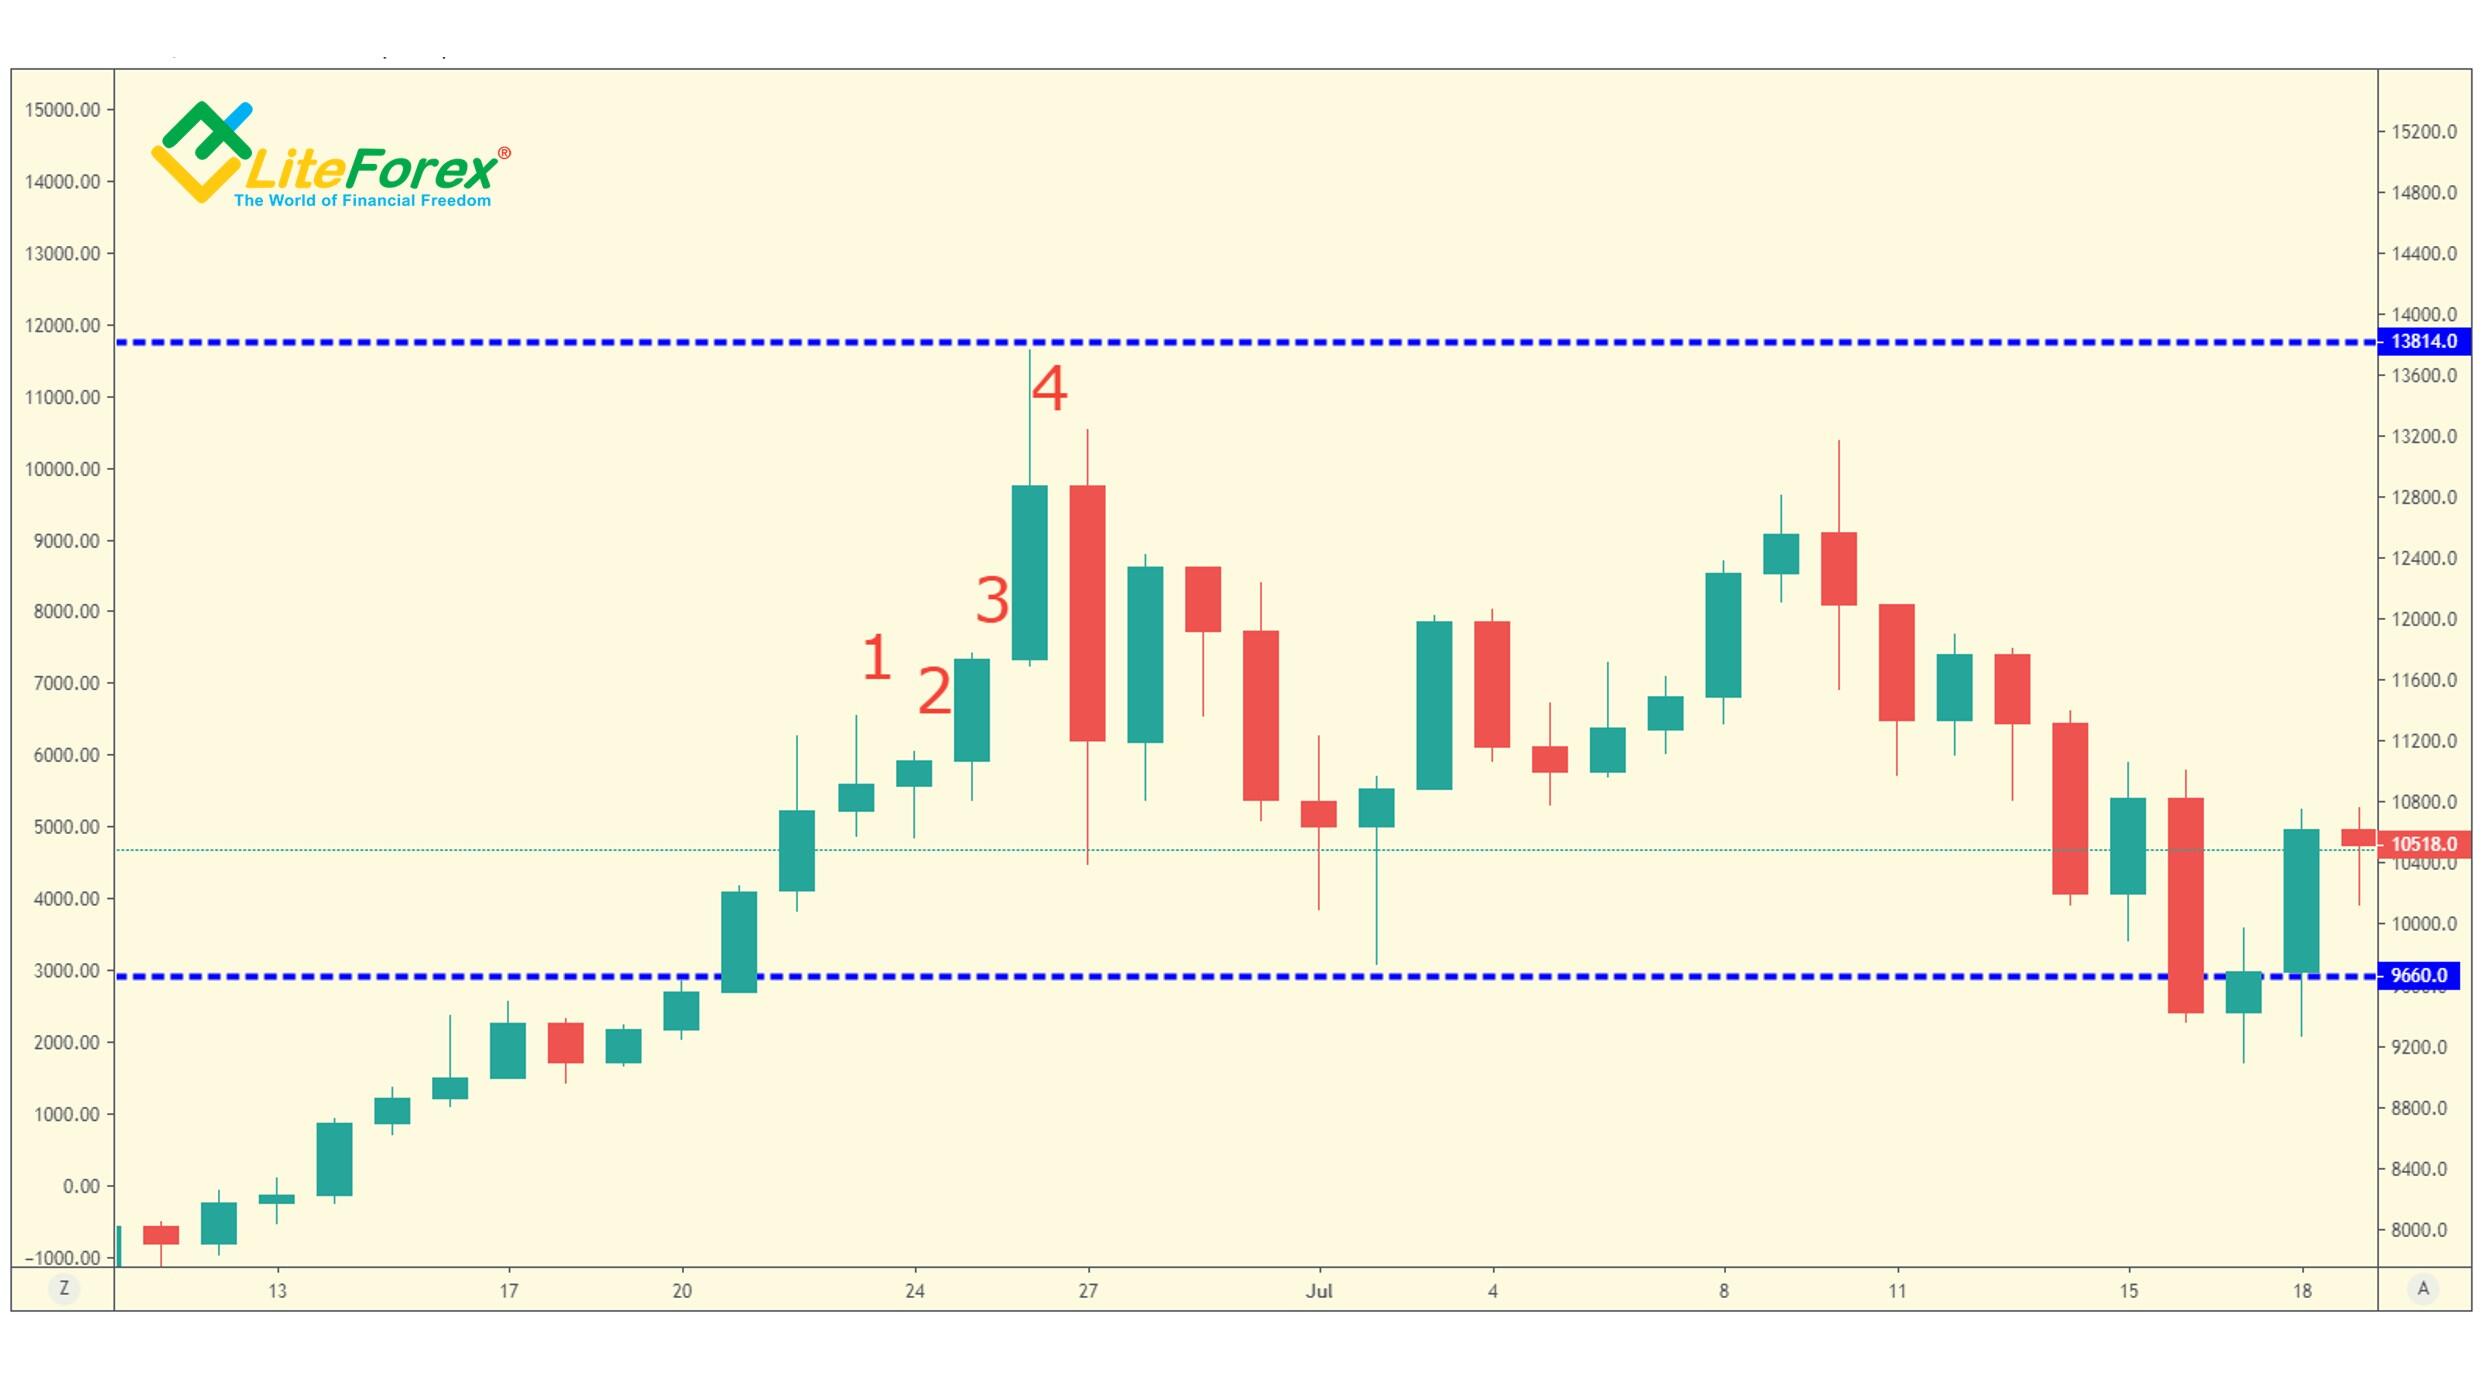
It is clear from the daily chart above that bar number 4 has the range twice the range of the previous price bar number 3. To calculate the exact value of the range we need to subtract the price low from its high:
13763 – 11686 = 2077.
To identify the resistance level, we need to add the defined range to the closing price of bar 3.
11737 + 2077 = 13814.
To find out the support level, we need to subtract the range of bar 4 from the closing price of bar 3:
11 737 – 2077 = 9660.
The support and resistance levels are marked with horizontal dotted lines in the chart. As the high of the previous bar number 3 is greater than the previous two highs, made by bars number 2 and 1. So, we can expect a prospective reversal downwards. In addition, the bearish trend is likely to be exhausted when the price approaches the support level at 9660. As you see from the chart, the following market situation has been in line with this forecast.
TD Waldo Pattern Four
Let us assume that the lowest price X was reached at least ten bars previously, and, prior to that low, all prior lows were higher. If the next two lows are lower than the X close, the bearish trend is likely to exhausting, and the trend is likely to reverse upwards soon.
Respectively, if the highest price (Y) was posted at least ten bars previously, and, prior to that high, all prior highs were lower and the lows of the next two price bars are above the closing price of Y, and both have higher closes than the close of Y, then the uptrend is exhausted near term and the price should start declining soon.
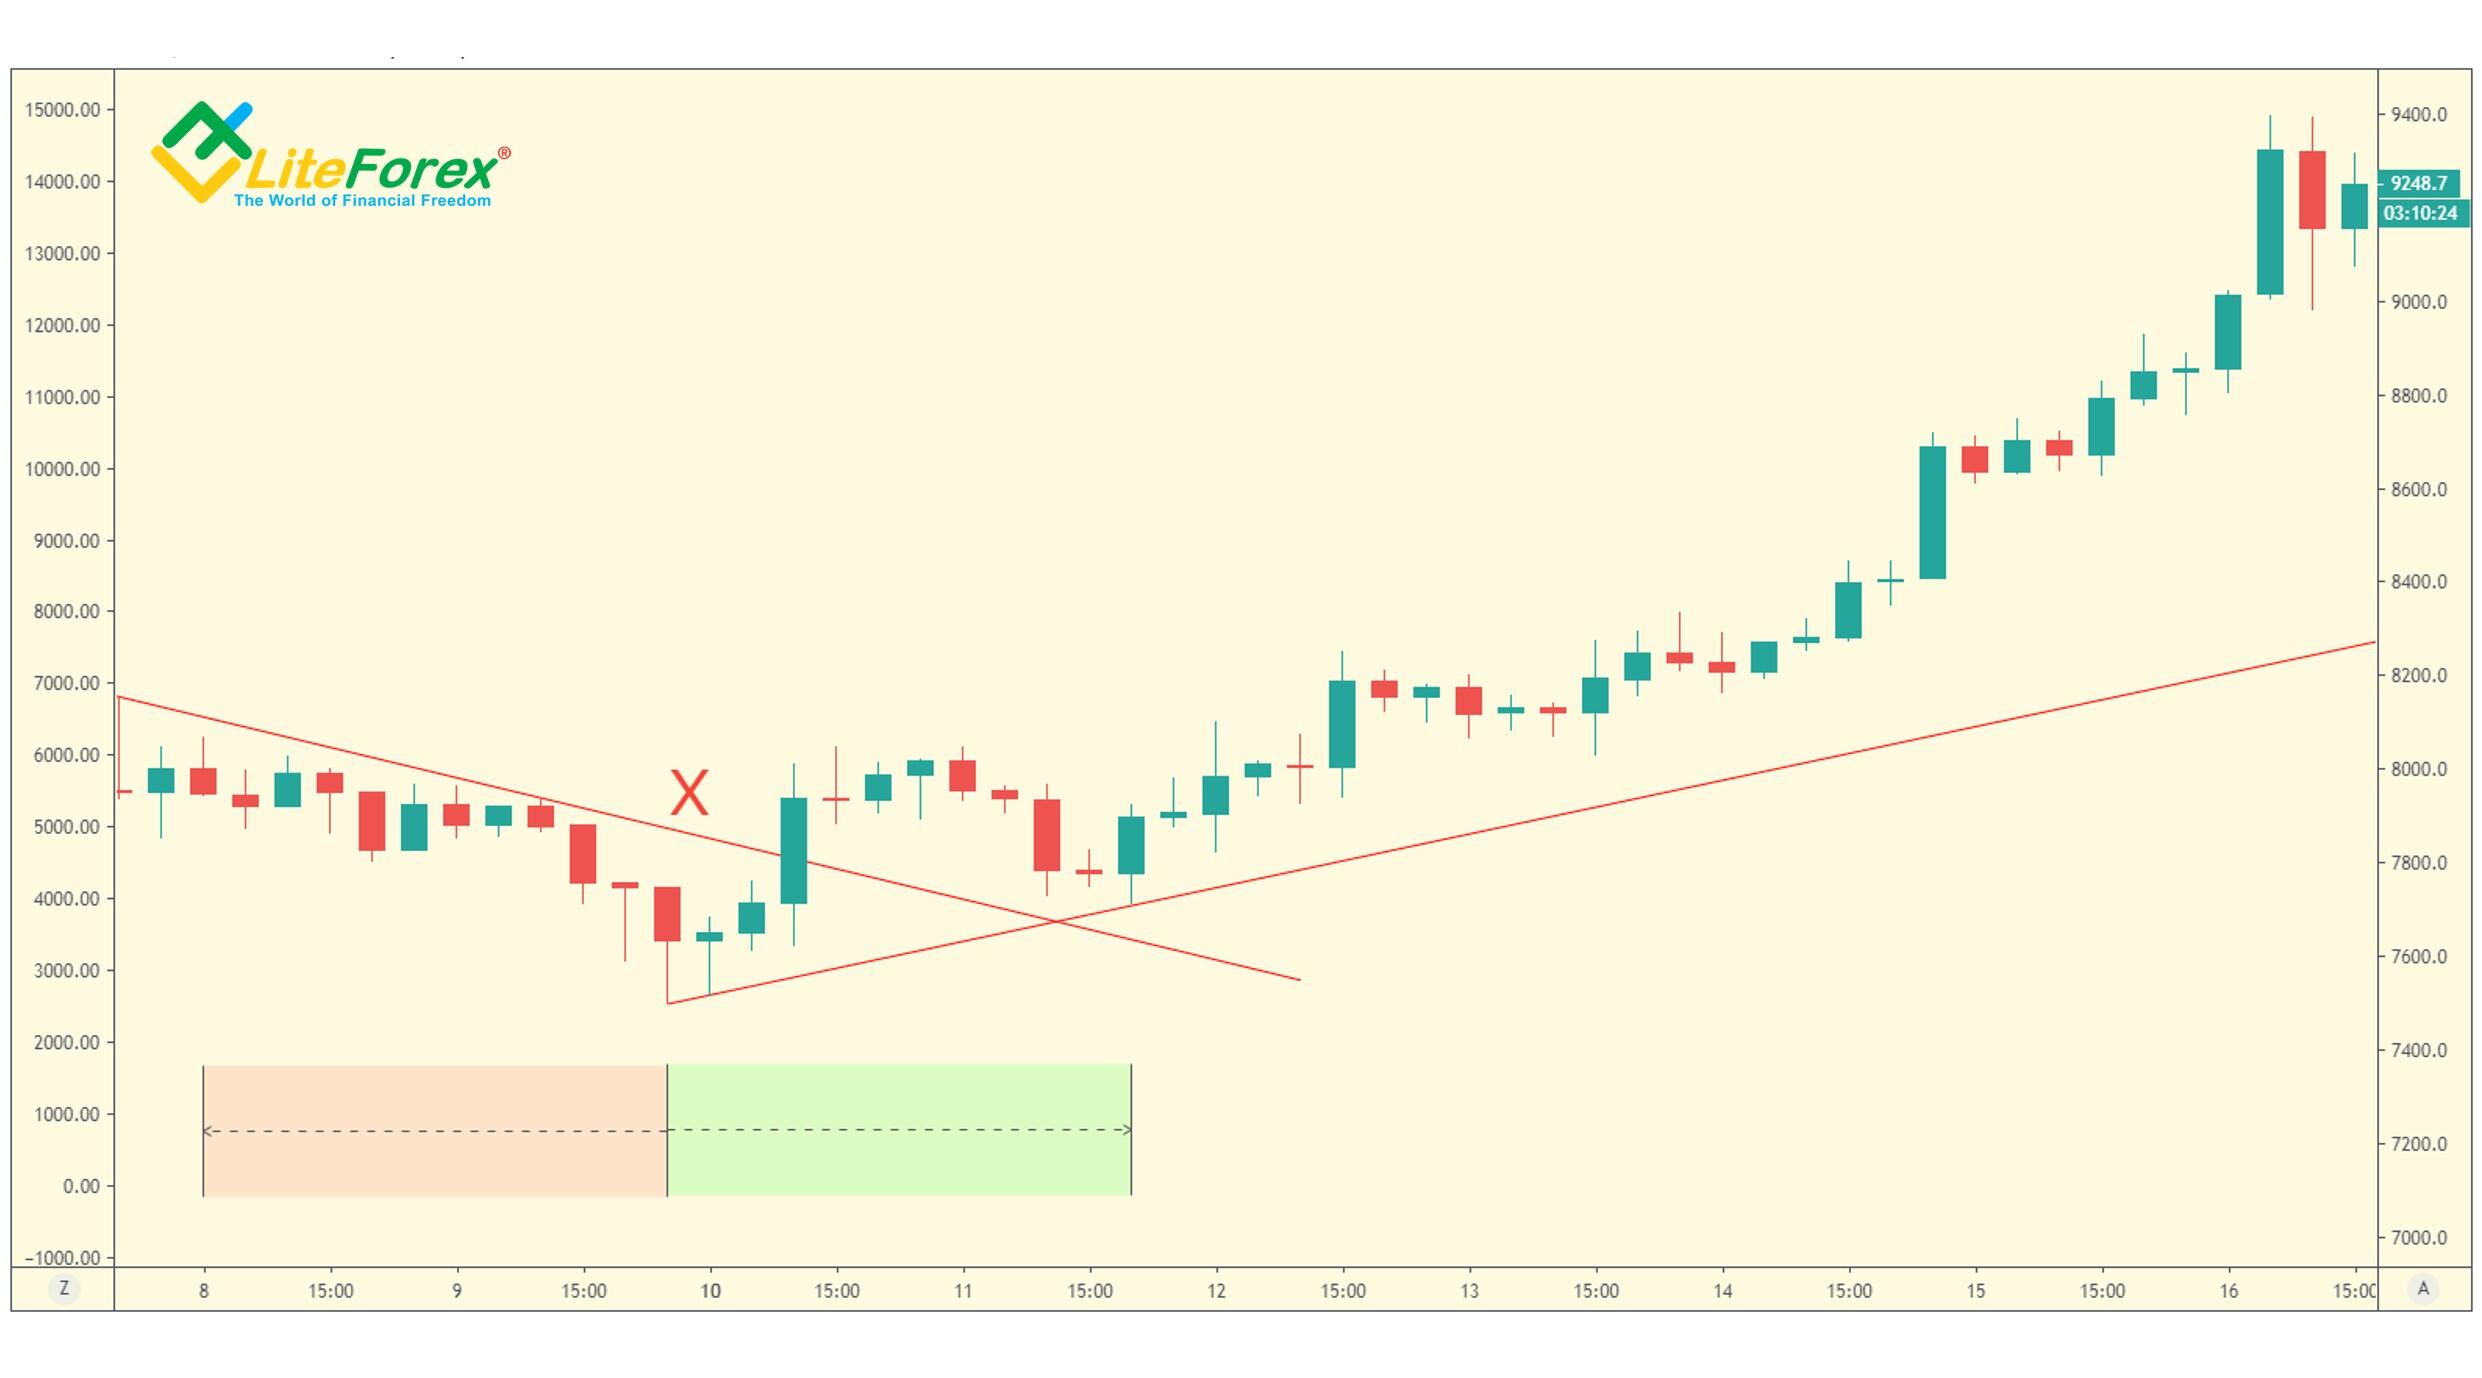
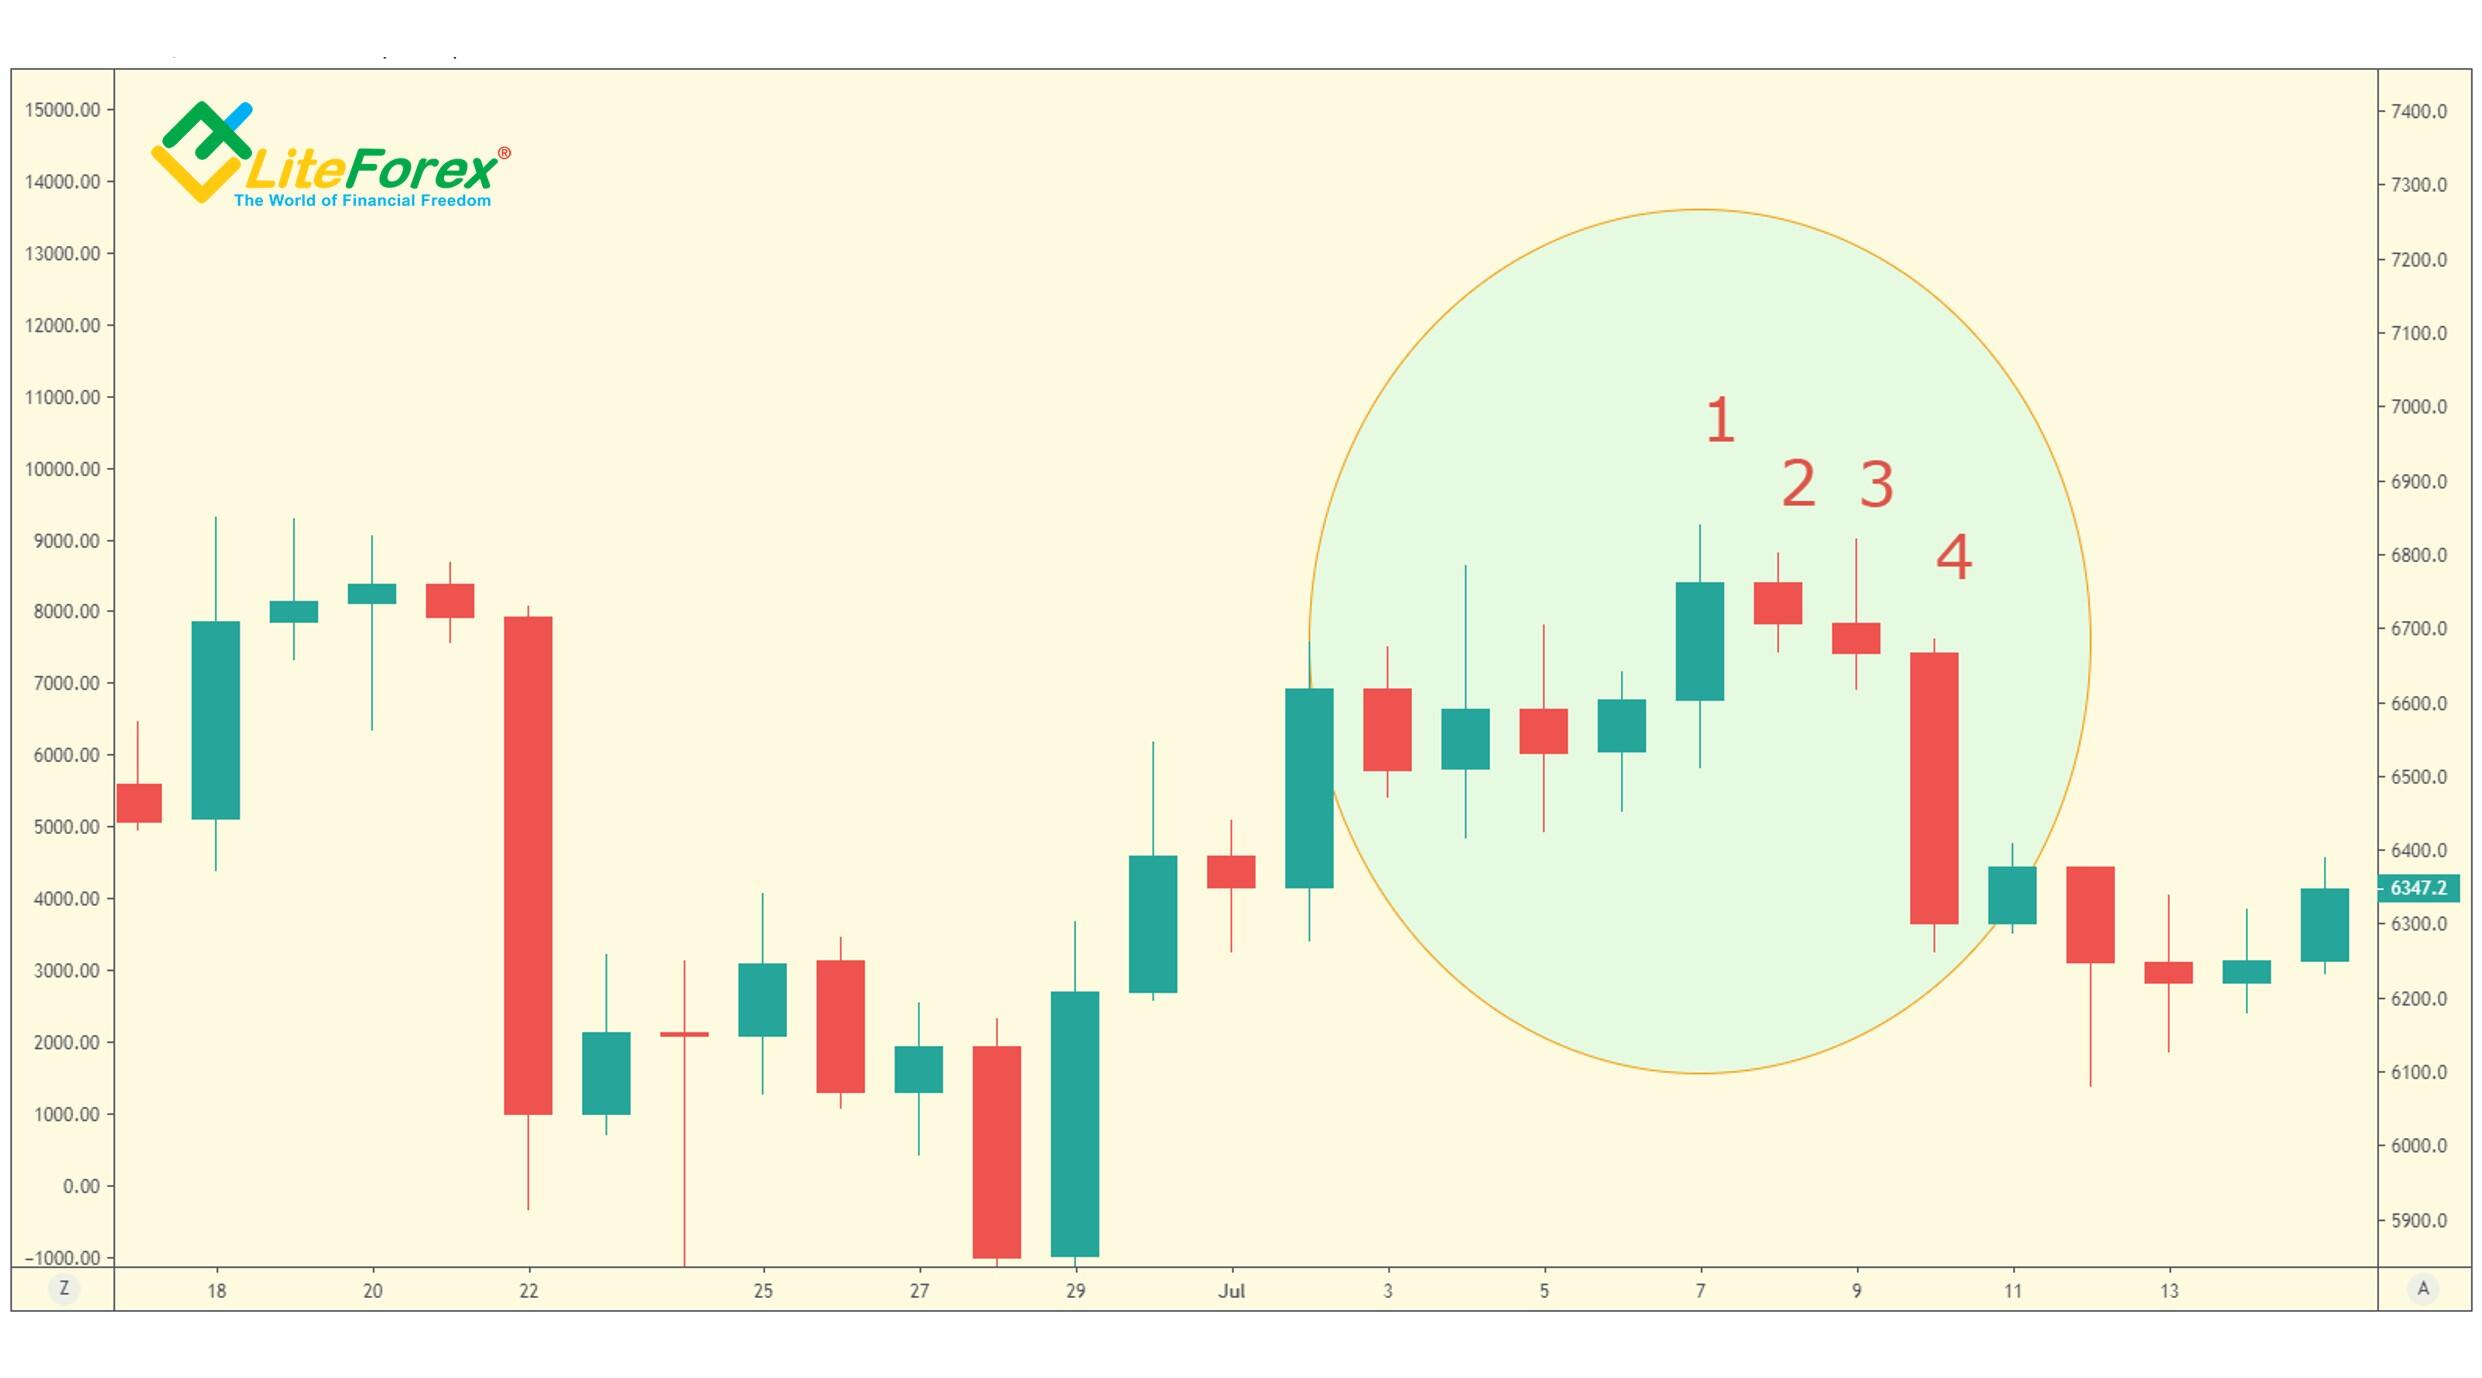
This pattern is most frequently discovered in short timeframes. So, I’ll use the four-hour timeframe for an example. I see a low that is marked by letter X in the chart. The next 10 bars, opposite green zone in the chart, a higher than the X bar. Similarly, the previous 10 bars opposite the red zone are higher than the X bar.
Now, look at the two bars following X. Their lows are lower than the X close. So, we can suggest there is the price bottom and the downtrend exhaustion. As you see, the forecast has been confirmed in the following days. To display the price movements, I drew the red trendlines.
TD Waldo Pattern Five
The price should continue rising if:
- The current bar’s close is roughly equal to the close of the previous price bar, and
- The close of the previous bar should be higher than the close of the bar before that.
Respectively, a bearish trend is likely to continue if:
- The current bar’s close is roughly equal to the close of the previous price bar, and
- The close of the previous bar should be lower than the close of the bar before that.
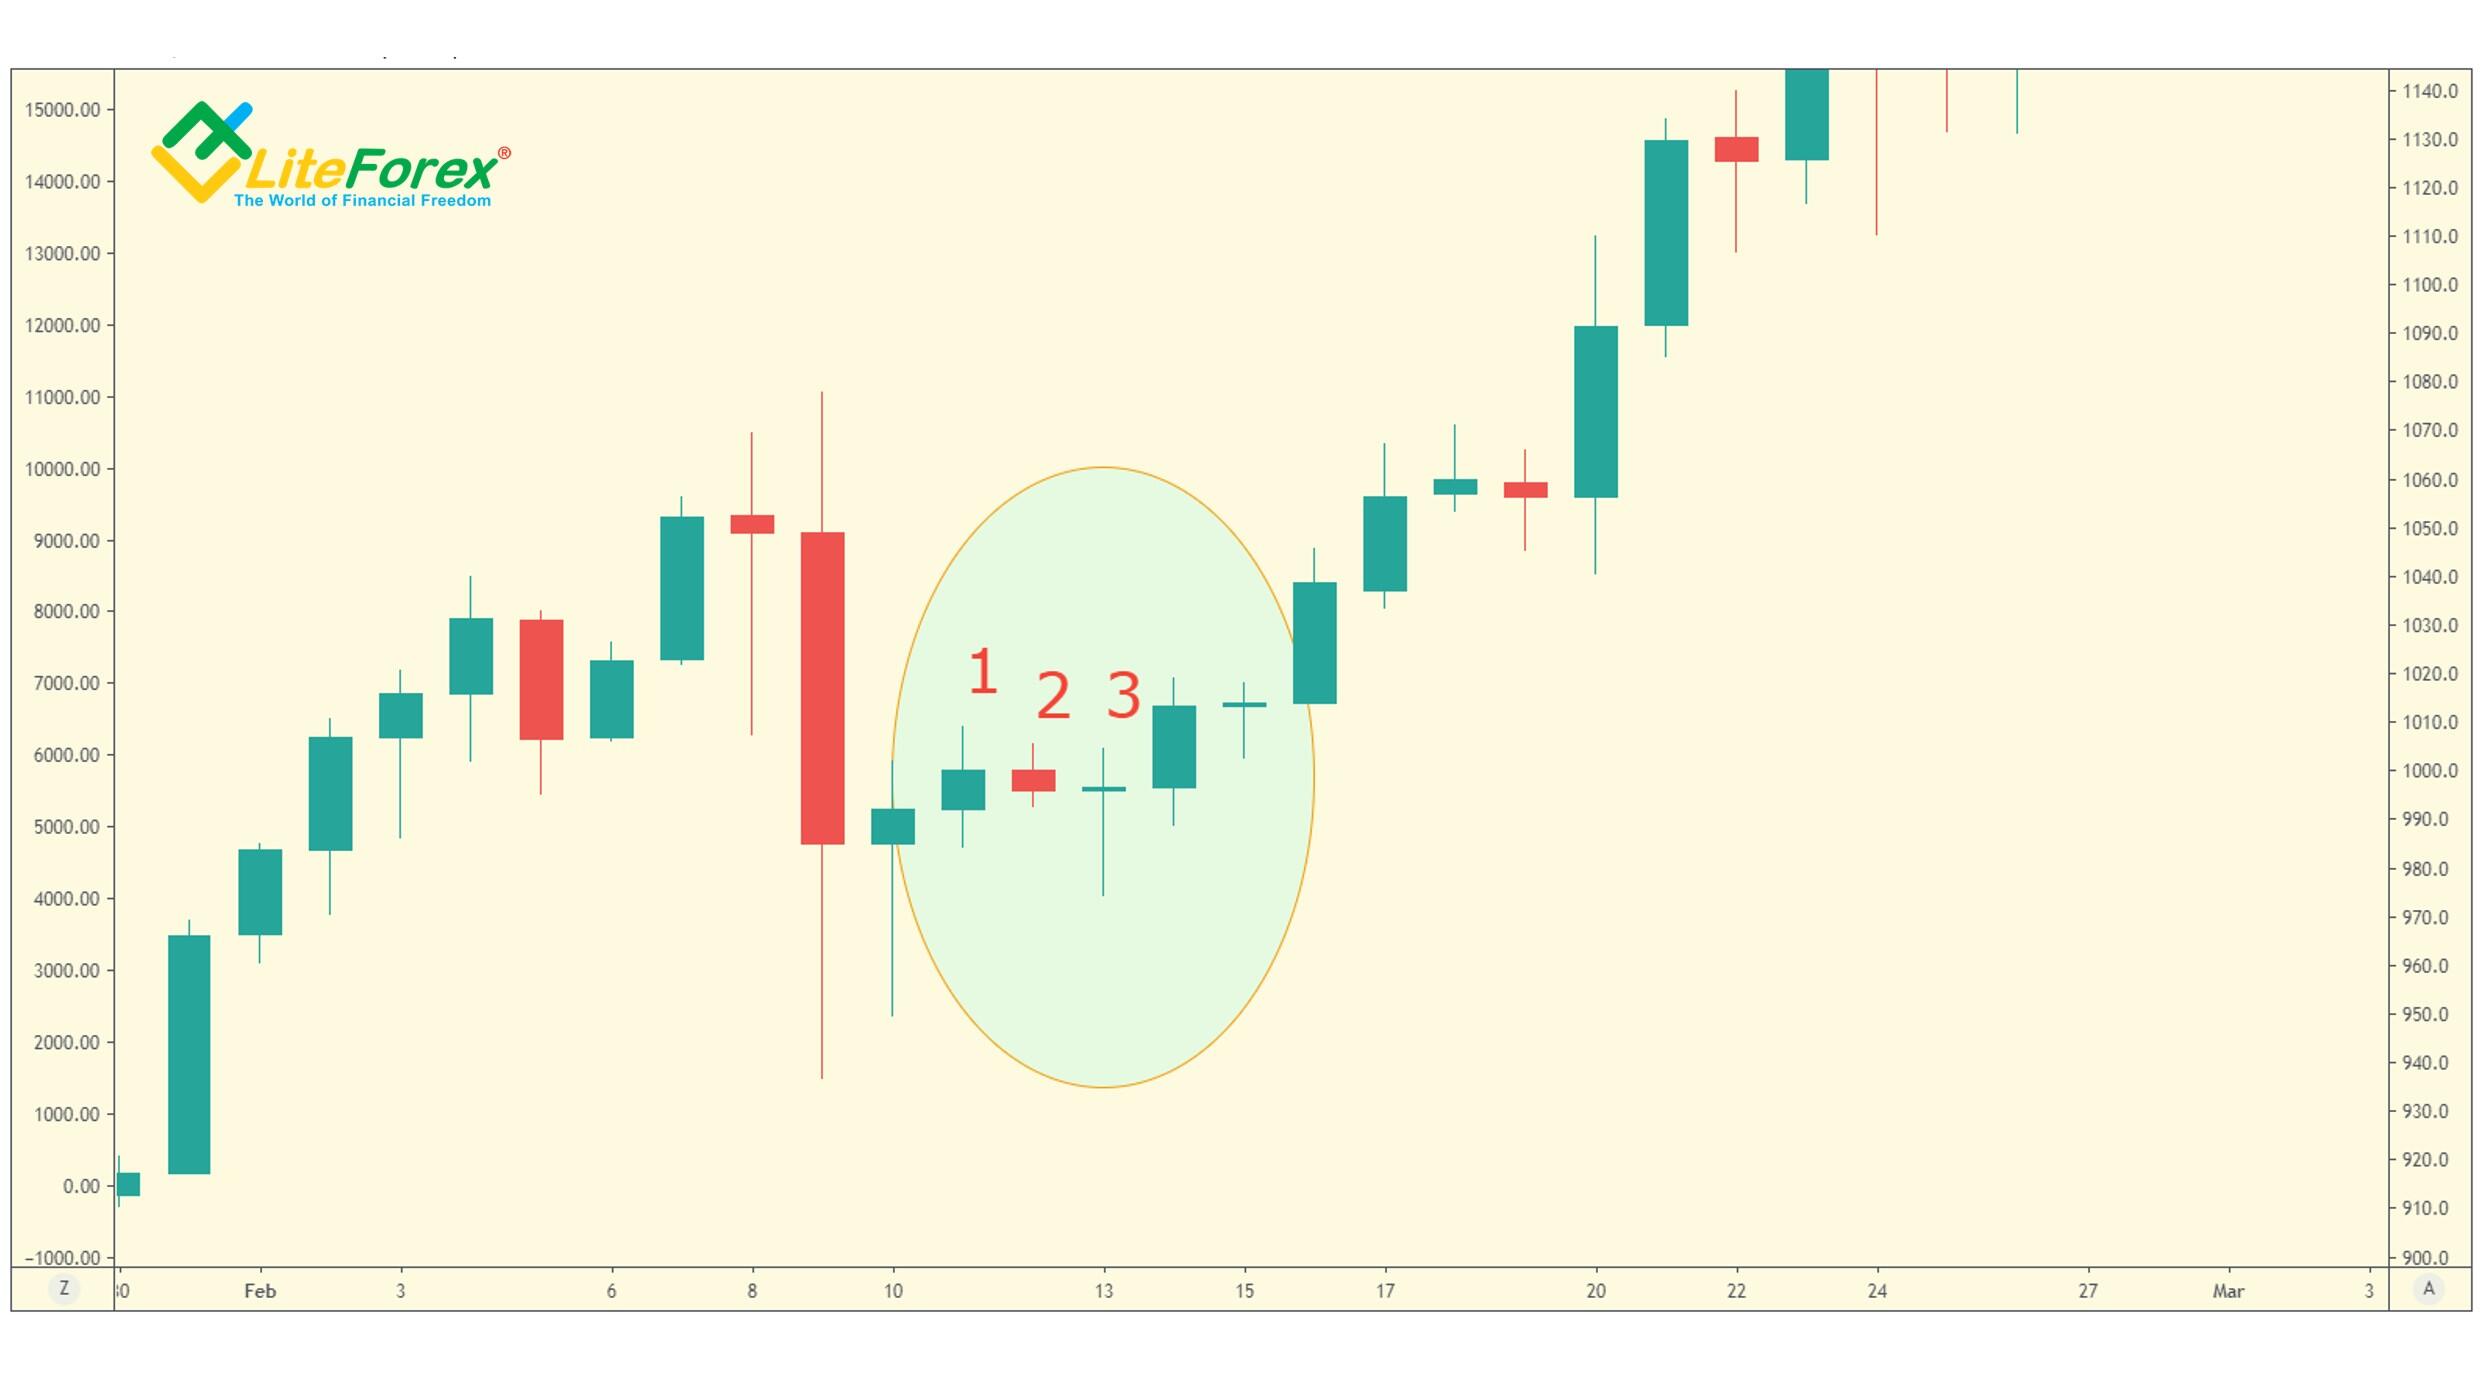
It is clear from the daily BTCUSD chart that bar number 3 closes at the same level as bar number 2. As bar 2 closes higher than bar 1, we can assume that the price should continue rising.
To demonstrate an opposite situation, I will use the four-hour BTCUSD chart. In the highlighted zone, bar number 3 closes at the same level as the previous bar, bar number 2. As bar 2 closes lower than bar 1, we can assume that the price should be declining in the near term. As you see, the situation has been completely in line with the forecast.
Based on my own experience, TD Waldo Pattern Five is rather rare, especially in long-term timeframes, with an interval of a week or even a month.
TD Waldo Pattern Six
If there is a short-term price peak in the chart, one can gauge the probability of the further trend by simple calculations. To register the peak, the high of the current bar should be higher than all eight prior highs. Next, we calculate the difference between the bar’s high and its close and compare it to the same parameter of the previous bar. If the first difference is greater, one may assume a soon price decline unless the new high is greater than the current bar.
In the same, we find out the short-term bottom. The current bar’s low should be lower than all the eight prior lows. If the difference between the close and the low of this bar is greater than the difference between the close and the low of the previous bar, then this bar qualifies as the start of a potential upside reversal.
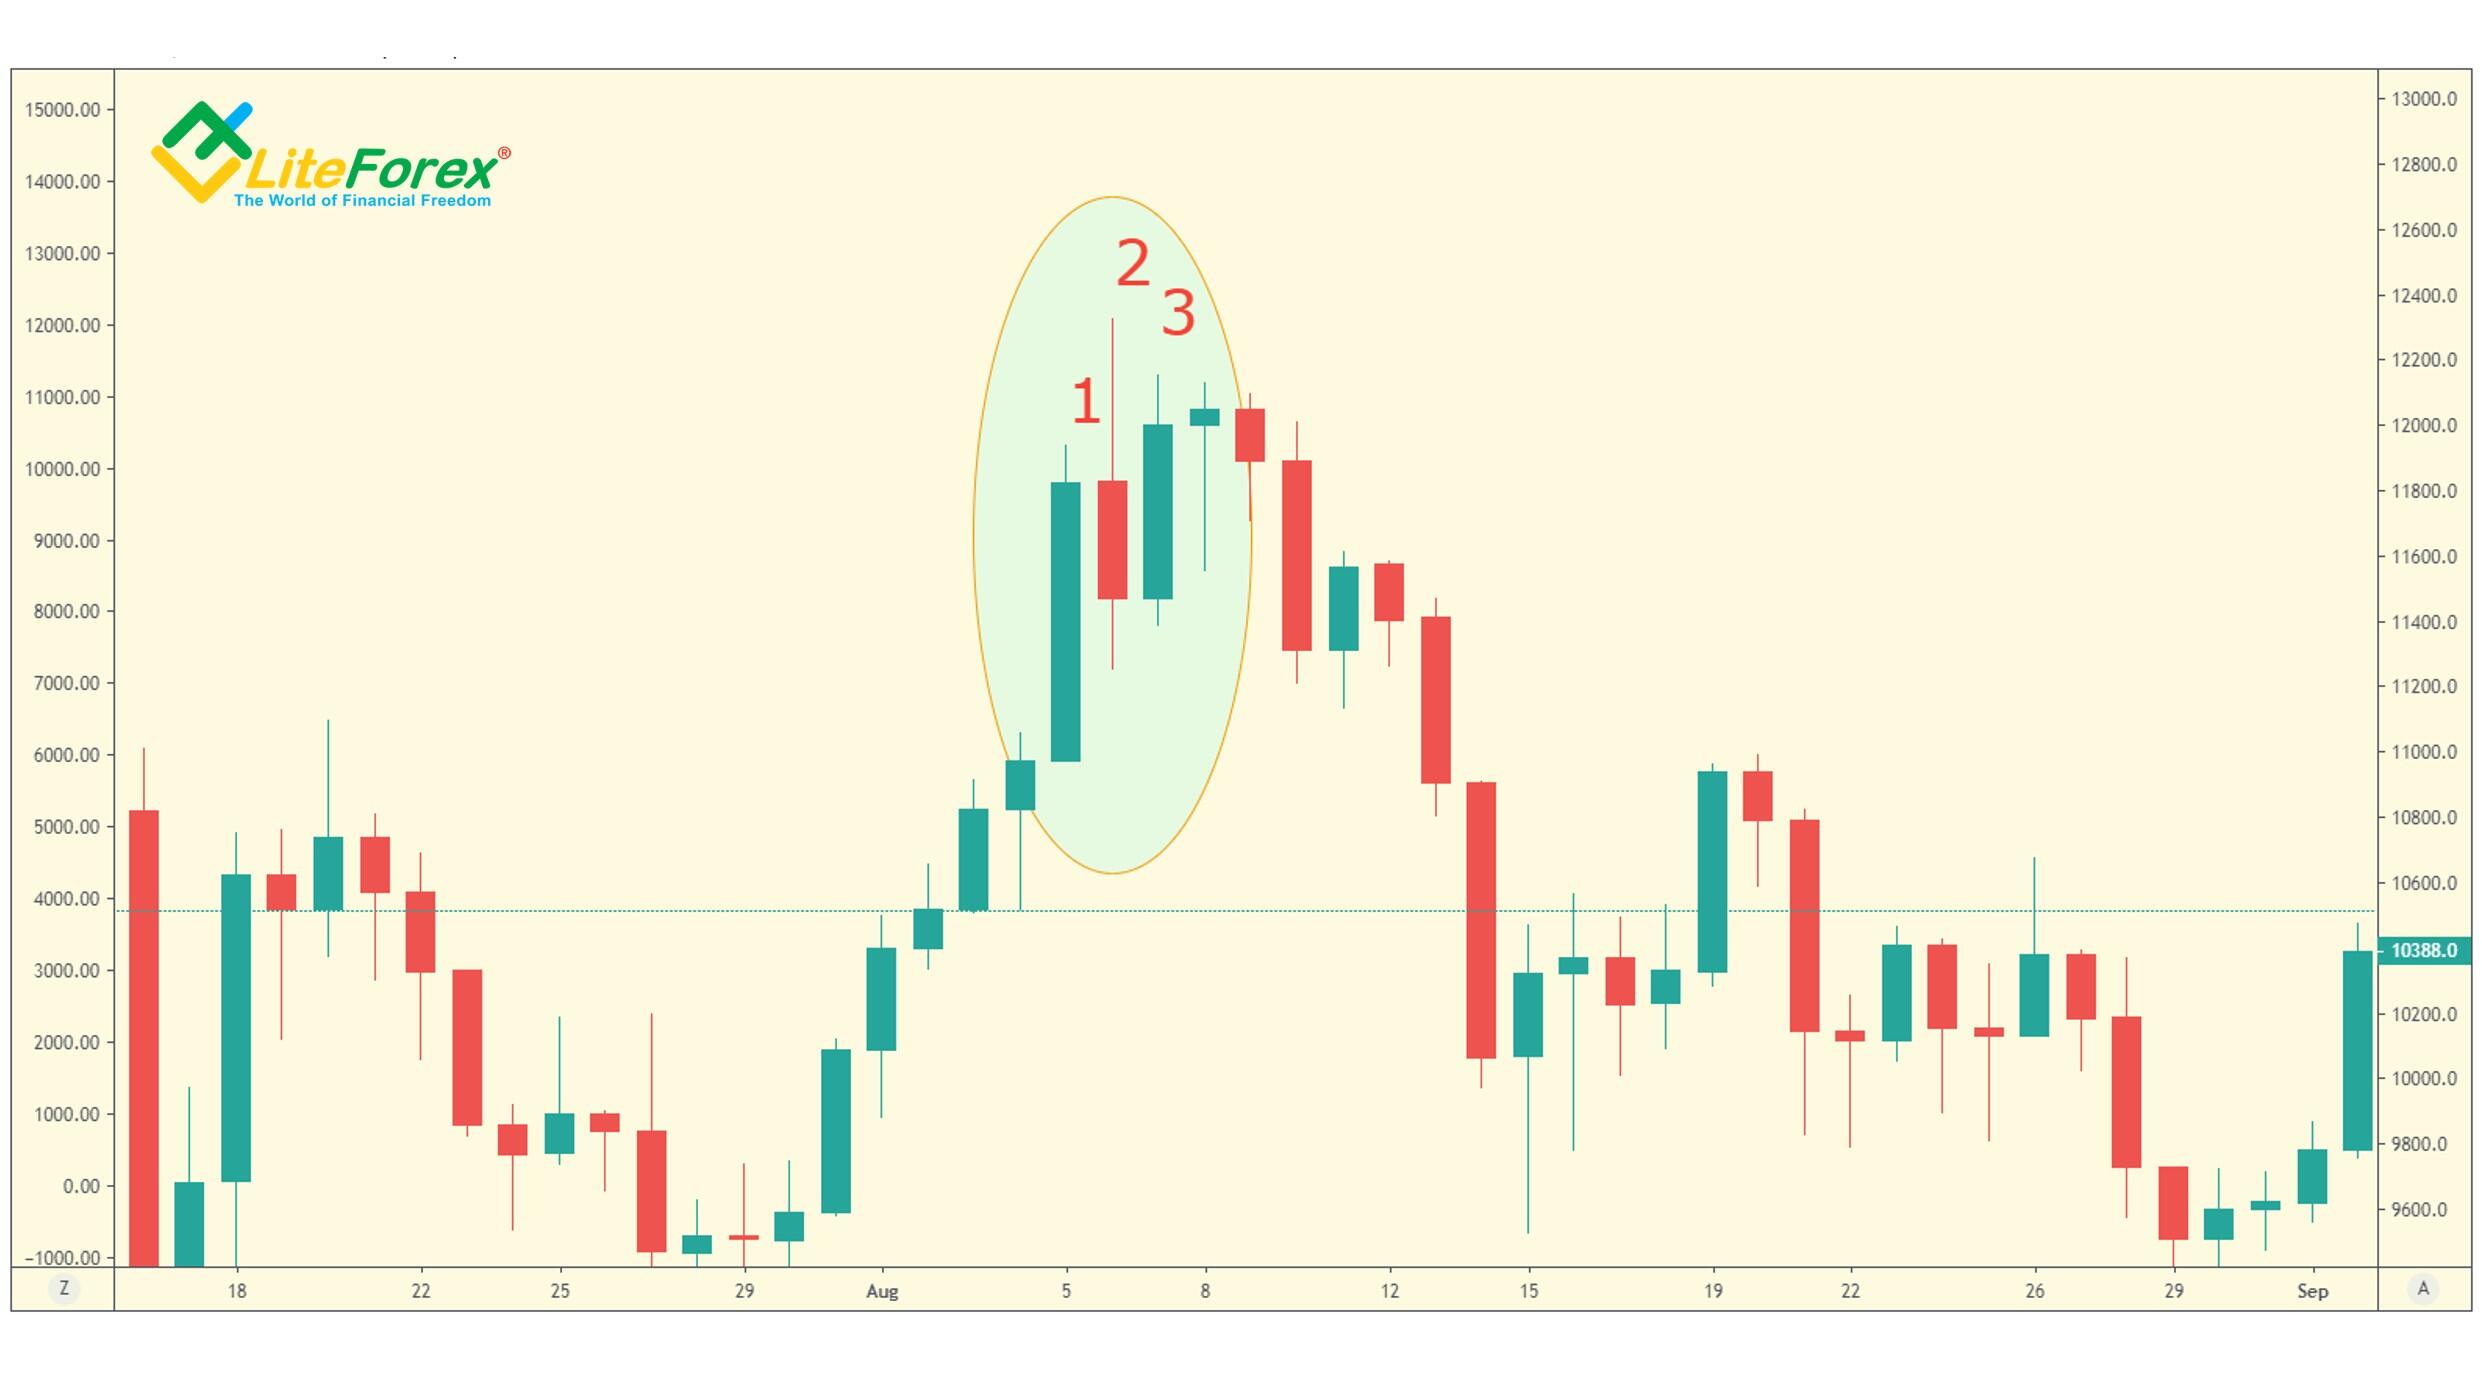
In the daily BTCUSD price chart, the high of bar 2 is greater than all eight prior highs, so there is a local top. Let us find out the difference between the high of bar 2 and its close:
12326 – 11470 = 856.
Now, we shall calculate the difference between the high of bar 1 and its close:
11938 – 11823 = 115.
As the first value is greater than the second one and the new high of bar 3 doesn’t exceed the high of bar 2, so, bar 2 can be qualified as a start of a potential downside reversal. In fact, there was a strong downtrend in the next few days, which is clear from the chart.
I should note that one rarely needs to calculate the difference between the high and the close of the bars manually. The difference is usually clear visually from the chart.
TD Waldo Pattern Seven
First, we need to record the local TD high (TD Point High) of the fourth level. The signal of the uptrend exhaustion is when there is a bar that closes lower than four bars prior to TD Point high. If the market closes above the close four bars prior to a TD Point low, we can suggest a potential upside reversal.
By the way, the signal is spotted at one of four bars after the TD Point high or low in both cases. If the signal emerges at the fifth bar after the Point high or low, it is not valid. In addition, if two price gaps are observed on two bars up to the bar inclusively with a closing level that does not correspond to the general trend, then the reversal will hardly occur.
Here, I should explain some terms introduced by Thomas DeMark. TD Point high is a high flanked by a lower high to its immediate left and to its immediate right. In the given example it is compared to four bars prior to the assumed high and a few bars up to the qualified point of the trend reversal. That is, this a high of the fourth level. Similarly, a TD Point low is the bar with the close lower than the close four bars prior to it and a few bars following it.
Price gaps are the price swings higher or lower than the previous close. In the chart, they look like visible gaps between bars next to each other. Price gaps usually emerge when, affected by the latest news, the asset price suddenly spikes or drops while there are no other contracts.
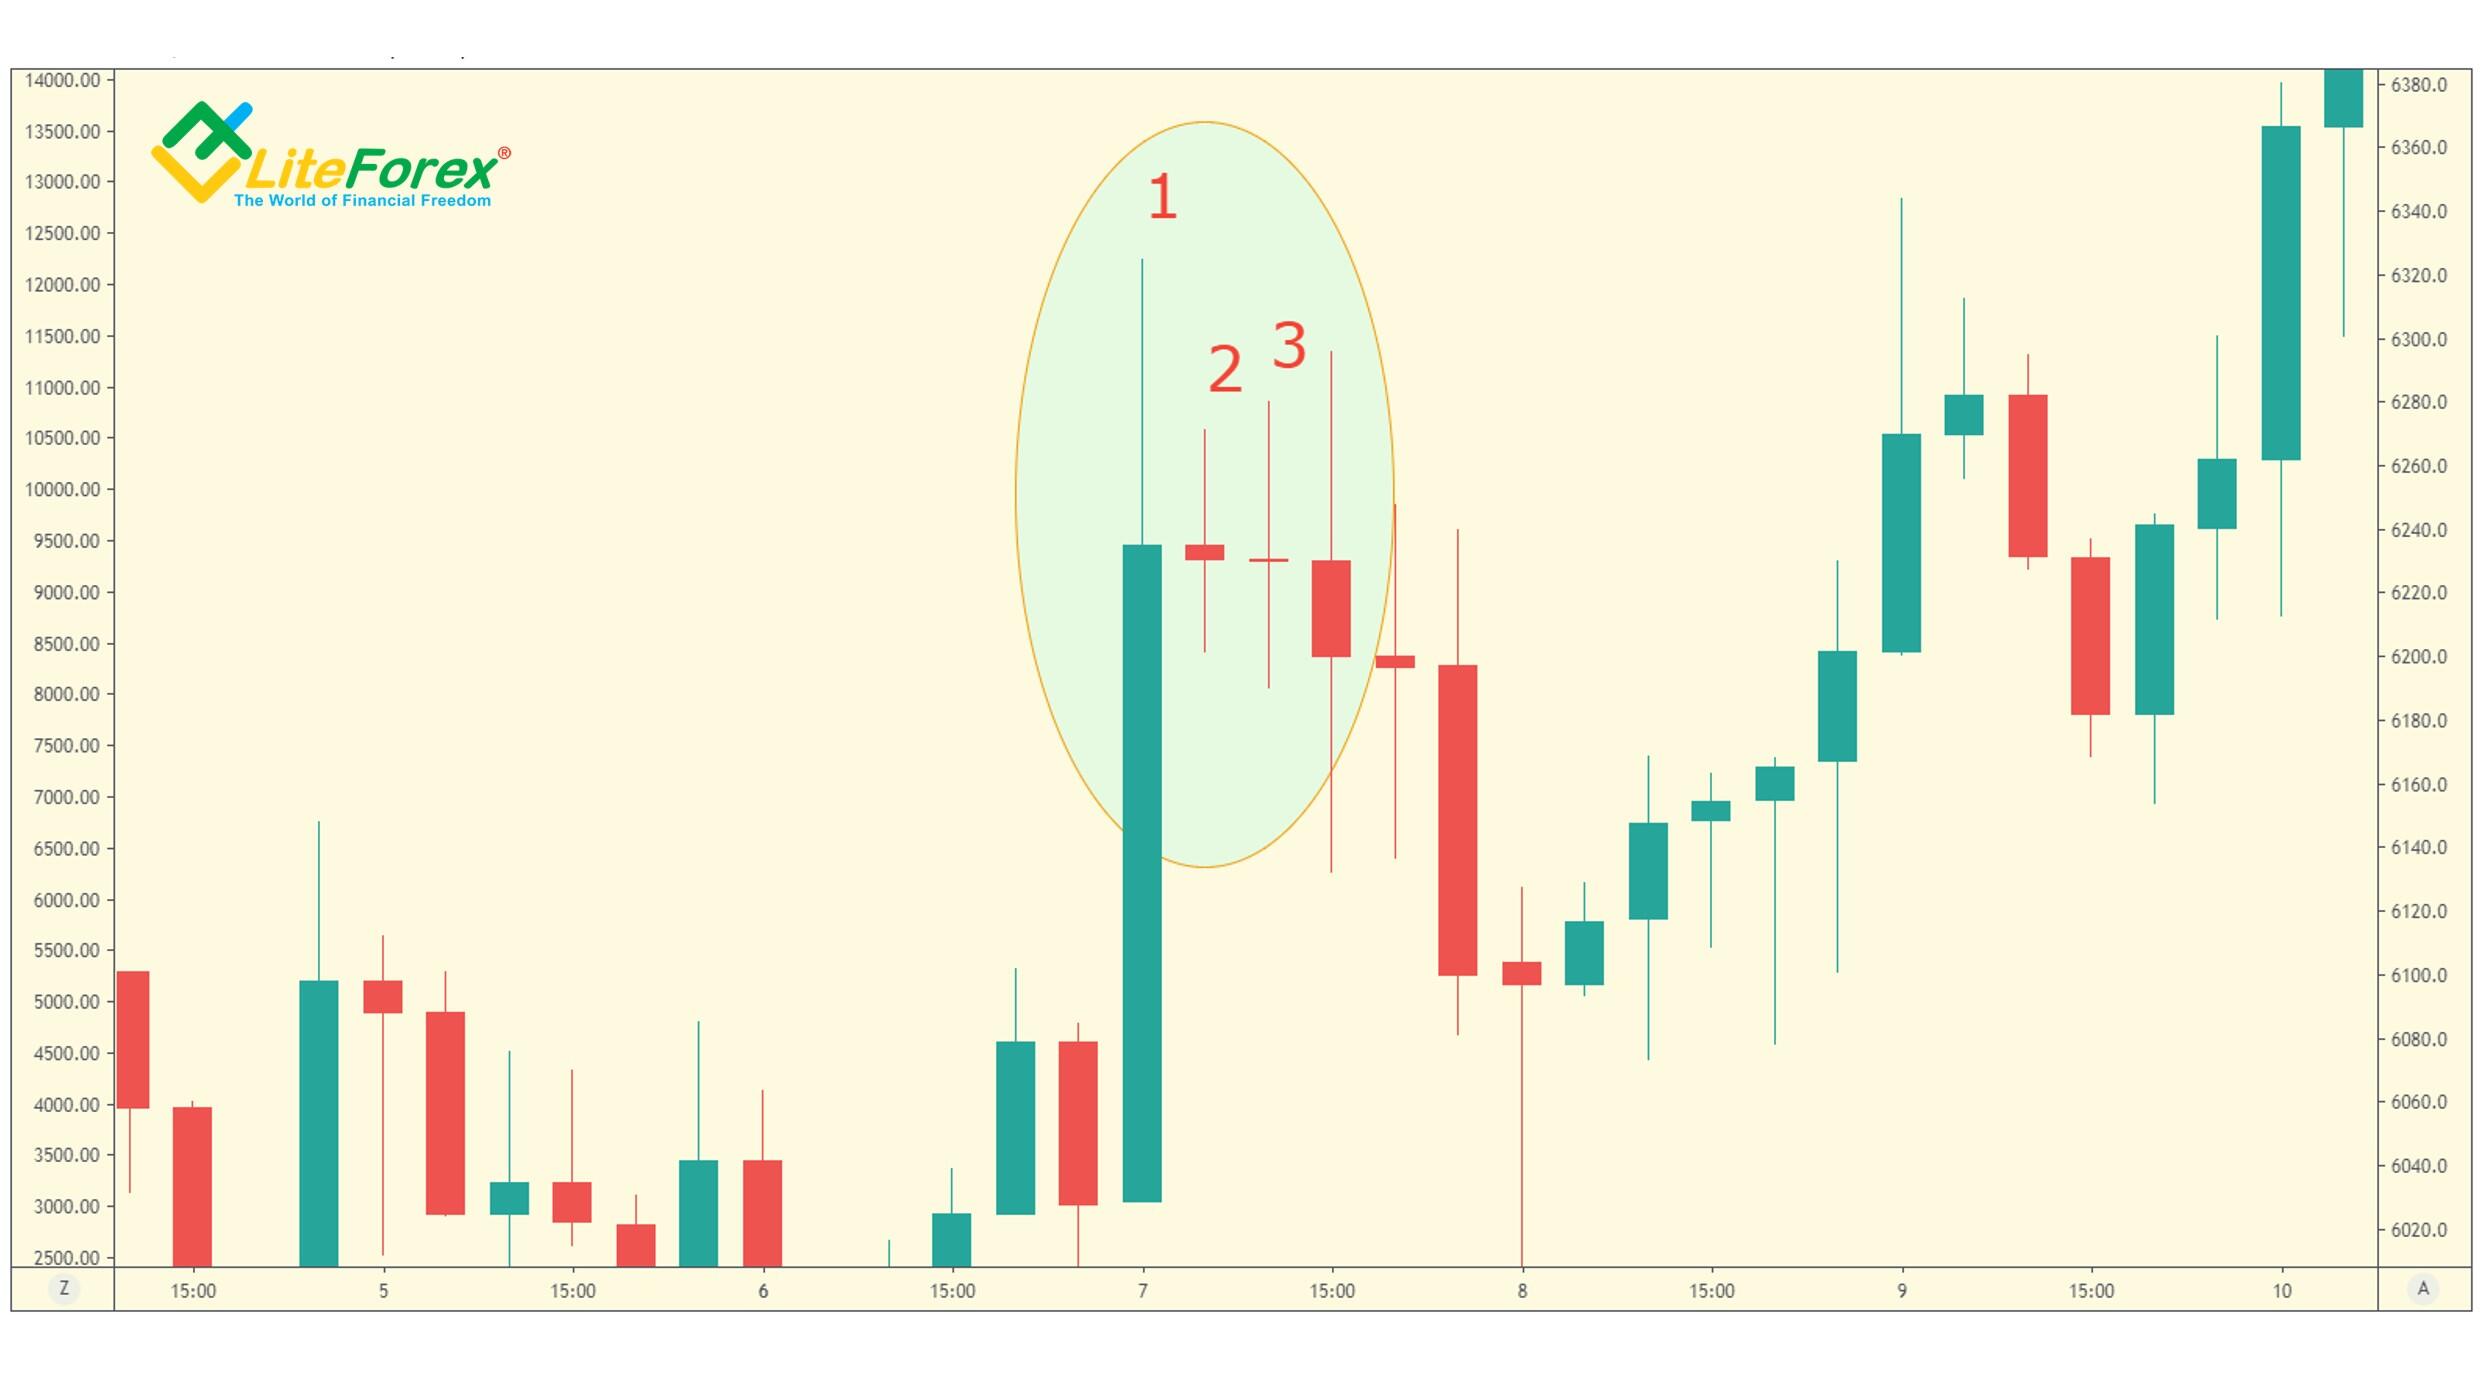
It is clear from the bitcoin daily chart above that there is local TD Point high of the fourth level that I marked by number 1. It has the highest close compared to the close of four prior bars and three subsequent bars (numbers 2-4), which will be analyzed in the following forecast. The close of bar 4 is much lower than the closes of four bars prior to TD Point high. In addition, there are no price gaps between bars 2-4. Therefore, we can assume a potential short-term downside reversal.
TD Waldo Pattern Eight
If the close of the most recent bar is higher than all seven prior bars but lower than the high of any of the 11 previous bars, and the close of the previous bar is lower than the close of five bars earlier, we can assume a potential short-term top that is a signal of soon short-term trend reversal downwards.
Correspondingly, if the most recent bar closes lower than all seven prior lows but its close is higher than then the low of any of the 11 previous bars; and the previous bar’s close is higher than the close five bars earlier, we can qualify a short-term bottom.
In the above H4 chart, the close of the bar marked with a red arrow is higher than all seven prior highs. I marked the zone, opposite to seven prior bars, with green to make it clearer. In addition, the close of the analyzed bar is lower than the highs of bars from 9 to 11 that are opposite to the red zone.
We register the close of the previous bar, marked with the blue arrow and compare is to the close of five prior bars, the earliest bar is marked by a green arrow. As this bar is lower, the price should be declining in the near term.
This all about DeMark’s indicators so far. I want to stress once again that Thomas DeMark, the developer of the analytical tools I have been dealing with, recommends employing several tools together for the market analysis. The more TD indicators you apply, the more accurate will be you forecasts, and so, you will have more winning trades.
I explained other DeMark's analytical tools and their practical application to cryptocurrency trading in my previous articles. In my next posts, I will explain how you can employ several indicators in the BTCUSD trading.
Subscribe not to miss anything new!
I wish you good luck and good profits!
PS. If you agree with my ideas, write “+” in the comments; if you don’t agree, put “-”. If you liked the post, just write thank you, and don’t forget to share the post. It is easy for you and I will be very pleased :)
Stay informed on the latest cryptocurrency news, follow my posts on the blog.
Useful links:
I recommend trying to trade with a reliable broker here. The system allows you to trade by yourself or copy successful traders from all across the globe.
Telegram channel with high-quality analytics, Forex reviews, training articles, and other useful things for traders http://t.me/litefinance.

Price chart of BTCUSD in real time mode
The content of this article reflects the author’s opinion and does not necessarily reflect the official position of LiteFinance broker. The material published on this page is provided for informational purposes only and should not be considered as the provision of investment advice for the purposes of Directive 2014/65/EU.
According to copyright law, this article is considered intellectual property, which includes a prohibition on copying and distributing it without consent.