Examining TD Lines: a revolutionary indicator for trend trading by DeMark.
Dear friends,
We go on getting acquainted with the methods of technical analysis developed and introduced by famous trader Tom DeMark. Today, our attention will be drawn to the rules of drawing TD points and TD trend lines. Also, we’ll learn to identify moments for opening profit-making trades and to calculate trade closure points.
A trend line is one of the simplest and widely used tools of technical analysis. But this tool is really subjective. If you gather a few traders in a room and ask them to draw trend lines, you may be sure about 2 things:
1) every trader will draw something unique
and
2) trendlines will be most often drawn on the basis of a trader’s subjective speculations, not on a real market situation.
TD lines indicator by Tom DeMark. Construction principles and conditions of use of TD demand line
Tom DeMark’s approach to drawing trend lines is absolutely objective and can fully exclude speculations from the decision-making process. Just like with many other TD indicators, the theory of TD lines may be applied to any market on any time frame. So, this method is relevant to both intraday and long-term trading.
The key to drawing objective trend lines is a choice of correct points. DeMark says, an important moment in trend line drawing is to define reference points, i.e. levels which coincide with trend reversals.
The lower point’s value is surrounded by higher minimums from both sides while the upper point is surrounded by lower maximums. DeMark calls these points “TD points” and the lines which connect them - “TD Lines”. Their values are ranged according to the number of surrounding maximums and minimums. For example, a maximum point surrounded by 5 lower maximums from both sides is called “Level Five TD Supply Point” while a minimum point surrounded by 3 higher minimums from both sides is Level Three TD Demand Point. For drawing TD lines, you can choose any level TD point, but personally, I prefer Level 1 TD points as they are more sensitive to price changes than higher level TD points. As a result, they provide earlier signals of a trend breakout. However, we should follow TD Lines on different time frames and/or TD Lines of different levels because breakouts are more likely to happen when a few indicators point at them.
It’s worth noting that the author’s initials - TD (Tom DeMark) - should be mentioned when we are talking about DeMark’s analysis. Just because Tom DeMark’s patented all his inventions and demands that his name be mentioned each time his method of technical analysis is discussed.
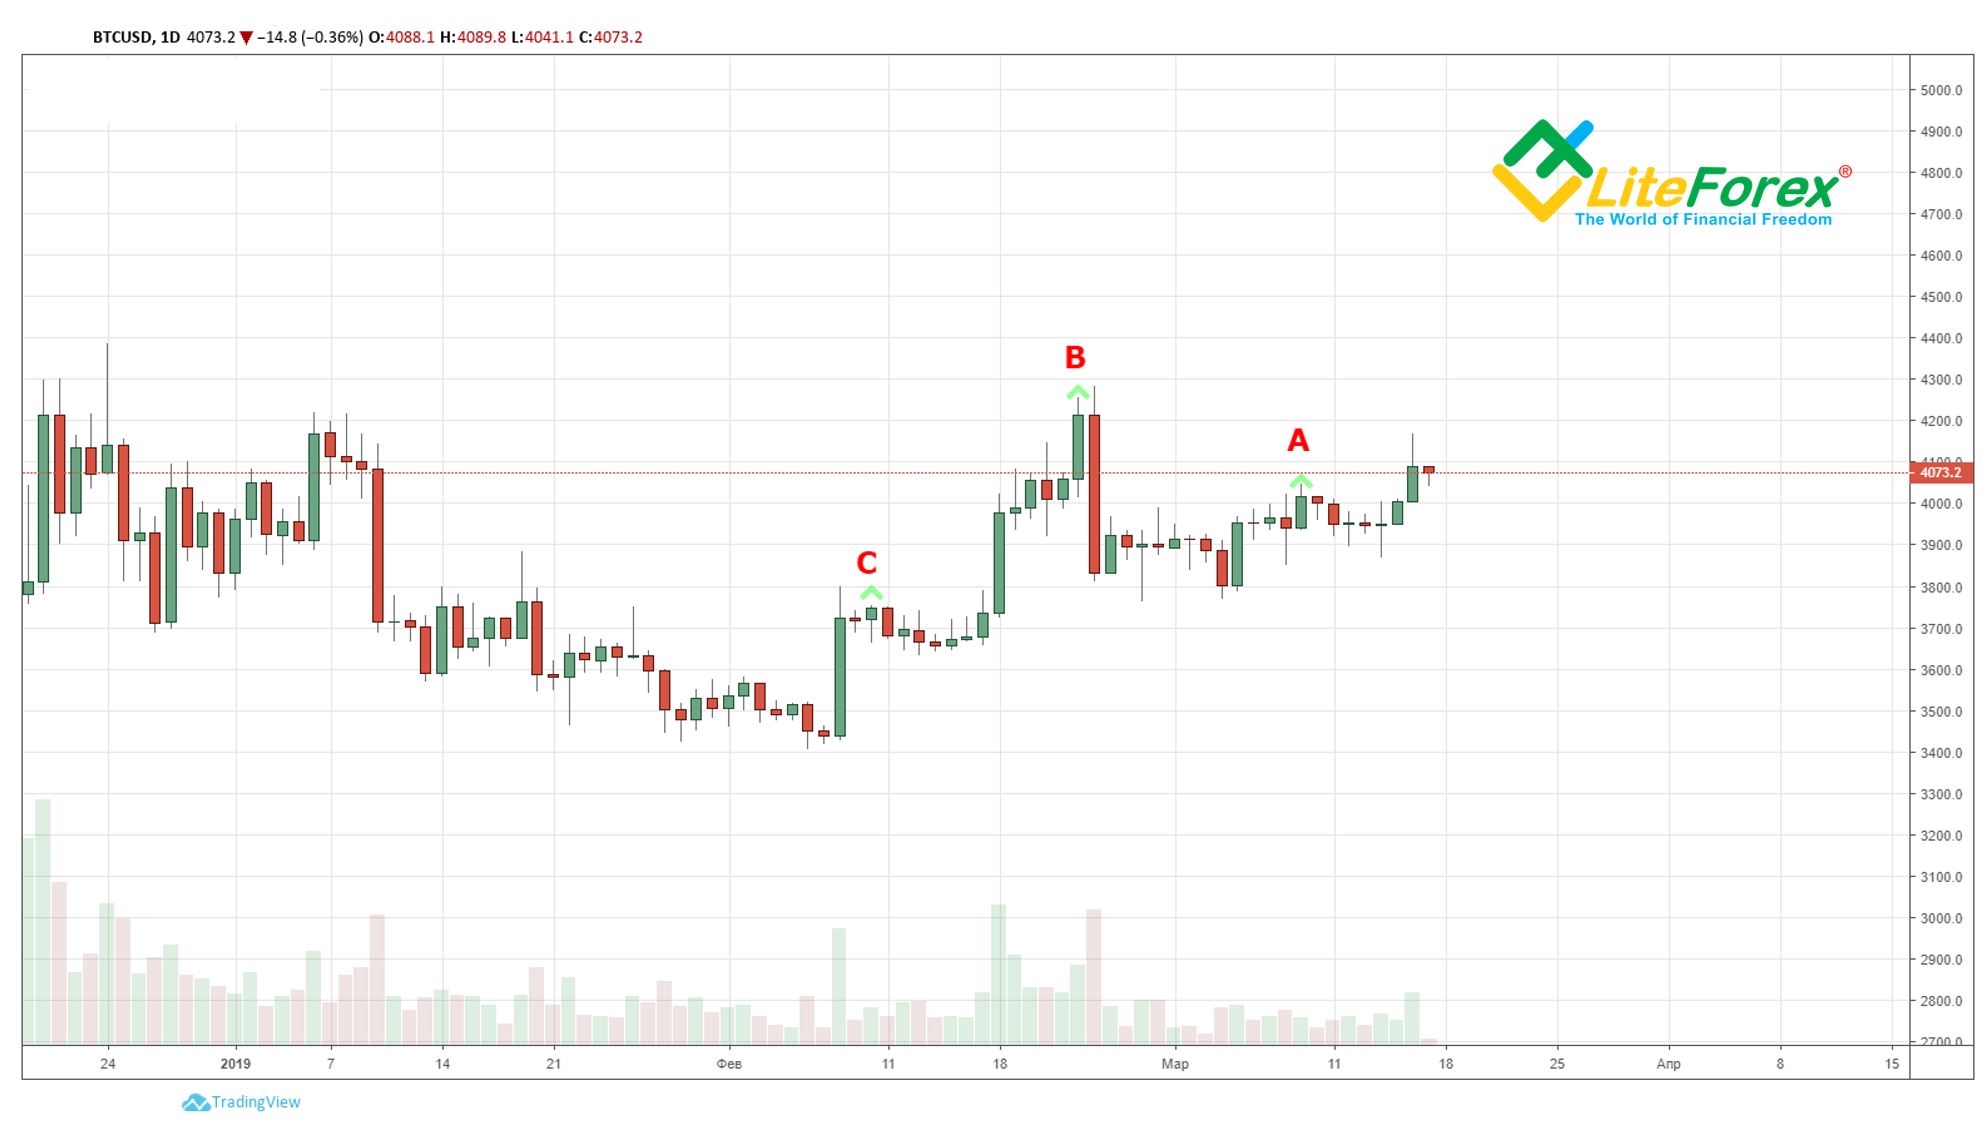
In the picture above, we see day candles marked with the letters A, B, and C. Each of these bars has the highest closing value among neighbouring candles. Thus, point A has 6 bars from both sides whose closing prices are lower. That’s why point A will be called Level 6 TD supply point. Then, point B is Level 12 TD supply point, and point C - Level 7 TD supply point. When identifying TD supply points, remember that these are closing prices that we need to consider.
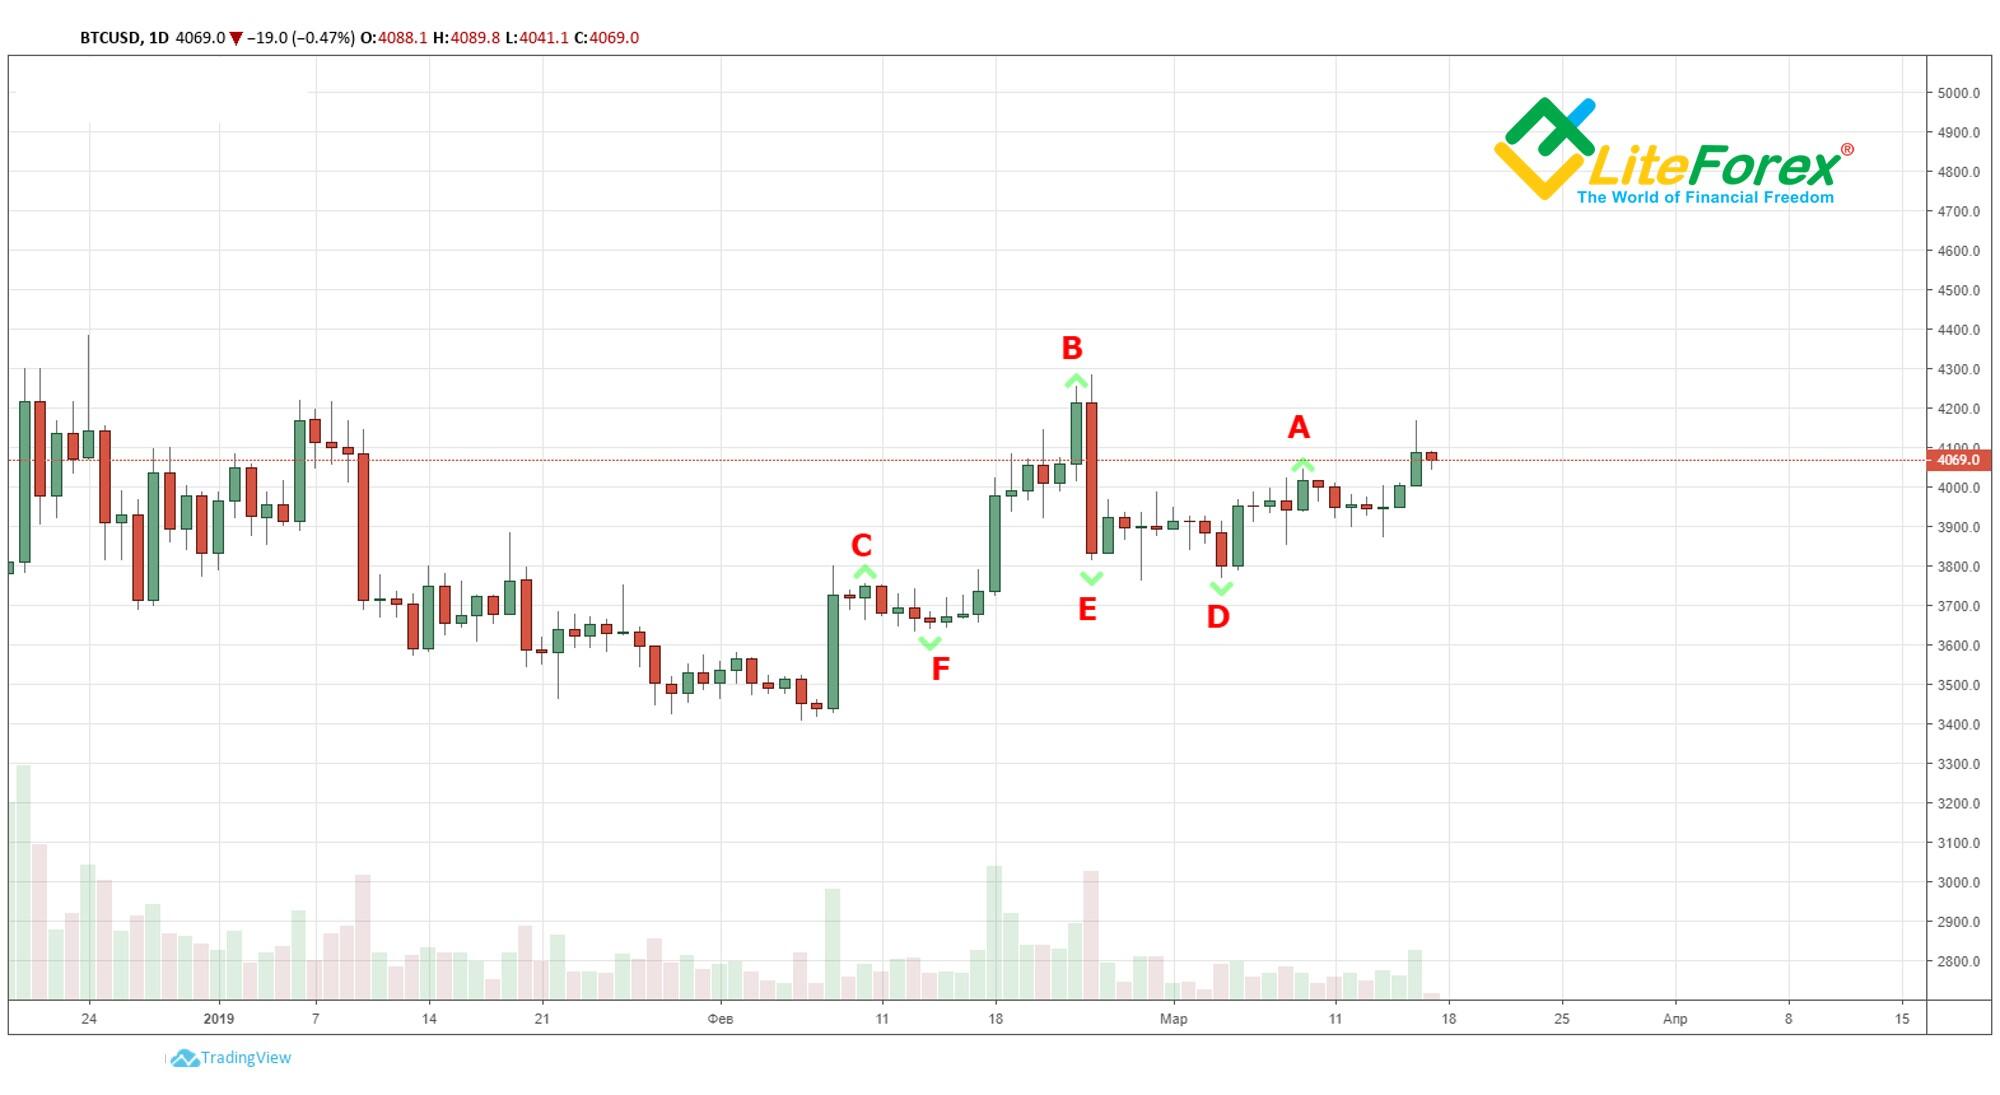
Let’s mark TD demand points with the letters D, E, and F. As you see, each of these points has the lowest closing price in the closest area. In this case, point D will be called Level 12 TD demand point. We see in the chart above that starting from February 18, 14 candles’ closing levels are lower than the D bar’s. But since the last closed daily candle on the right side is twelfth, we have to assign Level 12 to this TD point. As soon as the current daily candle closes and confirms its closing level above bar D, we can safely consider this candle to be Level 13 candle. If the same happens the next day, we will consider it as Level 14. Then this TD point will stop growing as there won’t be a 15th candle whose closing level will be above point D on the left side. Following the same calculation principle, you can easily find out by yourself that point E is Level 7 TD demand point and point F - Level 6 TD demand point.
However, TD points as such cannot prompt any useful information. They are mere extremums that we will use for drawing trend lines that Tom DeMark called “TD lines”.
For drawing TD lines, just like for drawing a traditional trend, only two points are required, but TD lines don’t require any confirmation and can be safely used in trading. Besides, to recognize the fact that the markets are a dynamic structure and the latest price change might be more important than past price fluctuations, TD lines shall be drawn using the 2 last TD points from right to left and not from left to right.
To define a support level and draw a TD support (demand) line , 2 last TD demand (support) points of the same levels should be connected (from right to left). To define a resistance level and draw a TD resistance (supply) line, connect 2 last TD supply (resistance) points of the same level from right to left.
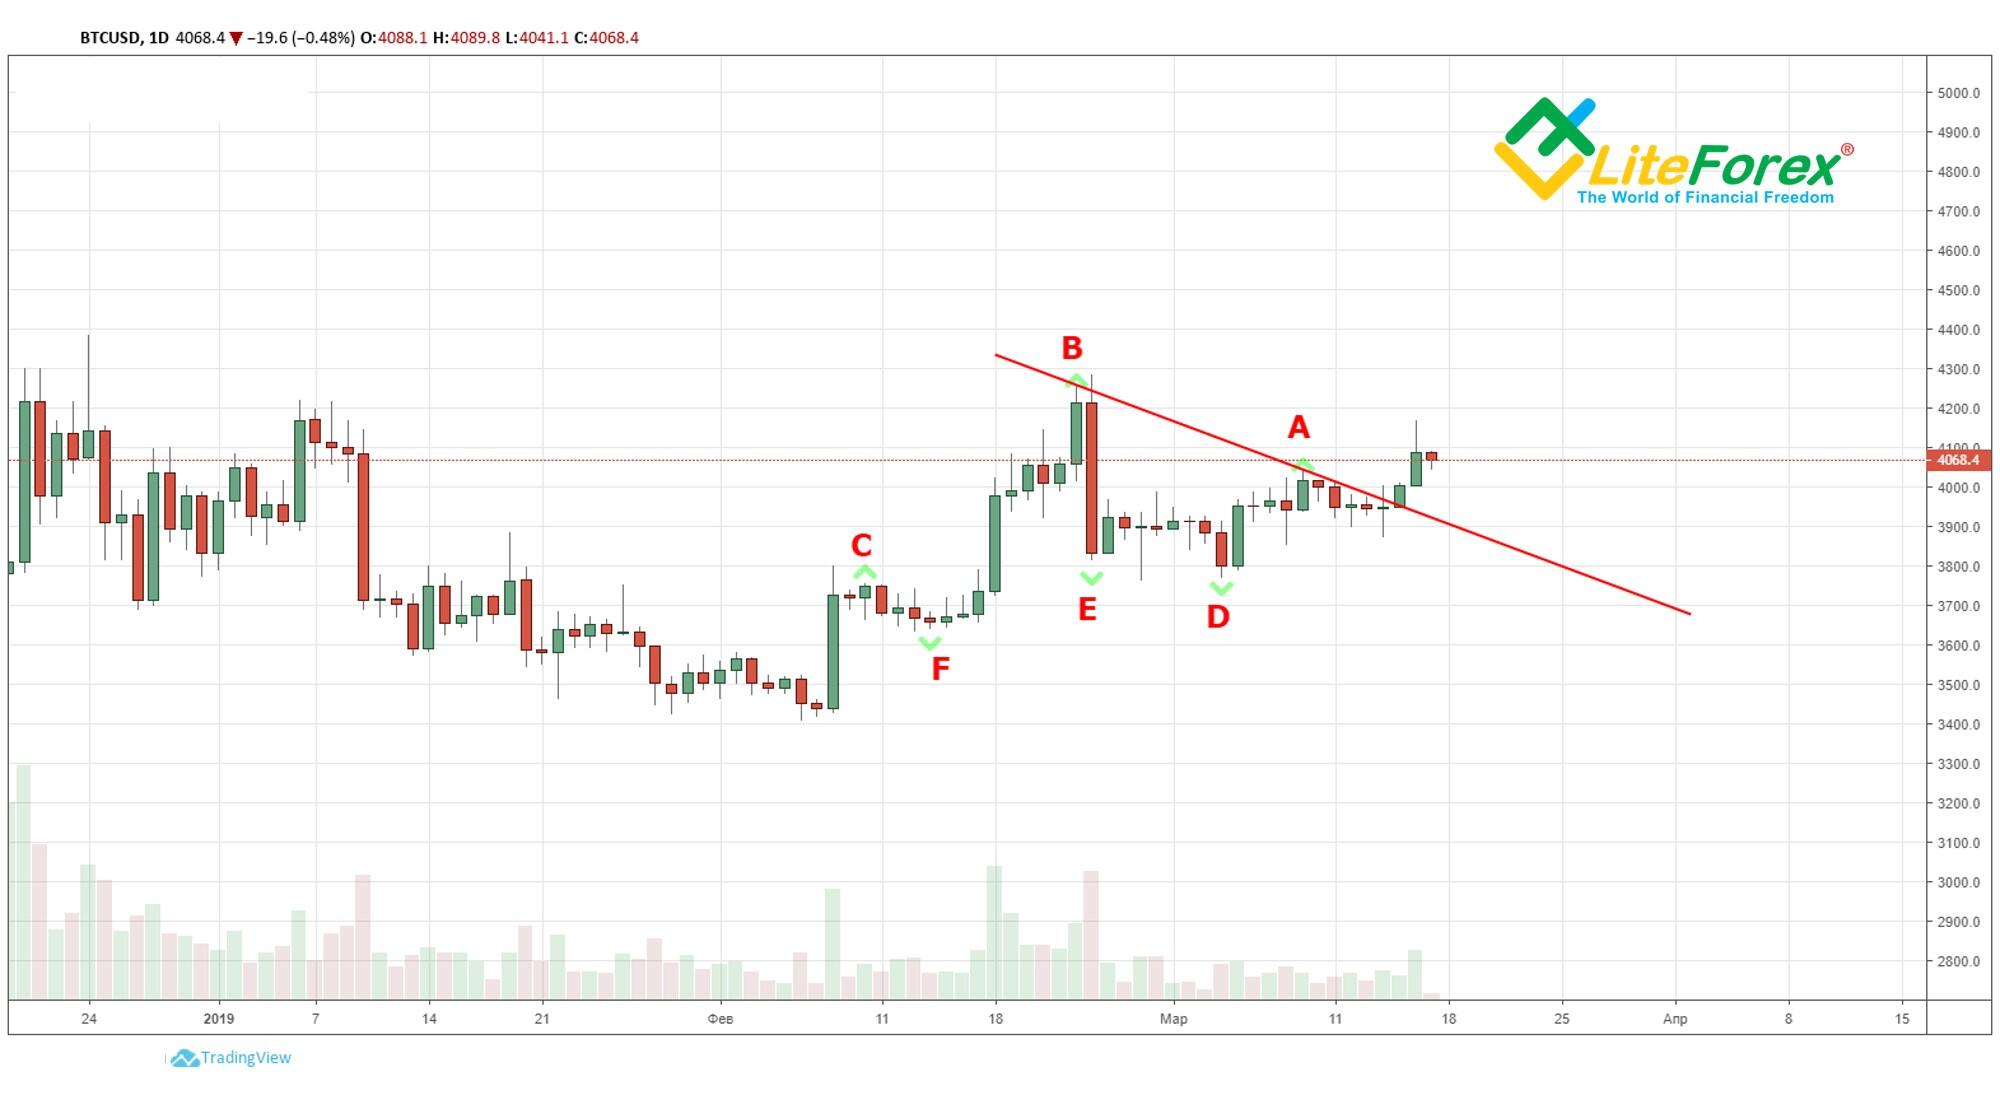
In our example, to draw a TD resistance (supply) line, we will draw a line through TD resistance points A and B. Examining the price movement, we see that the line was broken from below. It points to the start of a bullish trend, i.e. to price growth.
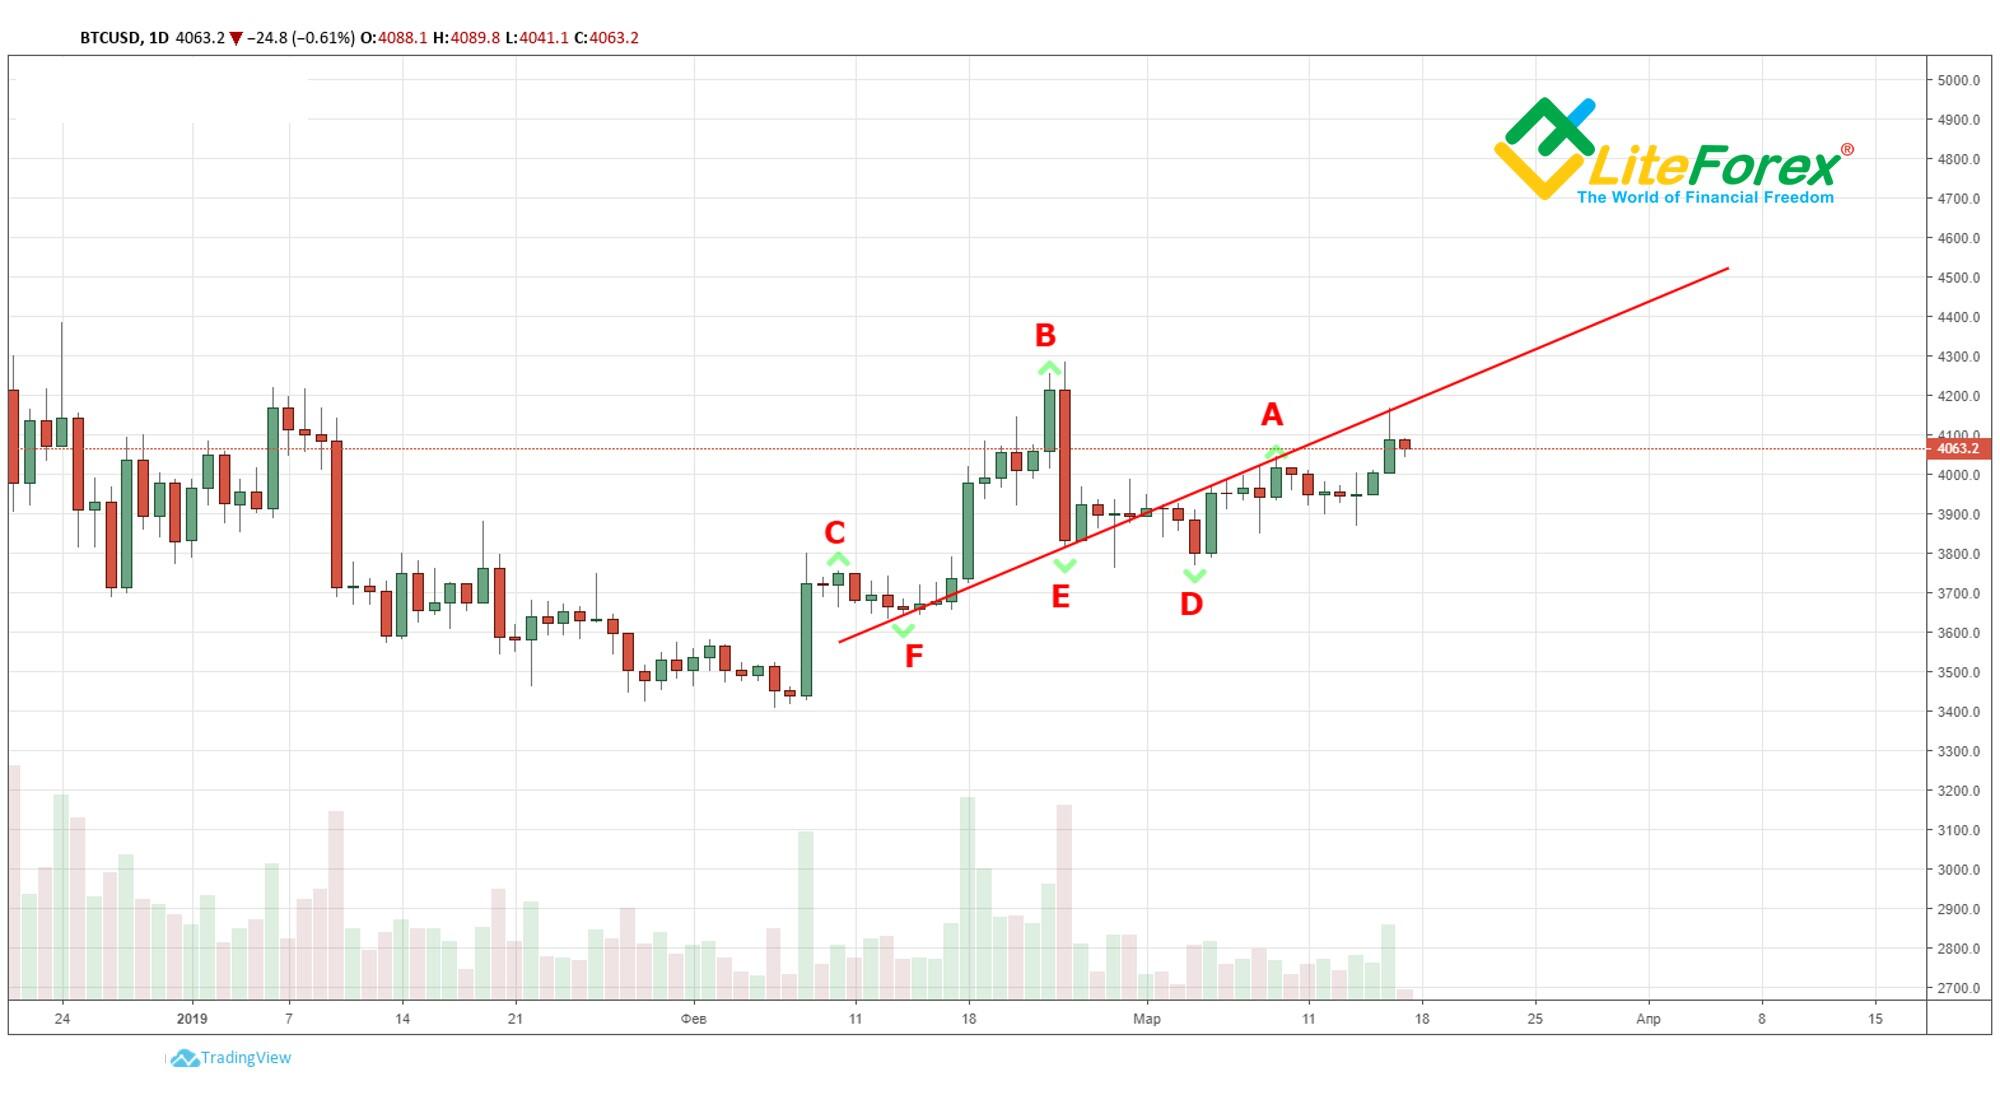
If we connect TD demand (support) points E and F from our example, we will get a TD support (demand) line. As you see, this line was broken, but there wasn’t a dramatic trend reversal, and the price continued its growth. Just like in classic technical analysis, support and resistance lines often change their meaning. In this case, a support line became a resistance line for the further price movement.
Since new TD supply and demand points will always appear in the chart as the trend develops, TD lines will be constantly updated, according to price changes. Thus, a trader will always understand in which trend the market is moving at the moment.
TD signals for making a trading decision
Having decided on how TD resistance and support lines should be drawn, DeMark worked out a number of rules relative to how the price should react to these levels.
He noticed that unexpected crossings of a trend line don’t often coincide with the direction of a breakout because a stop loss is triggered and trend/breakout traders often exaggerate forthcoming price movements.
And, vice versa, short-term breakouts, as a rule, don’t immediately end after a widely expected trend line crossing because trader holds positions before the breakout. DeMark differentiates between true (or solid) trend lines and false (or broken) trend lines. Using them, traders can open new positions in the direction of a true inside-bar breakout and cancel trades when a false inside-bar break of TD lines takes place.
Three qualifiers of TD demand (support) line
Once you’ve drawn a TD demand line, you need to wait until three conditions are satisfied to make sure that it’s time to open a new trade in the direction of a breakout.
Before one or a few conditions are met, you can expect a breakout inside the bar after which the price will go out beyond the limits of the breakout level.
Breakouts of a TD line which are confirmed by one or a few qualifiers are called “true” and serve as signals for opening a position to sell if a TD demand line is broken from above and to buy if a TD supply line is broken from below.
If none of the qualifiers has confirmed a breakout, the signal is considered as false and isn’t taken into account.
It’s very important to use these rules not to open loss-making trades especially if you’re a margin trader to whom the smallest mistake may bring huge losses.
TD demand line qualifier №1
Supposing that a price bar breaking a TD demand line from above is called “bar X”, you need to compare the closure of X-1 (price bar before a downward breakout) with the closure of X-2 (2 price bars before a downward breakout).
If the closing level of X-1 is higher than X-2’s, it’s highly possible that the X bar will close below the TD demand (support) line.
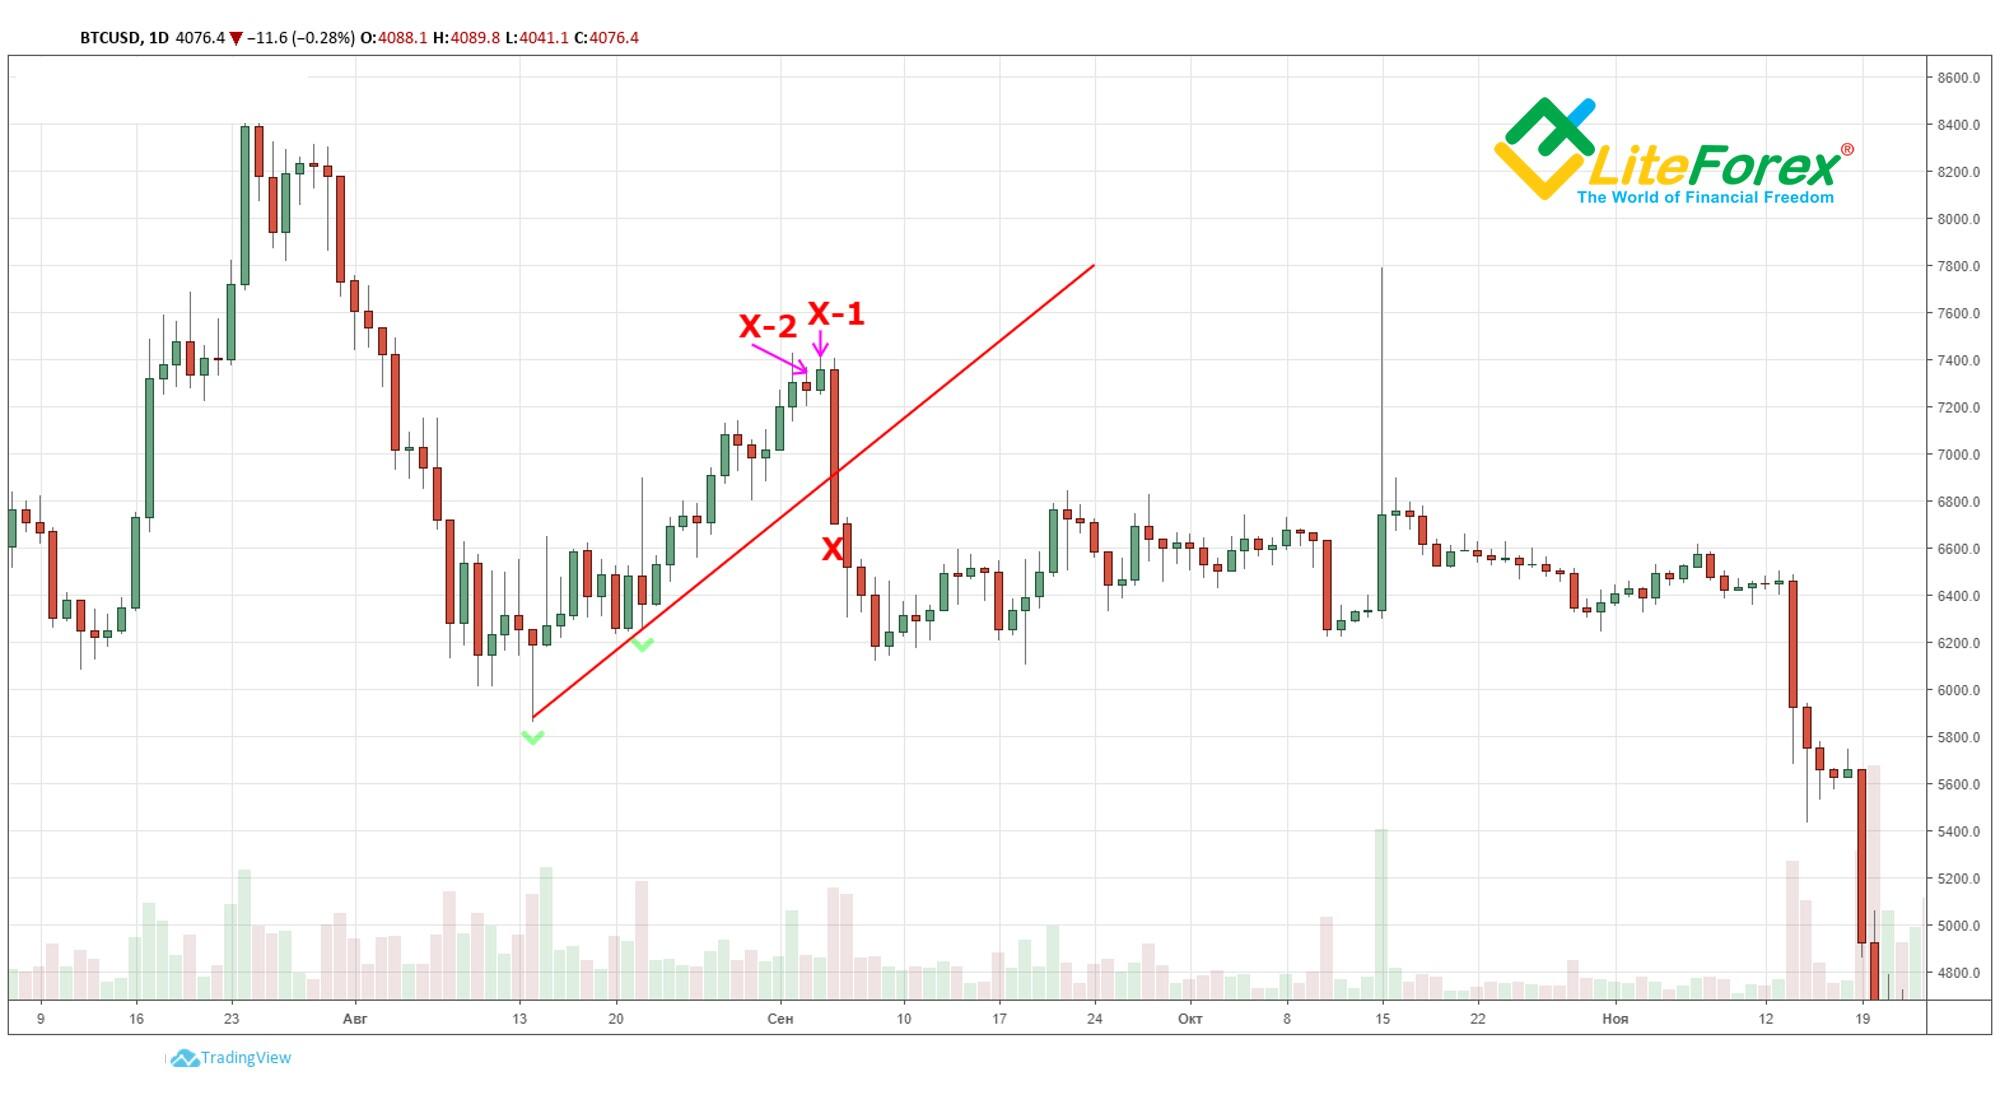
As we can see in the picture above, the closing price X-1 is higher than X-2. Based on these data, we may suppose that a resistance breakout made by bar X will be true and open a trade at a price below the breakout point, without waiting for the closure of candle X. As you can see, the price went sharply down, which confirmed the validity of the breakout.
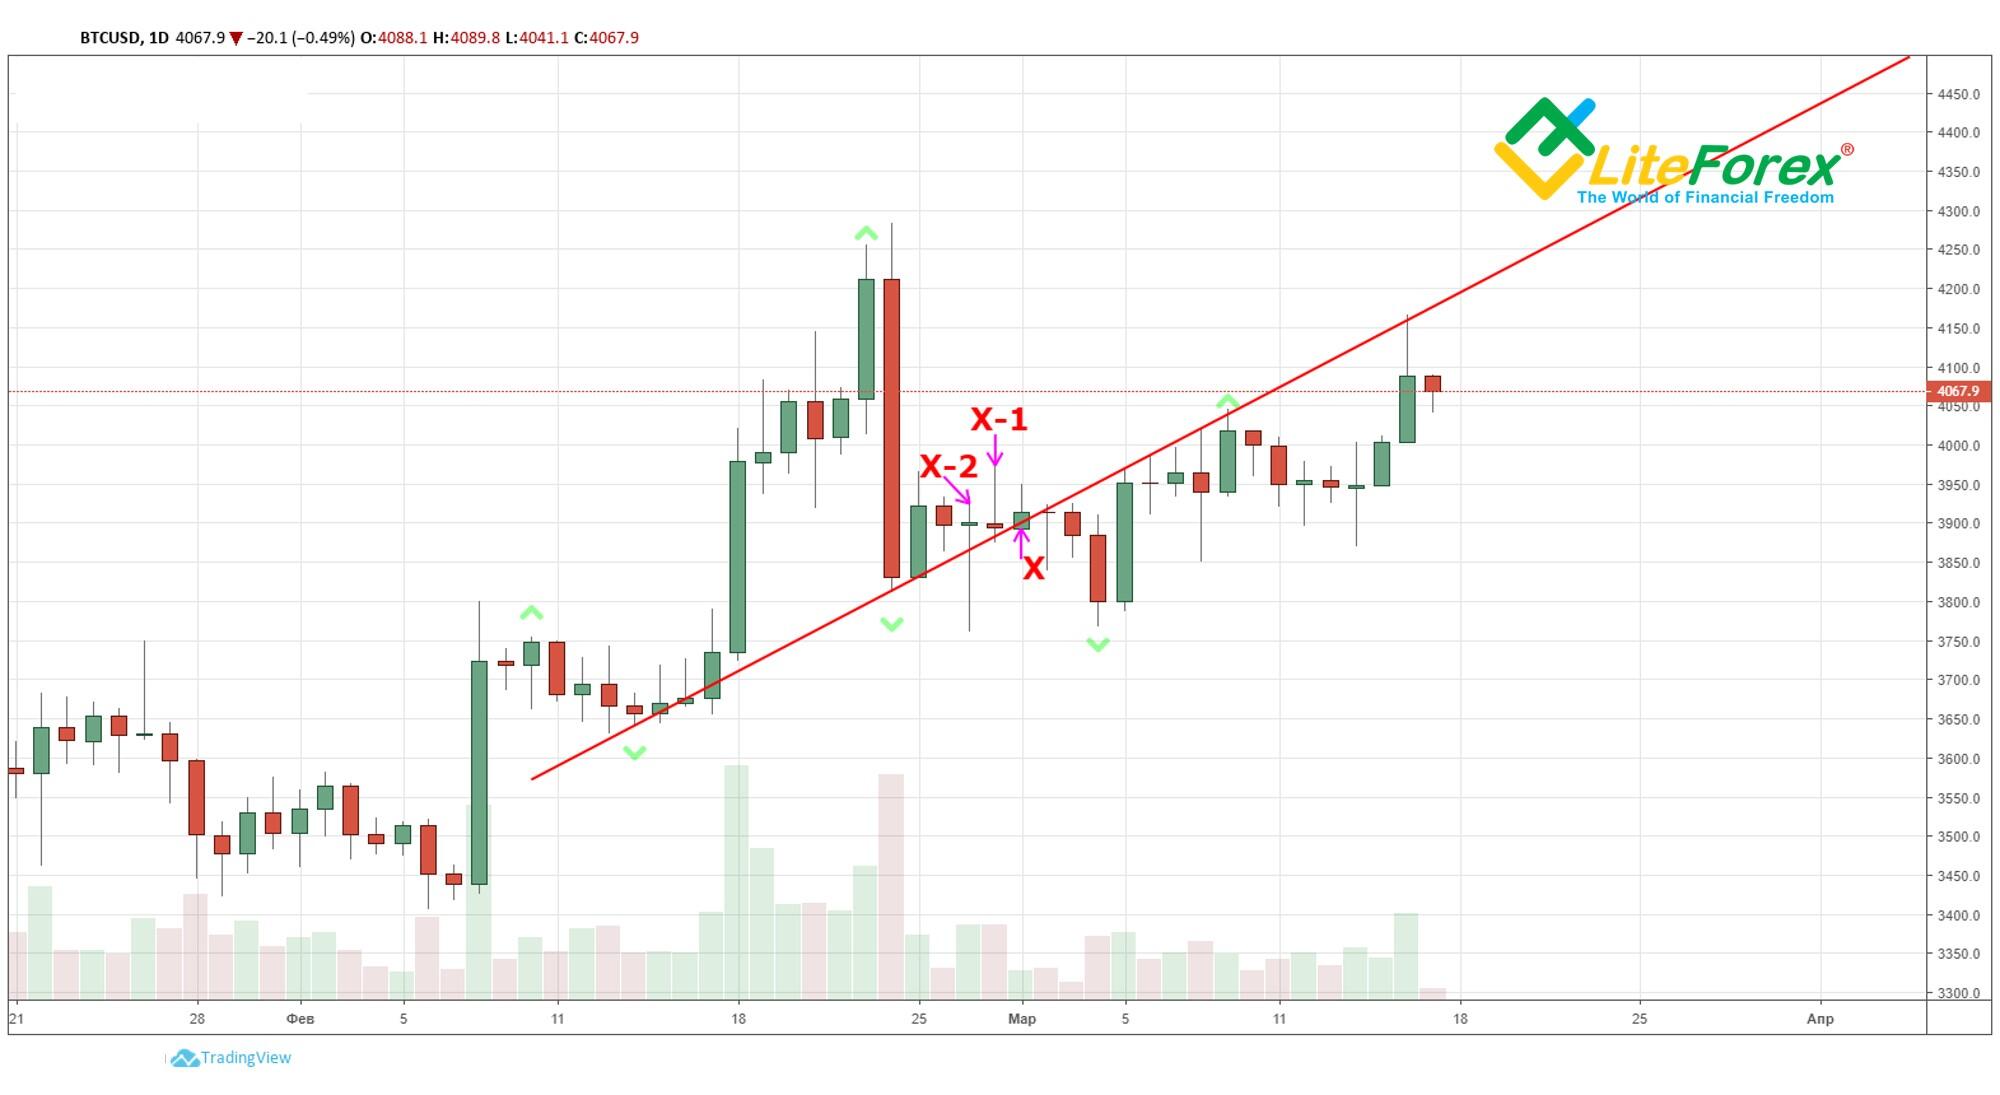
The picture above shows that the closing price X-1 is lower than X-2. Based on these data, we may suppose that the breakout of resistance made by bar X will be false. In this case, we’d better refrain from short positions.
The reason is that a higher closure of a candle before a downward breakout of the TD demand line indicates the crowd’s bullish sentiment. If even a relatively small market fall takes place, it puts stronger psychological pressure on the bulls making them close their long positions. At the same time, the bears will open new short positions more willingly and thus increase the chance of closing below the TD demand line.
Conversely, if a candle which precedes a fall has already updated its closing point minimum level, it means that a big part of market participants are getting ready for a fall and aren’t sure about long positions. As a result, a breakout is more likely to be false as panic sales are hardly probable and the bulls will easily claw back such a fall.
At the same time, if you see that a bar has closed downwards before a breakout of the lower limit of the TD demand line, you don’t need to consider an inside-bar breakout of the TD demand line, expecting that the market would close above it again.
TD demand line qualifier №2
If a breakout candle closes under the TD demand line, it says that new sale pressure has shifted the demand/supply ratio in favour of the bears in the medium term. In this case, DeMark will consider the breakout as true.
This signal is usually used in combination with the previous one. Based on my personal experience, I can say that a false signal probability rises if you use this classifier alone.
If two conditions above haven’t been observed, you can use one final qualifier to measure the pressure of sales, i.e. supply, before the lower limit of the TD demand line is broken.
TD demand line qualifier №3
1. Projecting a breakout of bar X, identify the price bar before a breakout of the TD demand line (X-1) and calculate the difference between the closure of this bar and the biggest value out of two following values:
- The high of this bar;
- The closure of the previous bar (closure X-2);
2. Then, subtract this value from the closure price X-1 and if the result is above the breakout point of the TD demand line, we will get a signal to sell at the inside-bar breakout of the TD demand line, expecting the market to close below it.
If the result of subtraction is below the breakout point of the TD demand line, then the breakout is considered as false and is less likely to grow at closure.
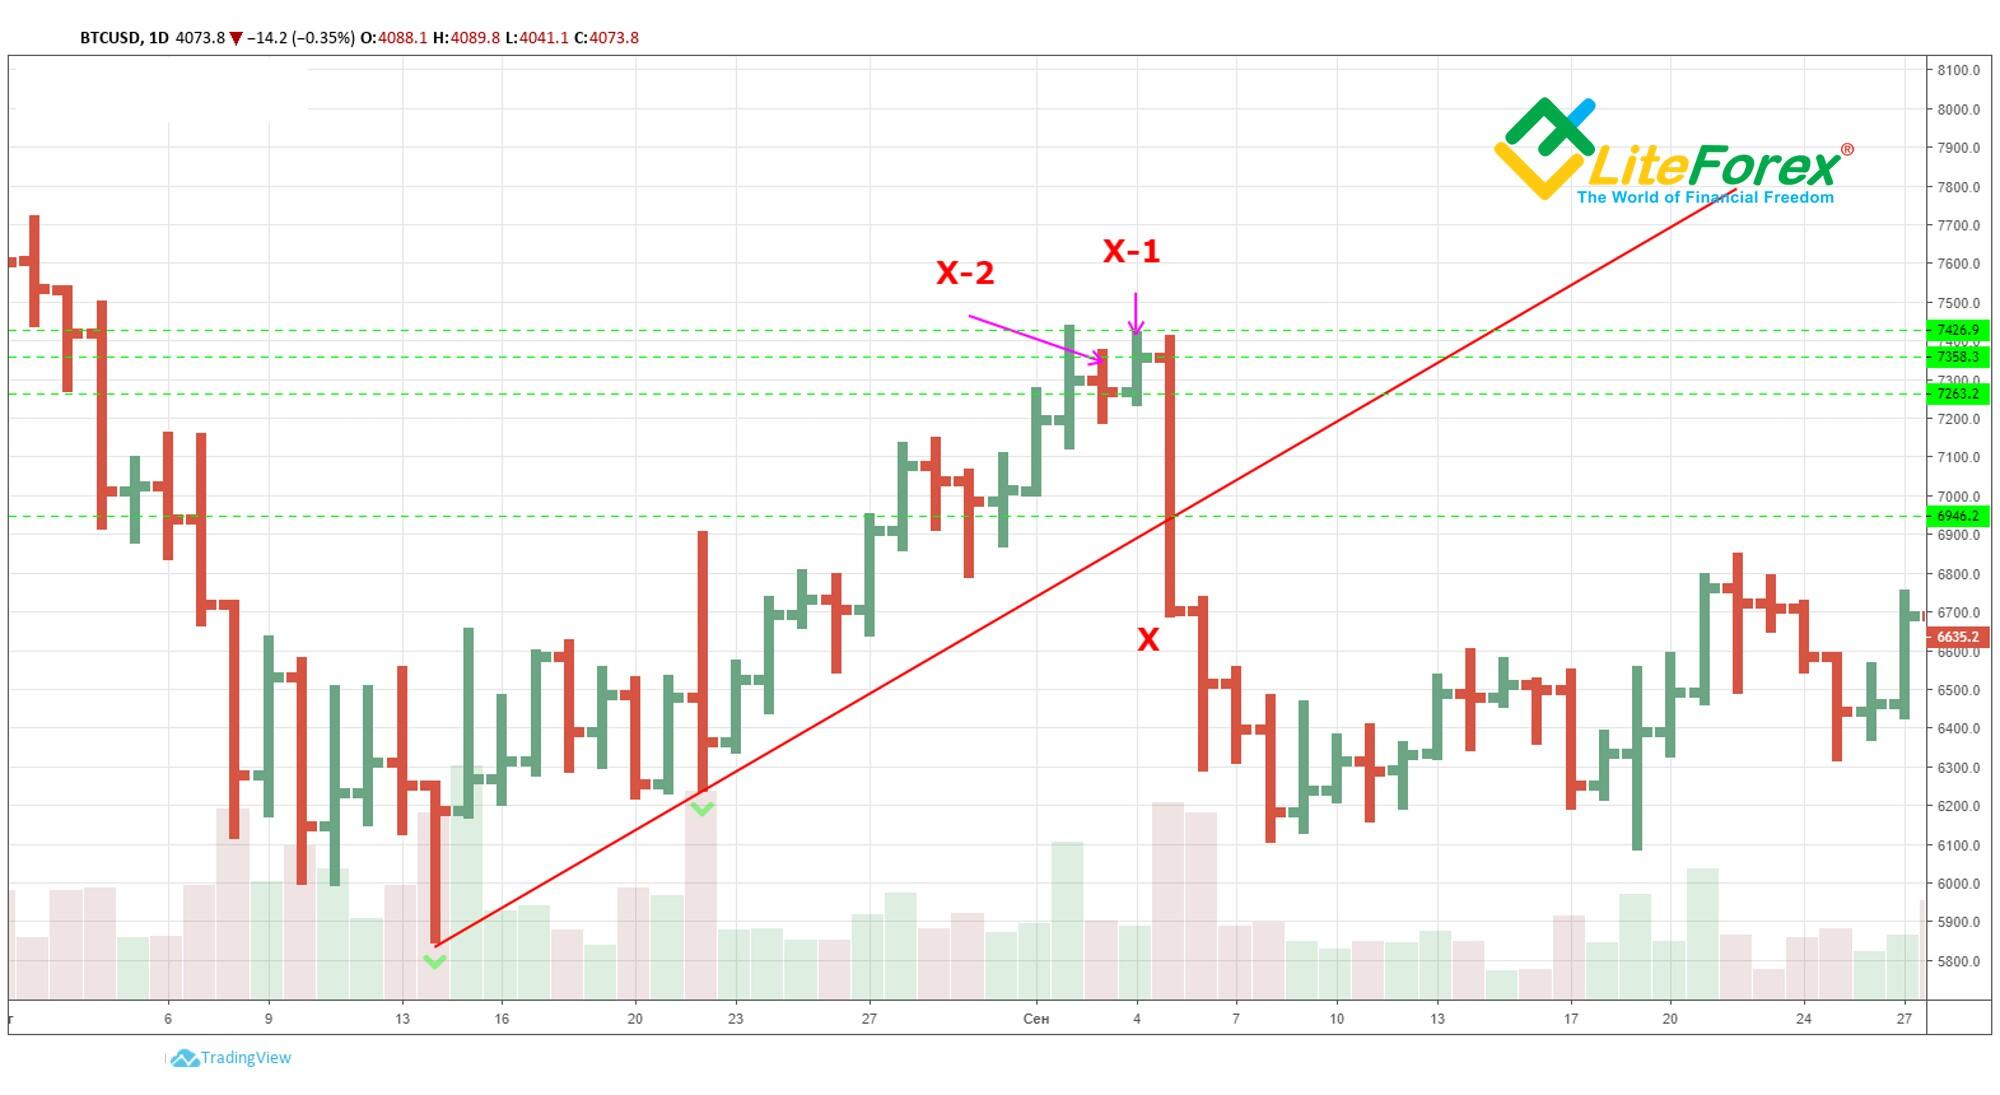
Here’s an example of calculation.
The high of bar X-1 equals 7426 and the closure price of the previous bar X-2 equals 7263. For calculation, we’ll take the price of bar X-1’s high as it’s bigger than the closure price X-2.
The closure price X-1 equals 7358.
7426-7358=68. It’s the difference we get at the first calculation stage.
Then we subtract this value from the closure price X-1 and we get 7290 (7358-68=7290).
The breakout point of the TD demand line is at 6846 in our case.
As you see, the calculation result is above the breakout point of the TD demand line, that’s why a demand line breakout may be considered as true if candle X makes it under such conditions.
Target calculation at a breakout of TD demand (support) line
You must remember from your school physics course that for every action, there is an equal and opposite reaction. But DeMark asserts that this law can be also applied to markets, where symmetry is often present. Price movements above the TD demand line are often copied under it after a true downward breakout.
Determining a target at a true breakout of TD demand line
- You need to identify the highest true price maximum above the TD demand line and draw a perpendicular line under the TD demand line in the breakout area.
- Subtract the length of this perpendicular from the point where a true breakout took place and you’ll get an exit point.
The target will remain the same until a true upward breakout takes place. In this case, the demand/supply ratio will be shifted or the breakout target of the descending trend line will be reached.
Now, when you’ve entered a short positions after a true inside-bar descending breakout of the TD demand line, you need to take some actions which will lead you out from this position if something goes wrong.
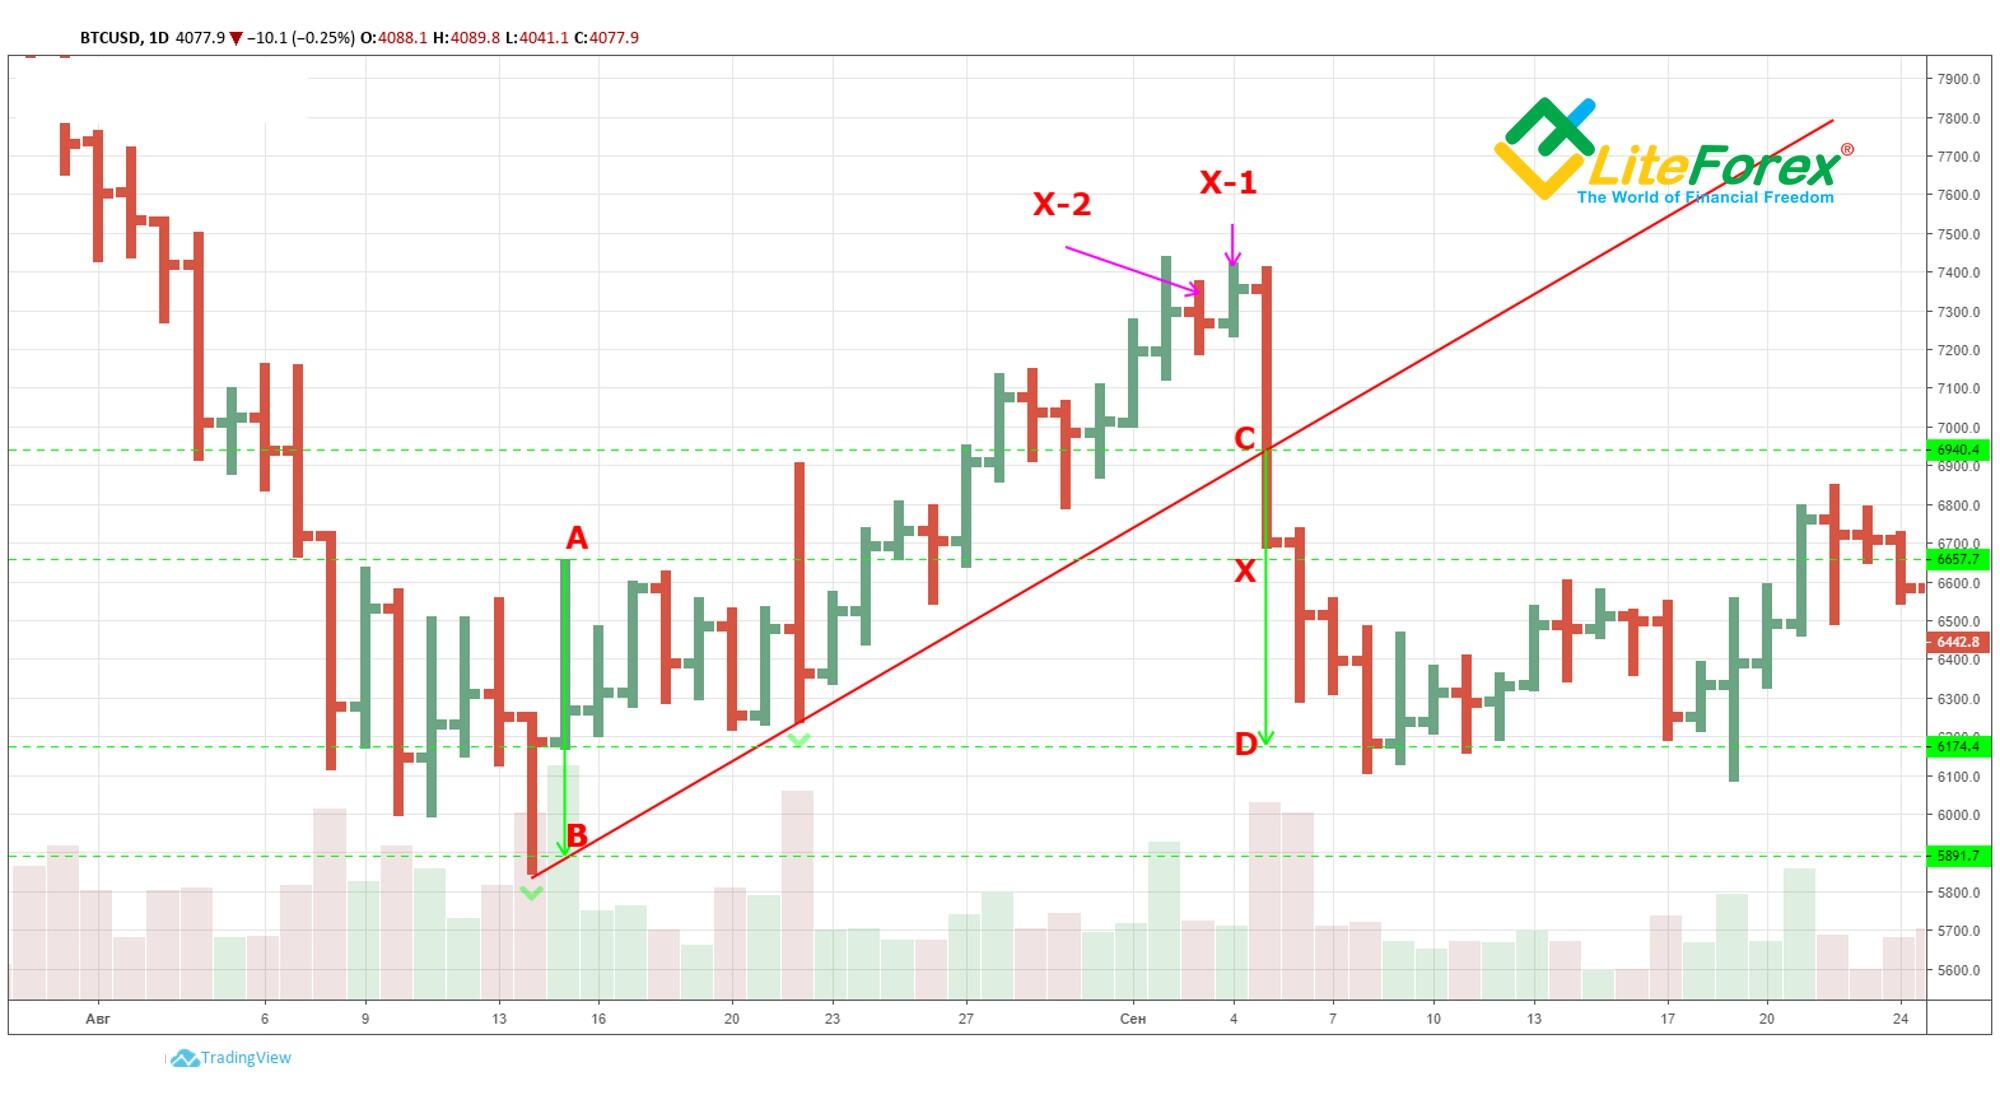
Let’s examine the example above.
The highest price above the breakout line is a segment marked as AB. Its value equals 6657-5891=766.
Subtracting its value from the breakout point, we get 6940-766=6174.
As we can see in the chart above, the price forecast proved to be correct, and if we’d opened a position a bit below the TD demand line breakout point - at 6900, for instance, - we could earn 726 points of profit.
Exiting a short position by use of TD demand line
There exist 3 rules for closing a short position after an unsuccessful breakout of the TD demand line:
- If the opening price of a candle right after a downward breakout is above the breakout level, you should exit at the opening price of the candle.
- If the opening price of a candle right after a downward breakout is above the breakout level and the candle closes above the breakout level of the TD demand line, you should exit at the closing price of the candle.
- If the low of the candle coming next after the breakout of TD demand line cannot fix the price below the candle’s low at the moment of breakout, you should exit at the closing price of the candle.
Next we will continue examining Tom DeMark’s tools, paying attention to TD supply line and connected signals.
Construction principles and application of TD Supply Line
Further description of TD Lines trend indicator by Thomas DeMark
I have already described the principles of drawing TD Points and TD Trend Lines based on technical analysis tools, developed by Thomas DeMark, a famous financial analyst and trader. I also explained TD Demand (support) line qualification and how to make right choice of points for entering and exiting trades.
Now, I will describe TD supply (resistance) Line in more detail and explain how to identify right points to enter LONG trades. We will also study the cases when the market is moving contrary to our expectations and the trend line breakout turns out to be false. In such situations, you need to find out the way to close long positions. I will take the BTCUSD pair as an example.
First, let me remind you how TD Supply (resistance) lines are drawn according to Tom DeMark Technical analysis.
TD Lines by Thomas DeMark
As we all know, DeMark’s approach operates with the most up-to-date data. The current price movement is more important than price dynamics for previous days. Therefore, the trend line should be plotted from right to left using the highs, closest to the right-hand side of the chart. I mark them A and B. We draw a line through these points from right to left. This is TD Supply (resistance) line.
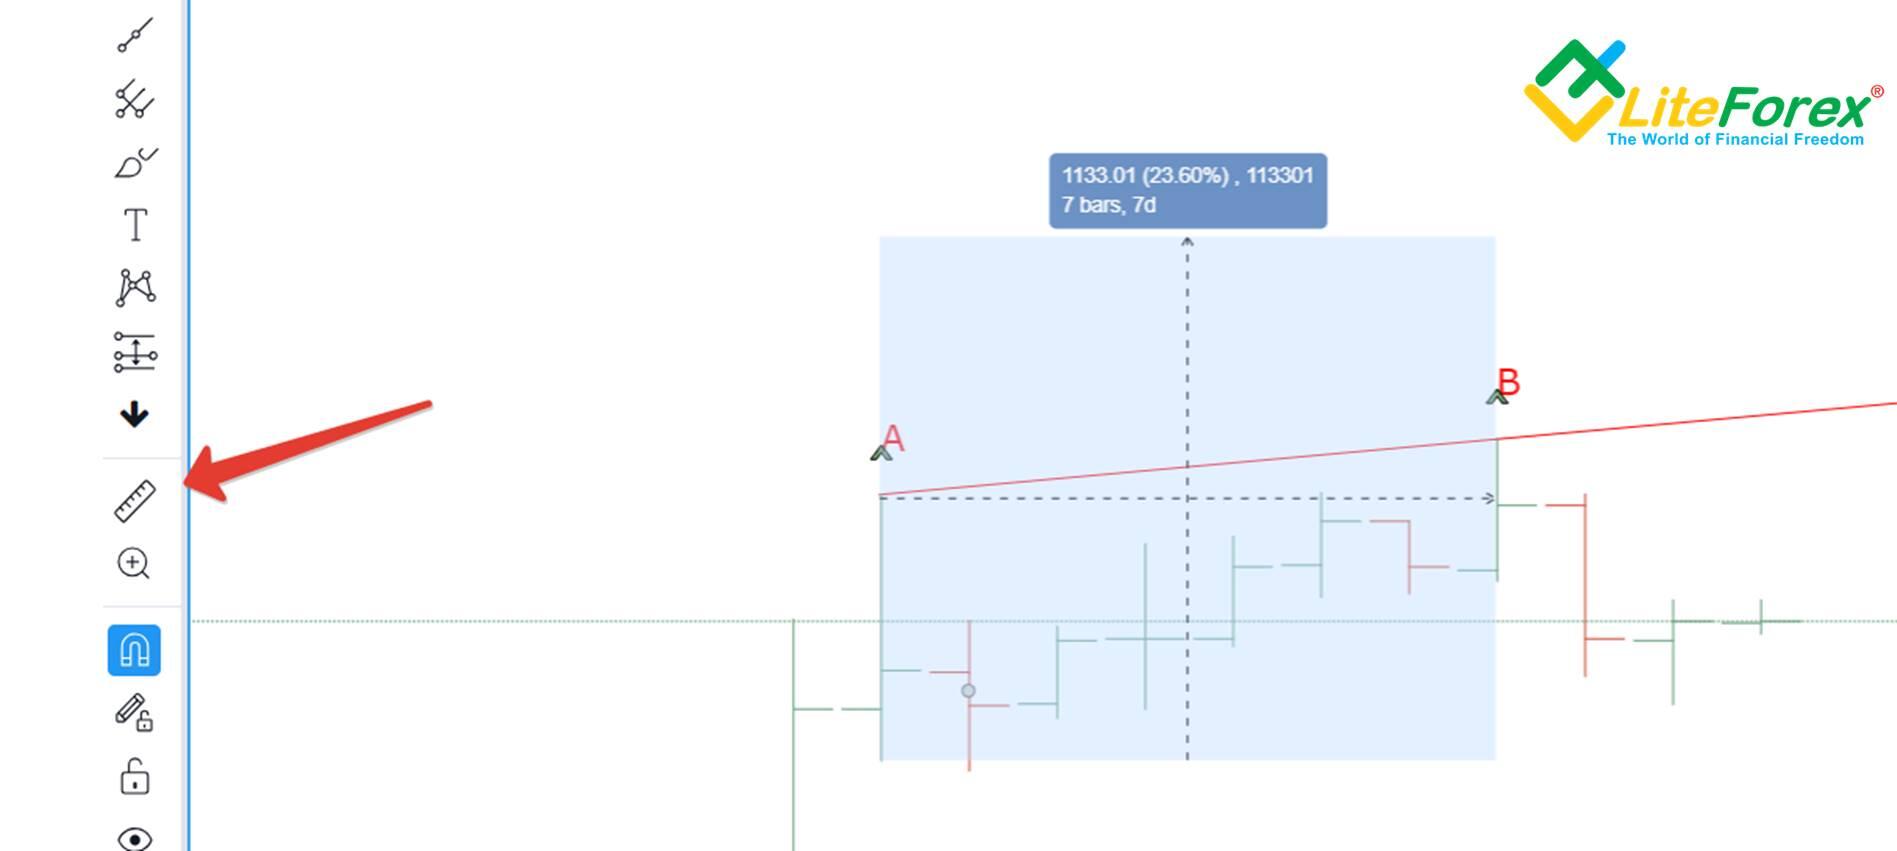
A little bit of advice. To facilitate the search for extreme points I used the Bill Williams fractal indicator. It looks for a bar that is surrounded on both sides by bars that have a closing / opening price lower / higher than its value and marks it with a tick. You can calculate the level of each TD Point using the measuring tool, which is located on the left panel in the tradingview panel and marked with a ruler icon, as shown in the figure below.
TD Supply (resistance) Line qualifiers
Analyzing a downtrend, traders always look for LONG entries. To do it you need to expect a signal of trend upside reversal. According to Thomas DeMark, this signal is a true breakout of the resistance line. Remember, the breakout is true if it is confirmed by on of the TD supply line qualifiers.
TD Supply Line Qualifier №1
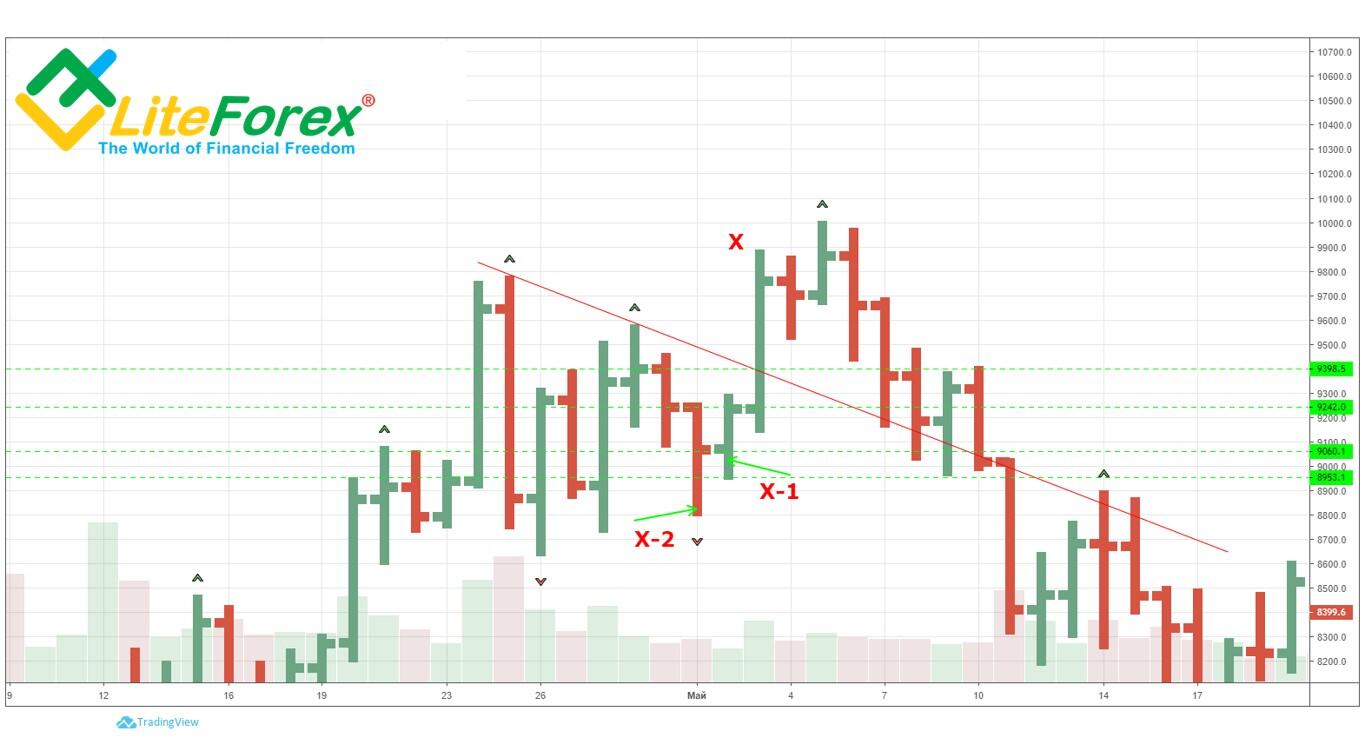
Supposing that the price bar, breaking out TD supply Line upside, is bar X, you need to compare the closing price X-1 (the price bar prior to an upside breakout) with the closing price X-2 (the close two bars ago).
If close price X-1 is lower than close price X-2, then, in case of TD supply line breakout, bar X is likely to be the true reversal signal (see the figure below).
The logic is based on the assumption that if the lower close is before TD supply line breakout, forex market participants are likely to expect the downward momentum to develop and the sellers’ pressure to continue in the near future. Therefore, when there is an unexpected upside breakout, bears have to exit short trades, and bulls are likely to enter new long trades, thereby making the bar more likely to close above TD supply line. And vice versa, if X-1 closes higher than X-2 before the uptrend of TD supply line breakout, this intrabar breakout is less likely to be supported, because short-term traders will be positioned for a downward movement, expecting a further decline in the price. In practice, this means that if the price slides down and closes the bar before the breakout of the upper TD supply line, you can buy at the TD supply line breakout, expecting the bar to close higher than the breakout point.
If you see that the bar closes higher than the previous one, prior to the TD supply line breakout, you may consider this signal to be false, expecting the market price to close lower than this level.
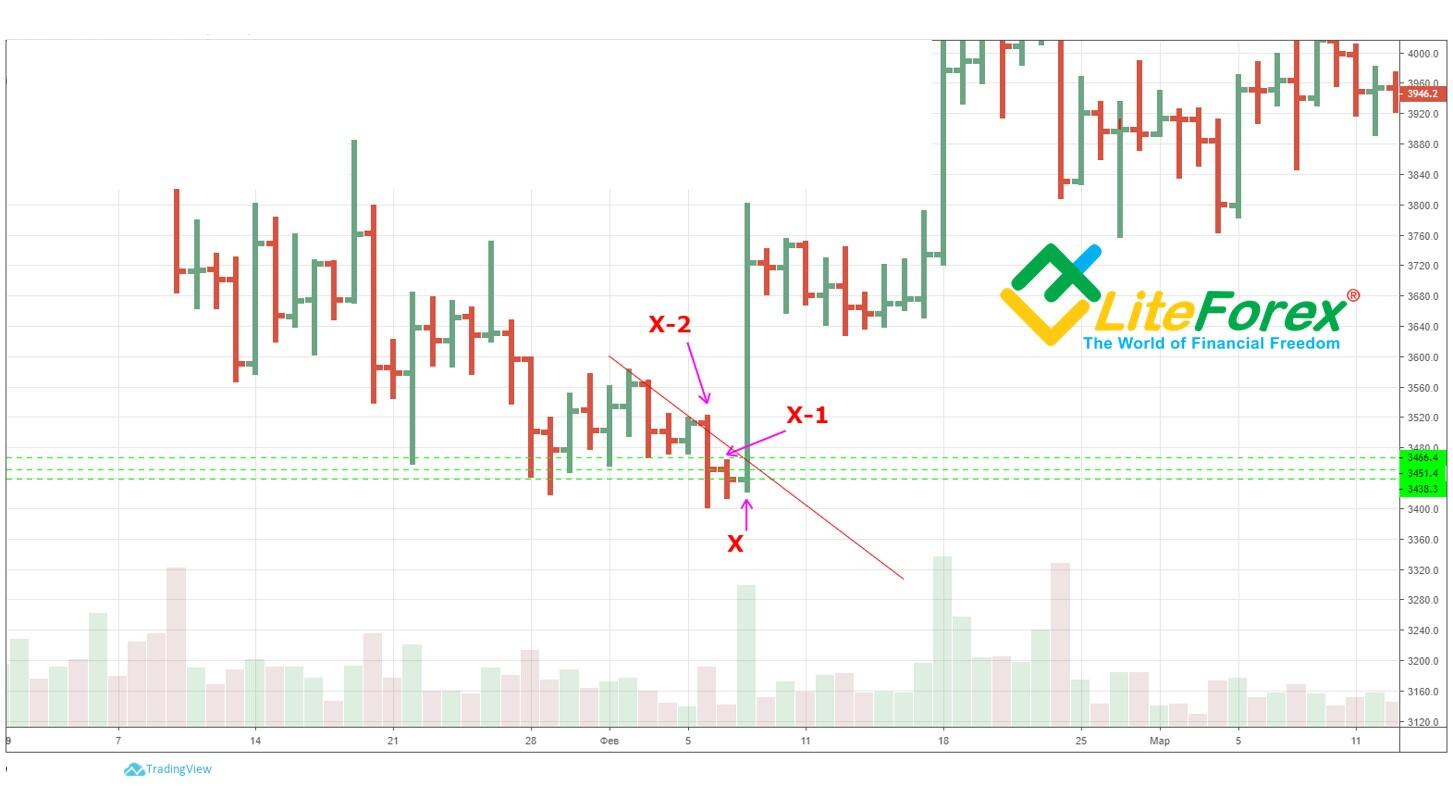
In the above example, bar X-1 closes at 3438 and Х-2 – at 3451. As you see, in this case the first TD line qualifying condition is staisfied. So, the breakout is true and you may enter LONG trade higher than the breakout point at 3466 without expecting the close of bar X.
As you see from the chart, the trend has really reversed and the trade entered according to this signal could have yielded a good profit.
TD line qualifier №2
If the breakout bar opens with an upside gap and closes higher than Supply line, this indicates that that the new buying pressure has shifted the short-term supply / demand ratio in favor of the bulls. Thus, a TD line breakout will be considered true, and you may buy at the TD supply line breakout, expecting the market price to close above it.
Supposing that neither of the first two conditions is satisfied, you may apply one final qualifier to measure the pressure on the buyer, that is the demand, before the TD supply line breakout.
TD line breakout qualifier №4 is a supplementary, confirming signal and can’t be used alone.
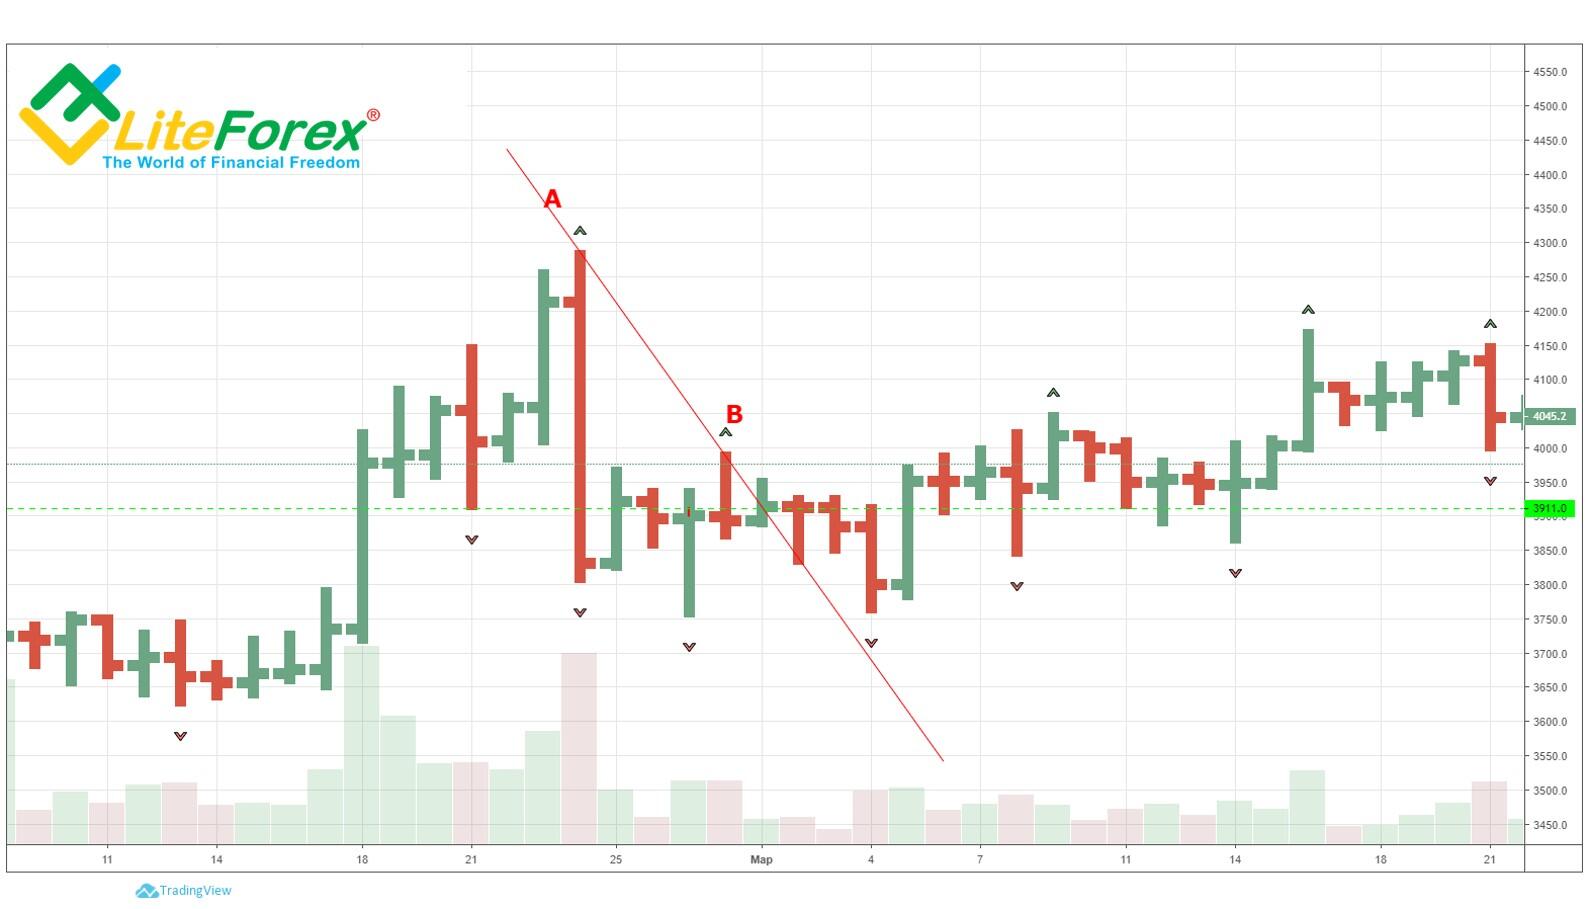
As an example, I will build a TD supply line through two highs of the third level, A and B.
As you can see from the above example, the TD supply line breakout is at a level around 3911. Although the closing prices of the two previous bars are roughly equal and the condition of the first classifier is not met in this case, the TD line trendline breakout is true and the trend reversed upwards.
TD Line breakout qualifier №3
Supposing that TD supply line breakout is bar x, find out price bar X-1 prior to the breakout and calculate the difference between this bar close and the least of its two subsequent values:
- Low of this bar, or
- Closing price of the prior bar (X-2 close)
Next, add this value to the close price of X-1 and, if the result of the calculation is lower than the TD supply line, then buy on the intrabar breakout of the TD supply line, expecting the market to close above it.
If the result of the calculation is above the TD line breakout point,
Then the breakout inside the bar is considered to be false, and it is less likely to reach the lower limit at the close.
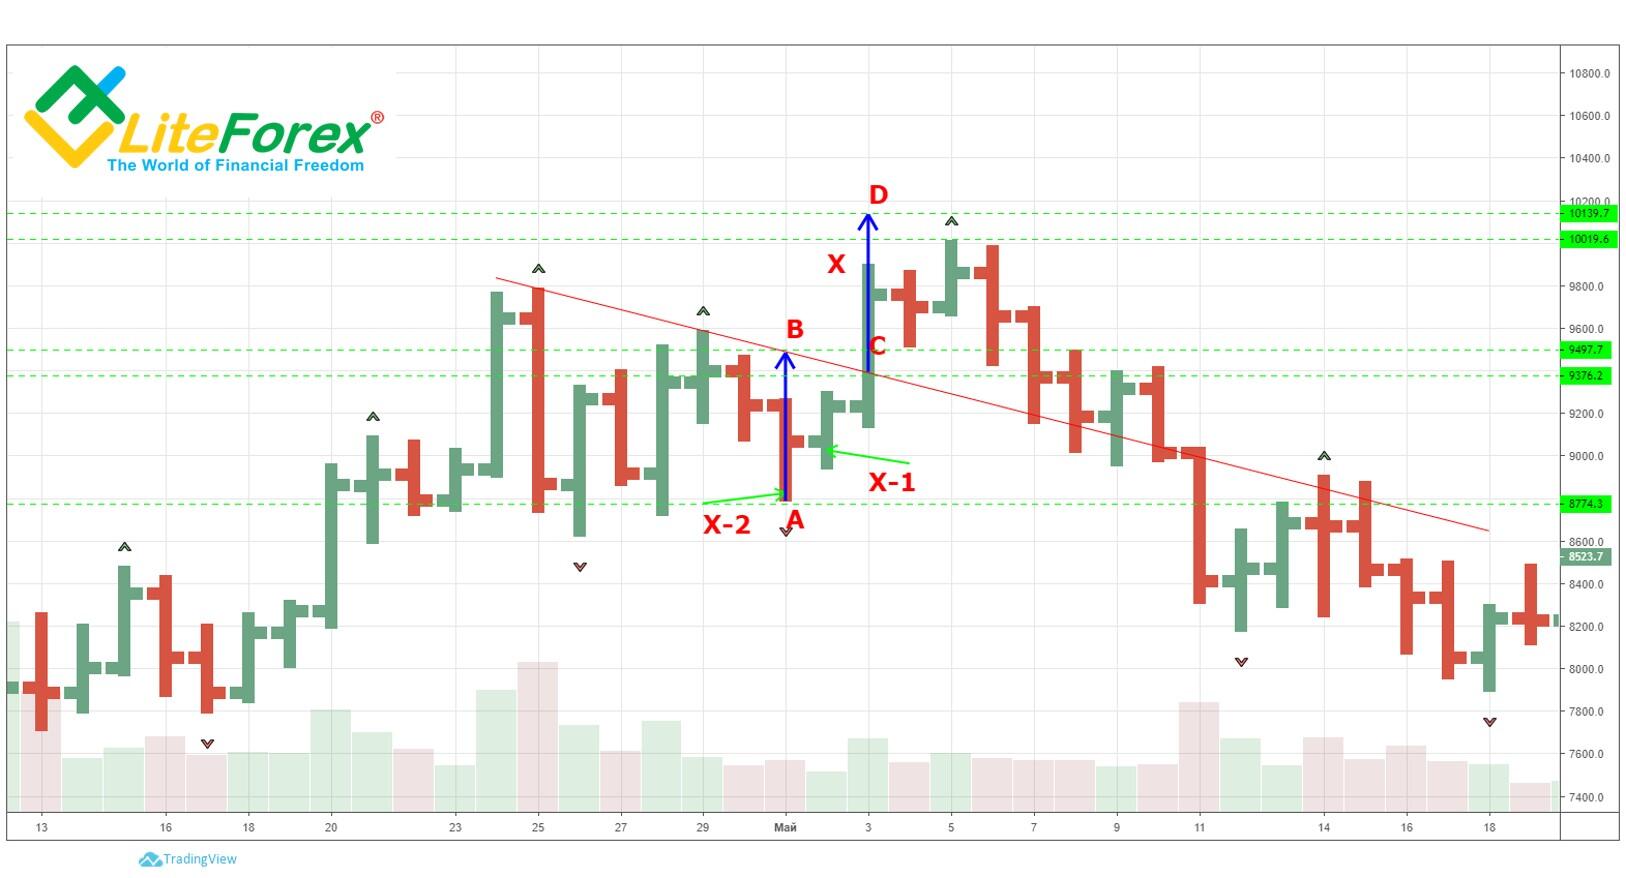
I will explain it on the example, displayed in the figure below.
X-1 low is 8953, the prior bar X-2 close price is 9060. I will take the X-1 low for calculation as it is higher than X-2 close.
X-1 close price is 9242
9242-8953=289 - This is the desired difference of the first stage of calculation.
We add this value to the closing price of the X-1bar and we get 9242 + 289 = 9531.
The TD-line breakout point in the given example is at 9398.
As you see, the calculation result is higher than the TD supply line breakout, so, if bar X in this conditions breaks through the supply line, it will be a true breakout.
In fact, if you look at the further price action, you will see that the trade, entered according to this signal, would have yielded a profit. However, the trend didn’t reverse, which proves the necessity of observing risk management rules and applying other technical tools.
Calculation of target profit for the TD supply (resistance) line breakout
Well, now you know how to identify right situation for entering trades on the TD supply line breakout. But this is not enough. To make a profit, you need to exit the trade at the right time, i.e. to identify the target profit to exit the trade. To set this target with a true TD line breakout you need to do the following:
- Identify the lowest true low below the TD supply line and draw a perpendicular leg to the corresponding TD Supply Line above it.
- Add the value of the perpendicular leg to the true TD breakout point.
The target won’t change until there is a true downside breakout. In this case the supply/demand trend will be shifted or the uptrend breakout target won’t be reached.
Let us verify this rule on the example.
As it is clear from the chart, the lowest price, prior to the breakout is 8774.
1. The distance from the low to TD supply line is AB leg. Its length is 9497-8774=723 points.
2. We add this value to the TD line breakout point and we will identify the target to exit the trade.
9376+723=10099
All these manipulations can be done directly on the chart without calculations. To do this, you need to draw a leg AB and copy it from the breakout point, as a leg CD (see the chart above).
Unfortunately, the market is not always moving as we expect it to. You should always take into account fundamental factors, affecting the price movements. In this example, the price went up to only level 10019 and started rolling down. This is 80 points lower than we had expected. This also occurs and you should bear such situations in mind.
TD supply lines and exiting a long trade
When we have entered a long trade, following a true intrabar upside breakout of the TD supply line, we need to know how to exit this trade if something went wrong, like in the previous example.
There are three ways to exit a long trade after a failed upside breakout of the TD Supply line.
- If the bar, following the upside breakout, opens at a price lower than the breakout of TD supply line, you should exit it at the opening price of this bar.
- If the bar, following the upside breakout, opens at a price lower than TD supply line and the bar close is lower than the level of TD line breakout, exit at the closing price.
- If the high of the bar, following the TD supply line breakout, can’t fix the price higher than the high of the bar at the moment of the breakout, you should exit at the closing price of this bar.
This objective approach to the trendline construction proves that you can eliminate subjective errors while taking decisions. Applying defining rules to identifying TD demand points and TD supply points, determining whether breakouts are true or false, and having a clear methodology for defining the target profits of a TD Line breakouts, should help you identify the market trend and improve your trading performance.
In addition, since this approach allows you to operate mainly in an intrabar way before the trade session closes, it can it may, in some time, reduce the slippage for trades. (By the way, some people apply trend lines to momentum oscillators. Based on the logic outlined for TD lines above, you can experiment with applying TD lines to other indicators of overbought/oversold (RSI), to identify true/false breakouts and to predict true breakouts. Since a momentum derives from the price, ideally, you would like to see the price trend line and the momentum leaving the overbought / oversold area at the same time.)
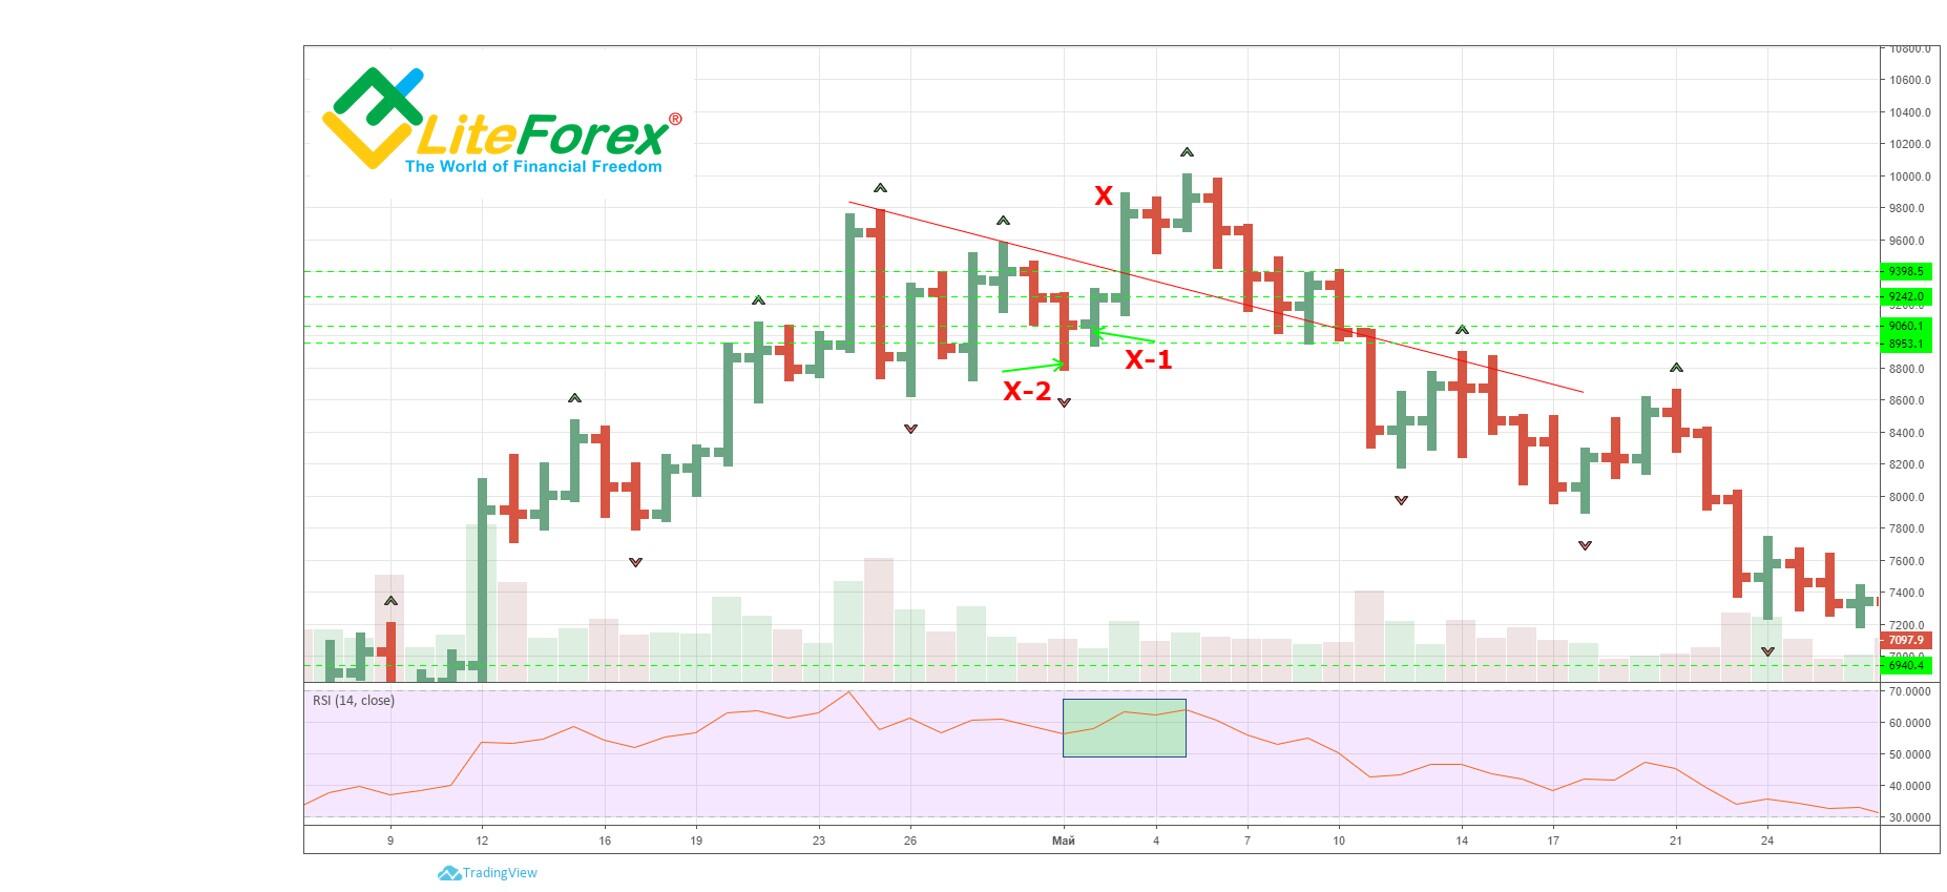
As you see from the given example, the TD supply line breakout is not confirmed in the RSI chart. In fact, the price having jumped up, is again going down. This means the trend is weak, which is proven by the further price movement in the chart. If the indicator had moved up into the oversold area, we could have state a strong bullish sentiment, but it is not about the example.
To consolidate the material on TD-Lines of supply and demand, let us study some more examples of analysis for the most popular cryptocurrency trading instruments.
Example of BTCUSD analysis
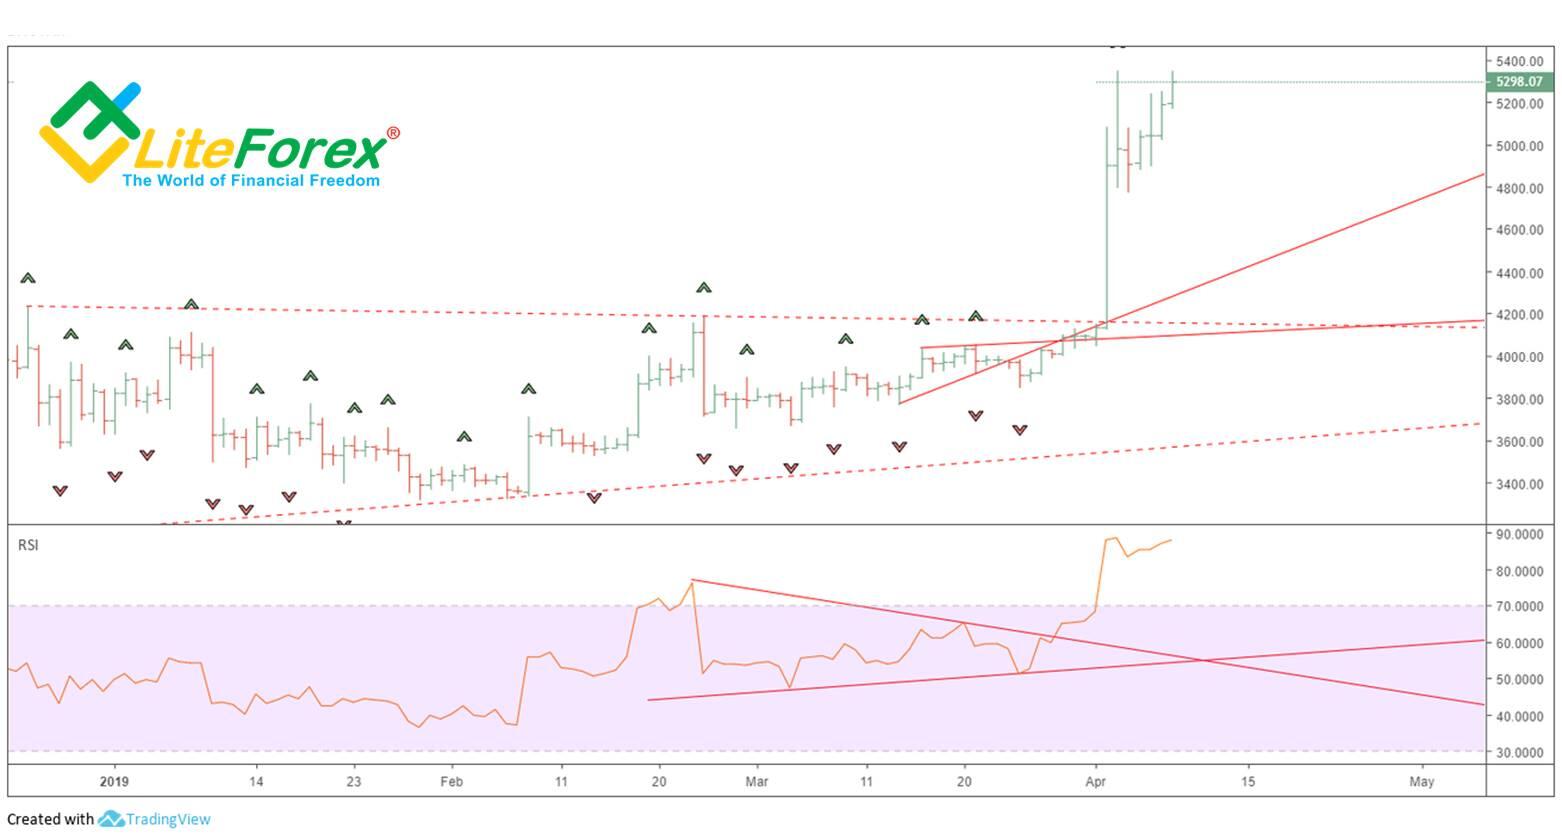
Let’s start with the BTCUSD pair. Just as Thomas DeMark recommended, we shall use the daily timeframe for analysis. Dots mark TD lines of supply and demand in the weekly timeframe, solid lines represent the daily timeframe.
I’ll also add the RSI indicator to identify the trend direction more accurately.
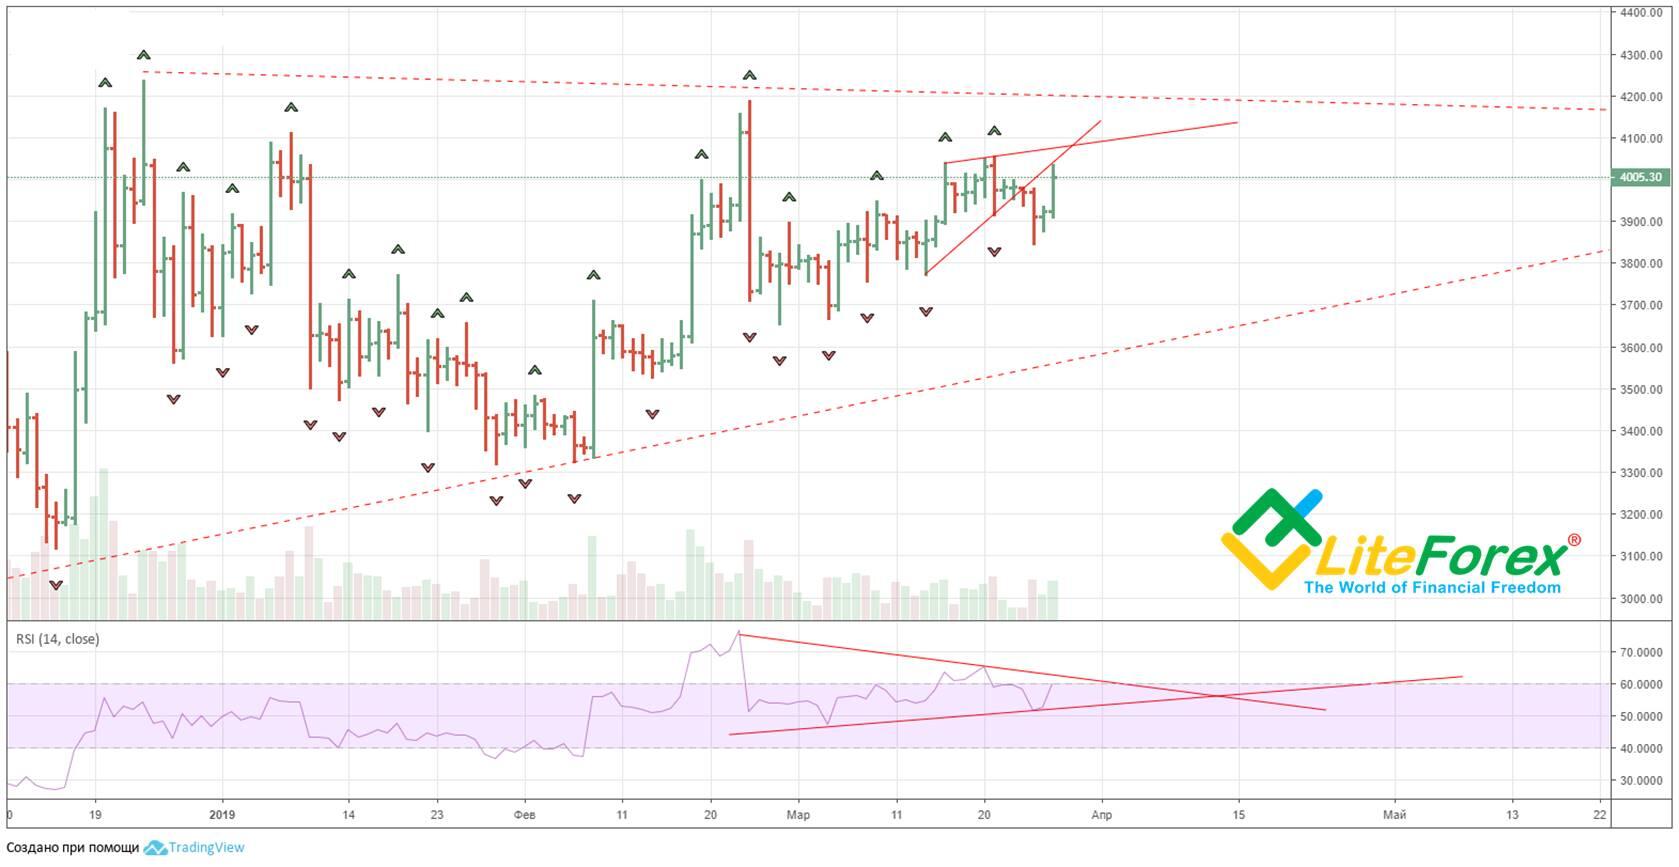
It is clear from the chart above that the price has broken through the TD support line but the conditions of the qualifiers are not satisfied, i.e. the signal is false.
Based on the RSI indicator, the price is moving towards the oversold zone. If we build the support and resistance lines in the RSI chart, we will see a Pennant pattern. The direction, it will be broken out, depends the further trend of the BTCUSD pair. Differently put, we make a conclusion that it is too early to enter a trade and take the investment decision. We need to wait.
Based on this chart, we can already assume that the movement to the zone of 3900 and lower has been a setup for the further upward movement of the BTCUSD pair, but there aren’t yet clear signals to enter a trade.
We deliberately ignore fundamental analysis, in order to demonstrate the efficiency of technical analysis, based on DeMark’s method.
Finally, the next price moves has proven our forecast.
It is clear from the figure above that the BTCUSD ticker broke through TD supply line only in a day. In addition, due to the first qualifier, the validity of the first breakout had been proven in advance.
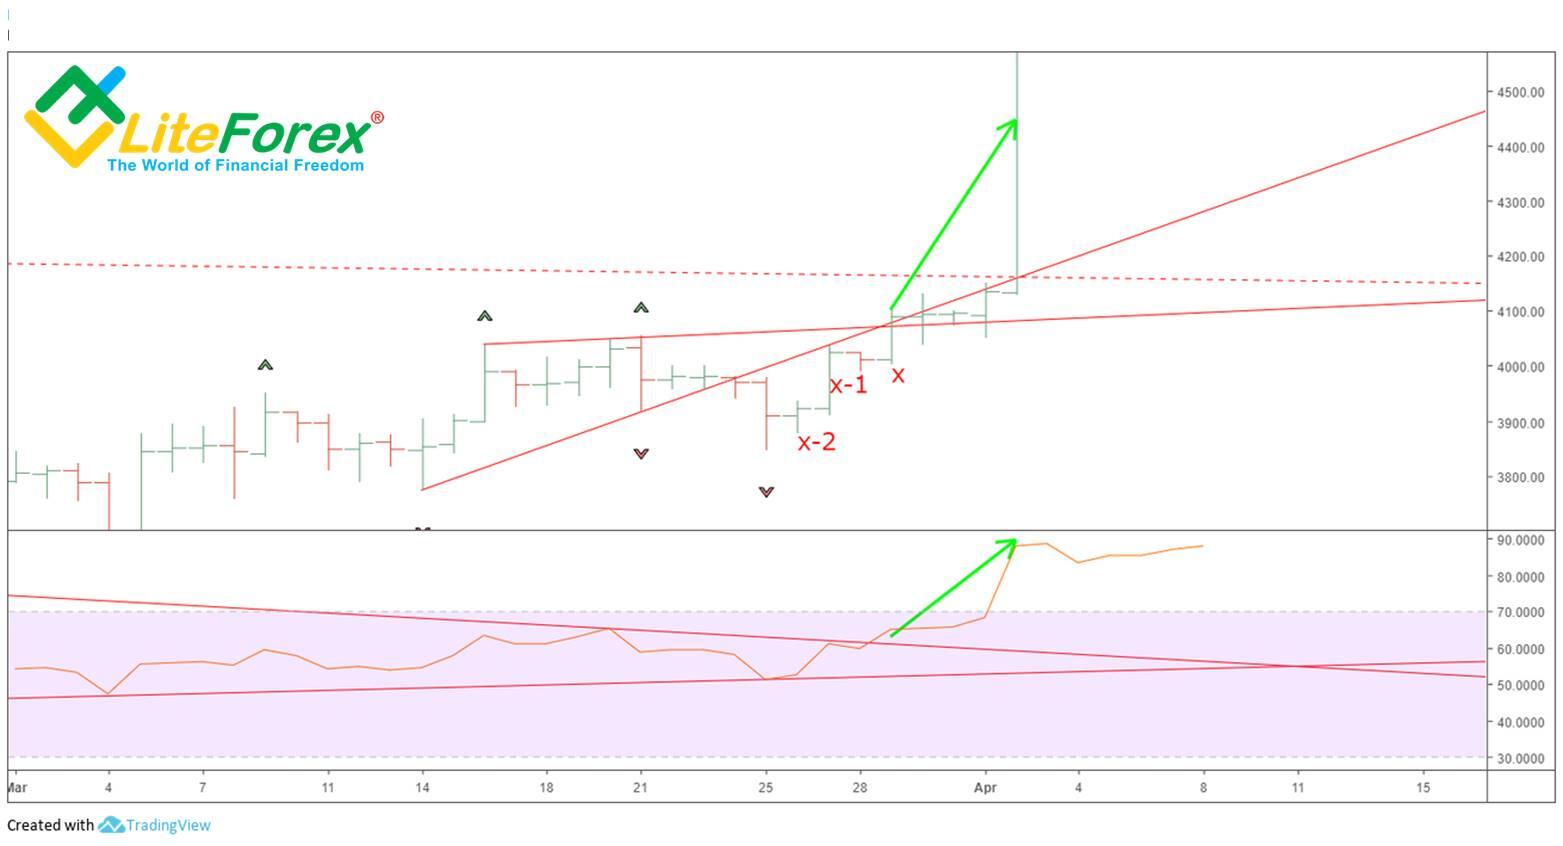
With a more detailed analysis, it is clear from the above chart that, ahead the supply line breakout at the bar X point, X-1 close had been lower than X-2 close. In addition, the price broke through the triangle in the RSI chart, which became the confirmation that the future momentum is true.
That concludes the description of how to build TD Demand Line and TD Supply Line, well as how to analyze the market situation by means of a qualified breakout according to Thomas DeMark technical tool.
In conclusion, I can add that when you apply TD Lines, you should take into account the signals of Thomas DeMark’s other tools. TD-Lines is not am independent tool, it is rather a part of the single system of technical analysis that must be used together with other indicators and signals by Thomas DeMark. To revise the material, you can go back to the article about TD D-Wave, TD Sequential and TD Combo. This is not the full list of DeMark’s tools.
In my next articles, I will describe the technical analysis for corrections using DeMark’s tools. You will learn how to anticipate the depth and the duration of the corrective price movements, how to identify the price extremes and calculate the correction coefficient in any market and any timeframe. And of course, the final step of our study will be the joint application of these tools and the use of the single trading system by Thomas DeMark.
Subscribe not to miss the continuation!
I wish you good luck and good profits!
PS. If you agree with my ideas, write “+” in the comments; if you don’t agree, put “-”. If you liked the post, just write thank you, and don’t forget to share the post. It is easy for you and I will be very pleased :)
Stay informed on the latest cryptocurrency news, follow my posts on the blog.
Useful links:
I recommend trying to trade with a reliable broker here. The system allows you to trade by yourself or copy successful traders from all across the globe.
Telegram channel with high-quality analytics, Forex reviews, training articles, and other useful things for traders http://t.me/litefinance.

Price chart of BTCUSD in real time mode
The content of this article reflects the author’s opinion and does not necessarily reflect the official position of LiteFinance broker. The material published on this page is provided for informational purposes only and should not be considered as the provision of investment advice for the purposes of Directive 2014/65/EU.
According to copyright law, this article is considered intellectual property, which includes a prohibition on copying and distributing it without consent.