Cryptocurrency trading strategy based on the Elliott wave principle interpreted by Robert Prechter and Bill Williams
Dear friends!
In recent articles, I explained different interpretations of the Elliott Wave principle offered by Bill Williams and Robert Prechter. If you are not yet familiar with these materials or have forgotten theory, I recommend you read the following articles:
Elliott Wave Theory according to Bill Williams (Part 1and Part 2),
Elliott Wave Theory according to Robert Prechter (Part 1and Part 2, Part 3, Part 4, and part 5).
After I studied the theory, I decided to hold an experiment and combine the two types of research of the Elliott wave theory to create an effective BTCUSD trading strategy. In the previous training article (see Part 1), I demonstrated the principles of trading the first three waves in a wave pattern. Now, I want to deal with the remaining two waves. Next, I will go on with a guide to trading corrective waves.
Well, at the end of the previous article, we have identified the expected final point using the wave ratios and the five bullets. We also shorted seven out of ten orders put earlier. This point will be the start of the correction, wave 4.
Wave 4
We won’t enter any trades during the fourth wave. We shall use it to identify the ideal entry point at the next up wave, which should be longer than wave 4.
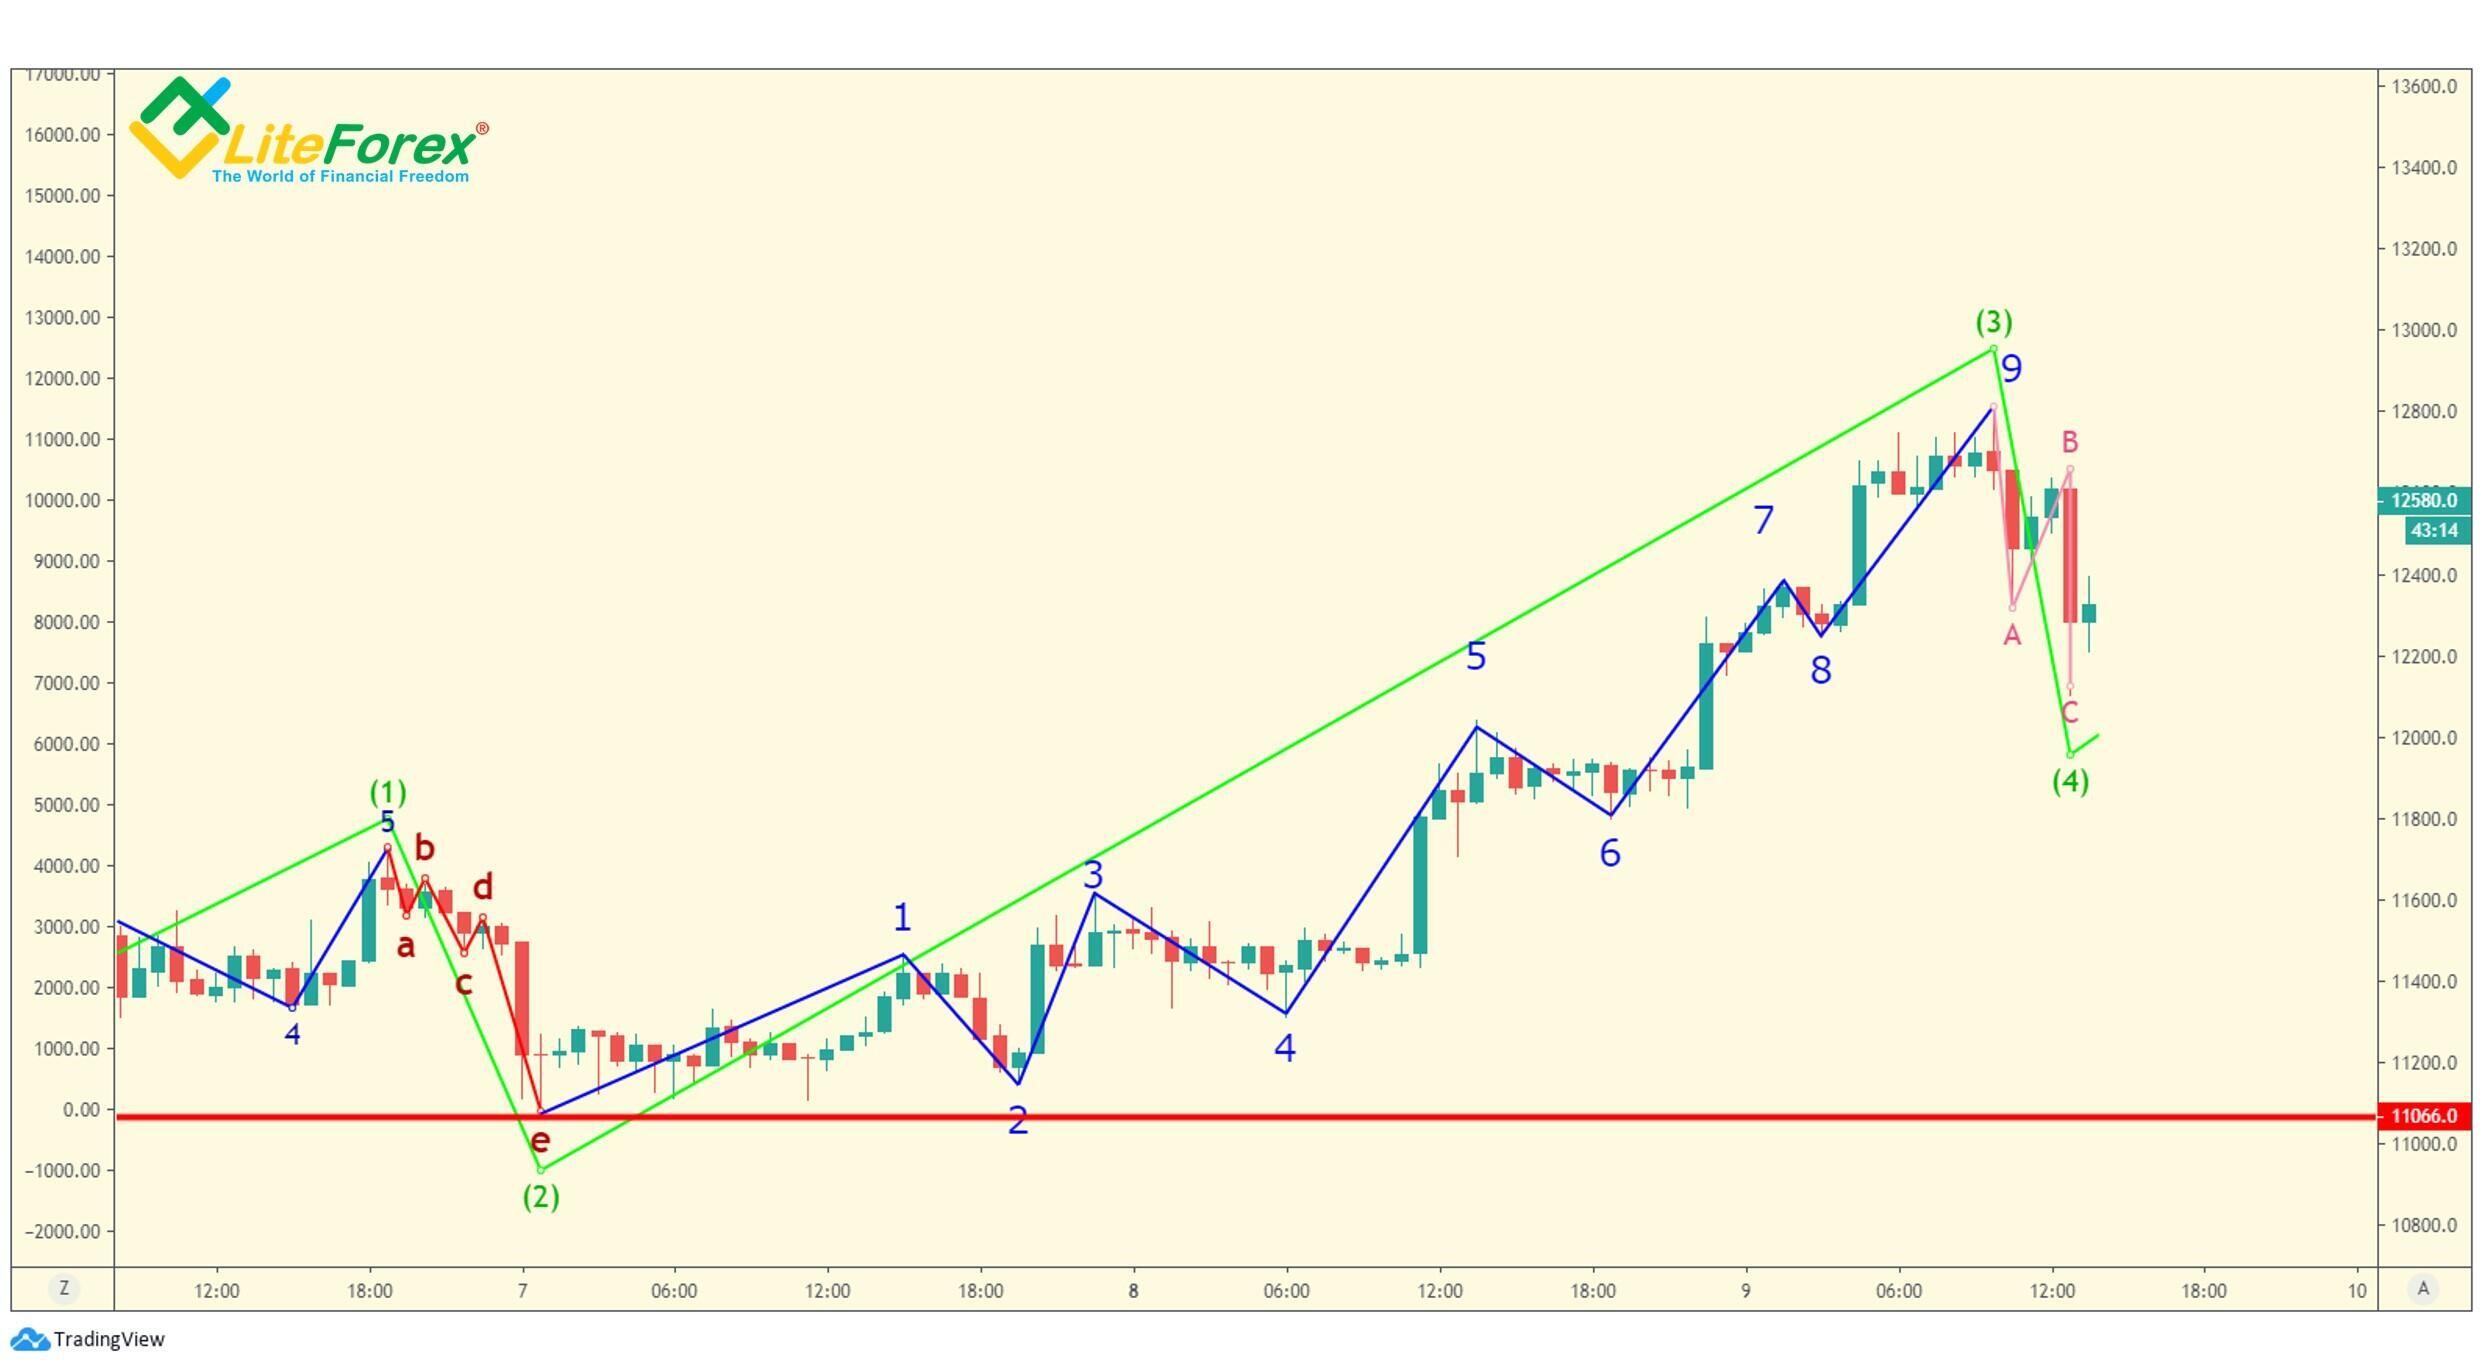
Williams says the length of the fourth wave depends on its design. If the fourth wave can be divided into five sub-waves, which becomes clear only at the stage of the formation of the fourth wave, then the price should go down quite deep. However, three-wave corrections are most commonly flats or short zigzags, like in the case displayed above, which won’t drive the price very low.
Prechter, however, is guided by the wave alternation law, according to which, an intensive movement in the position of the second wave is alternated by a sideways moment in the fourth wave. In our example, the second wave presents an intensive, sharp down move, so, the zigzag in the position of the fourth wave looks flattened, although it is not entirely flat.
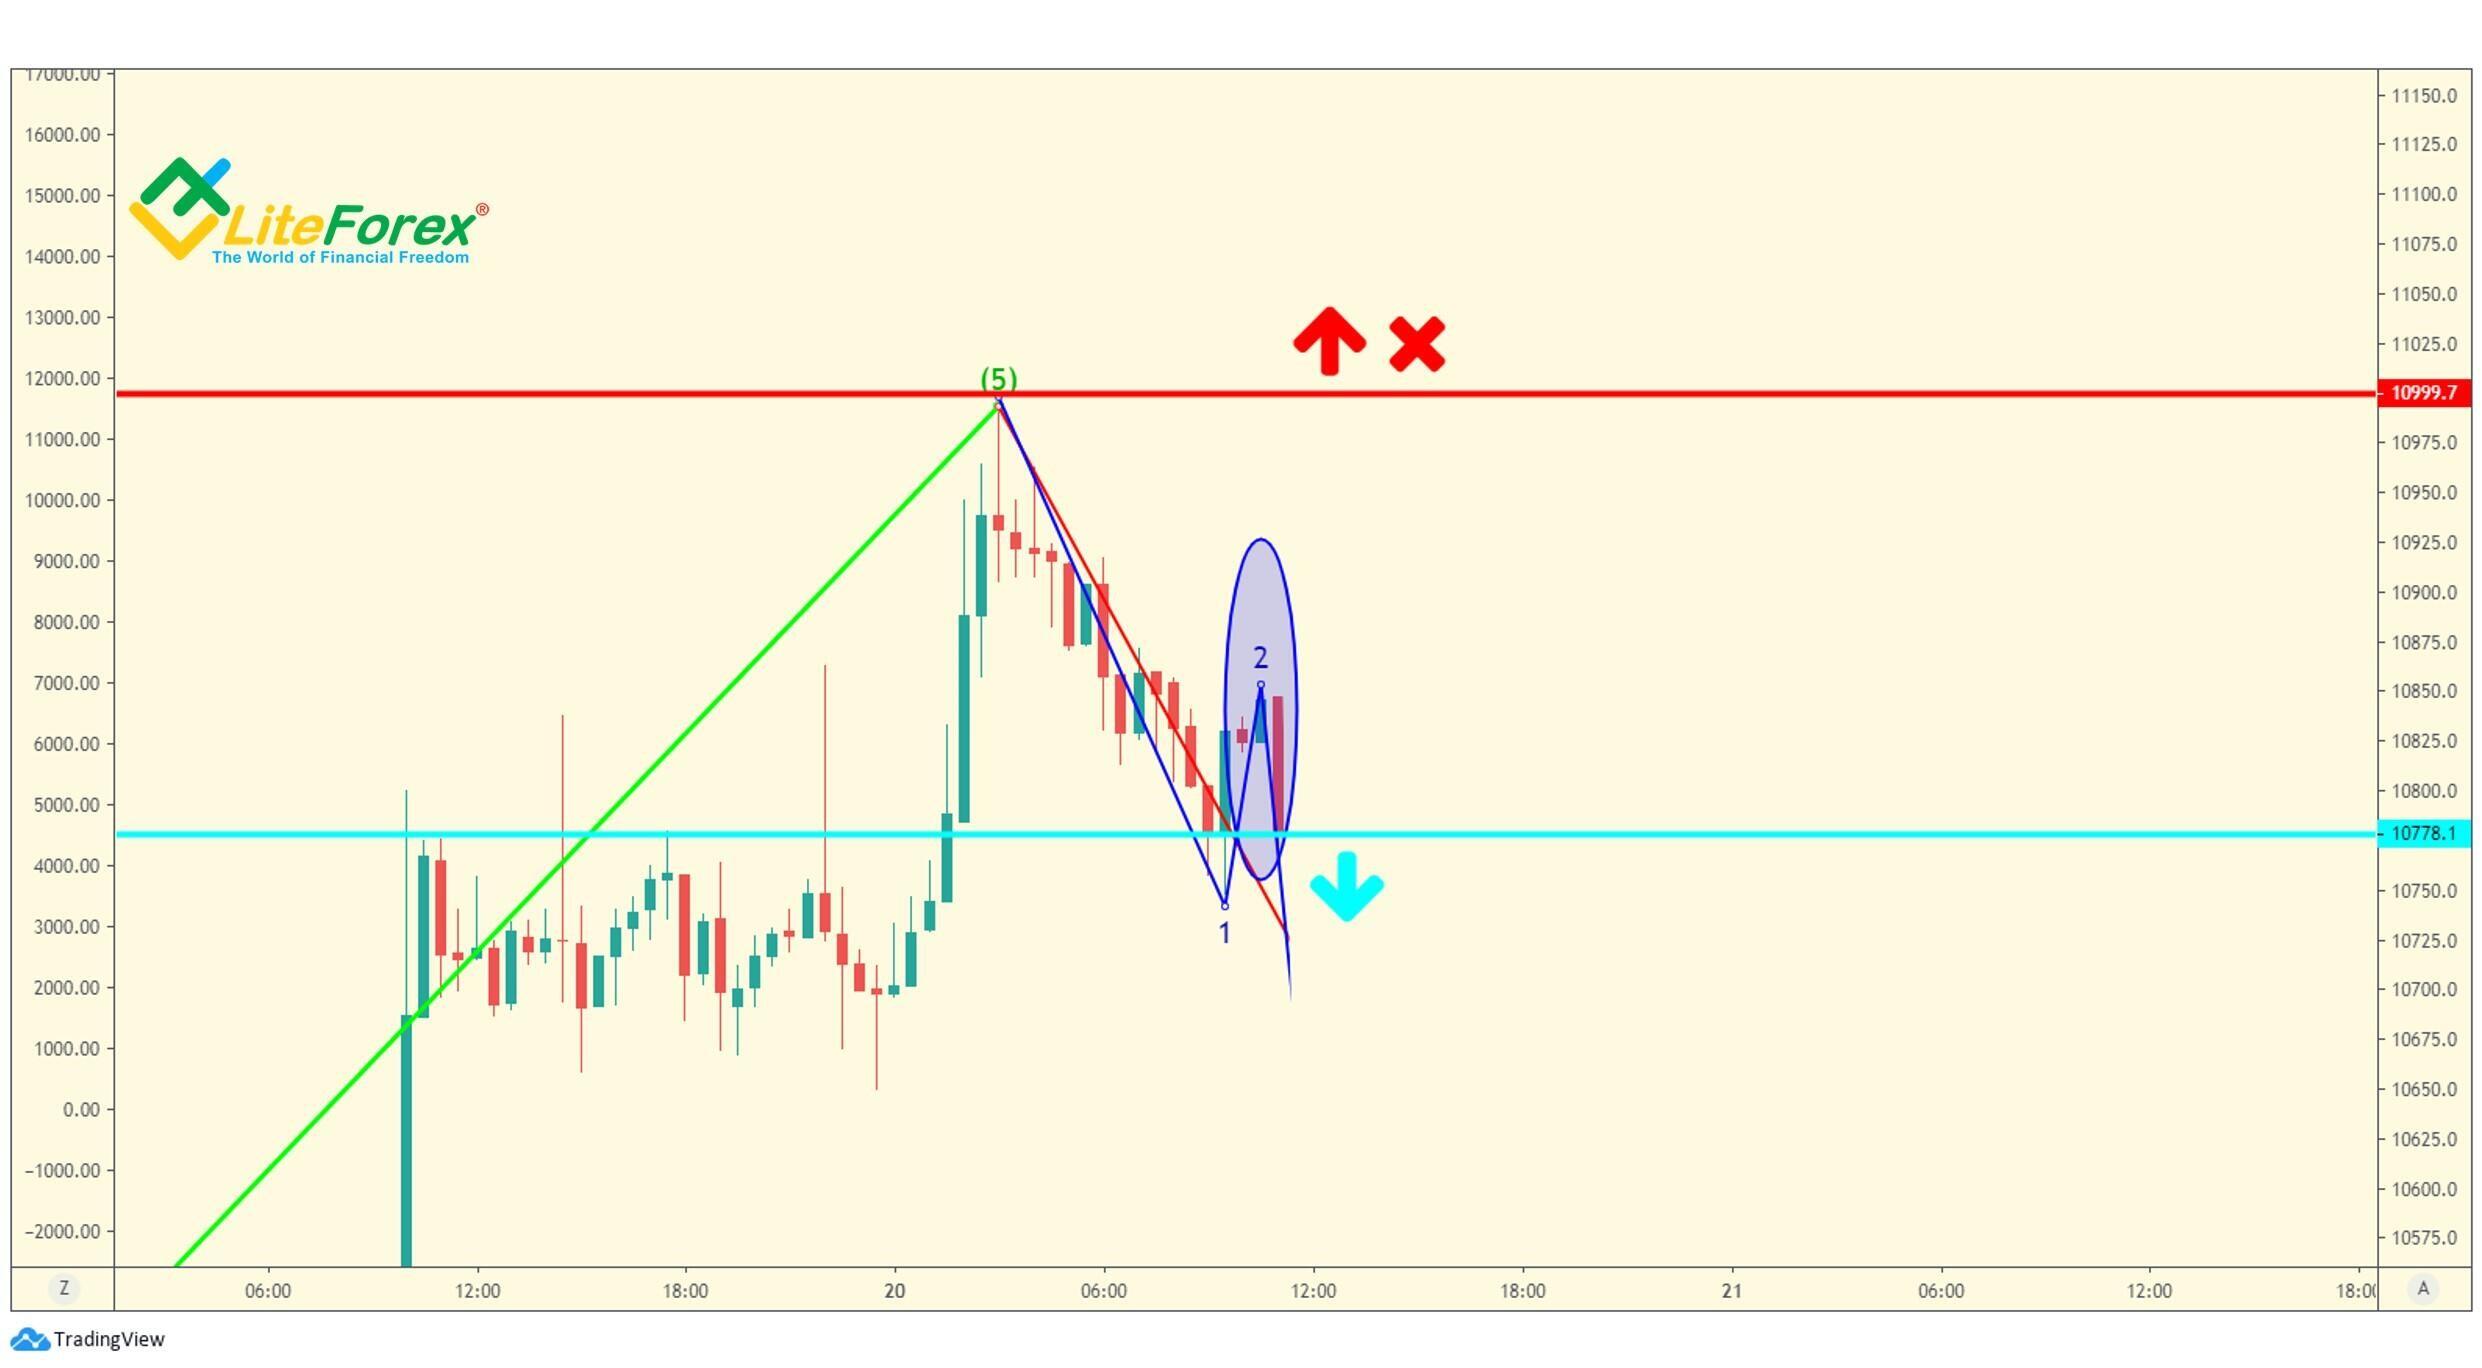
Although, we do not enter any BTCUSD trades, according to the current trading strategy, if you have any open positions, the starting point of the third wave will be the stop-loss level for those positions. According to the rules, described by both Prechter and Williams, the fourth wave fails to run beyond the level where the third wave started. Otherwise, this is not a five-wave pattern, but some other formation. Therefore, the only right trading decision, in this case, will be exiting all the trades.
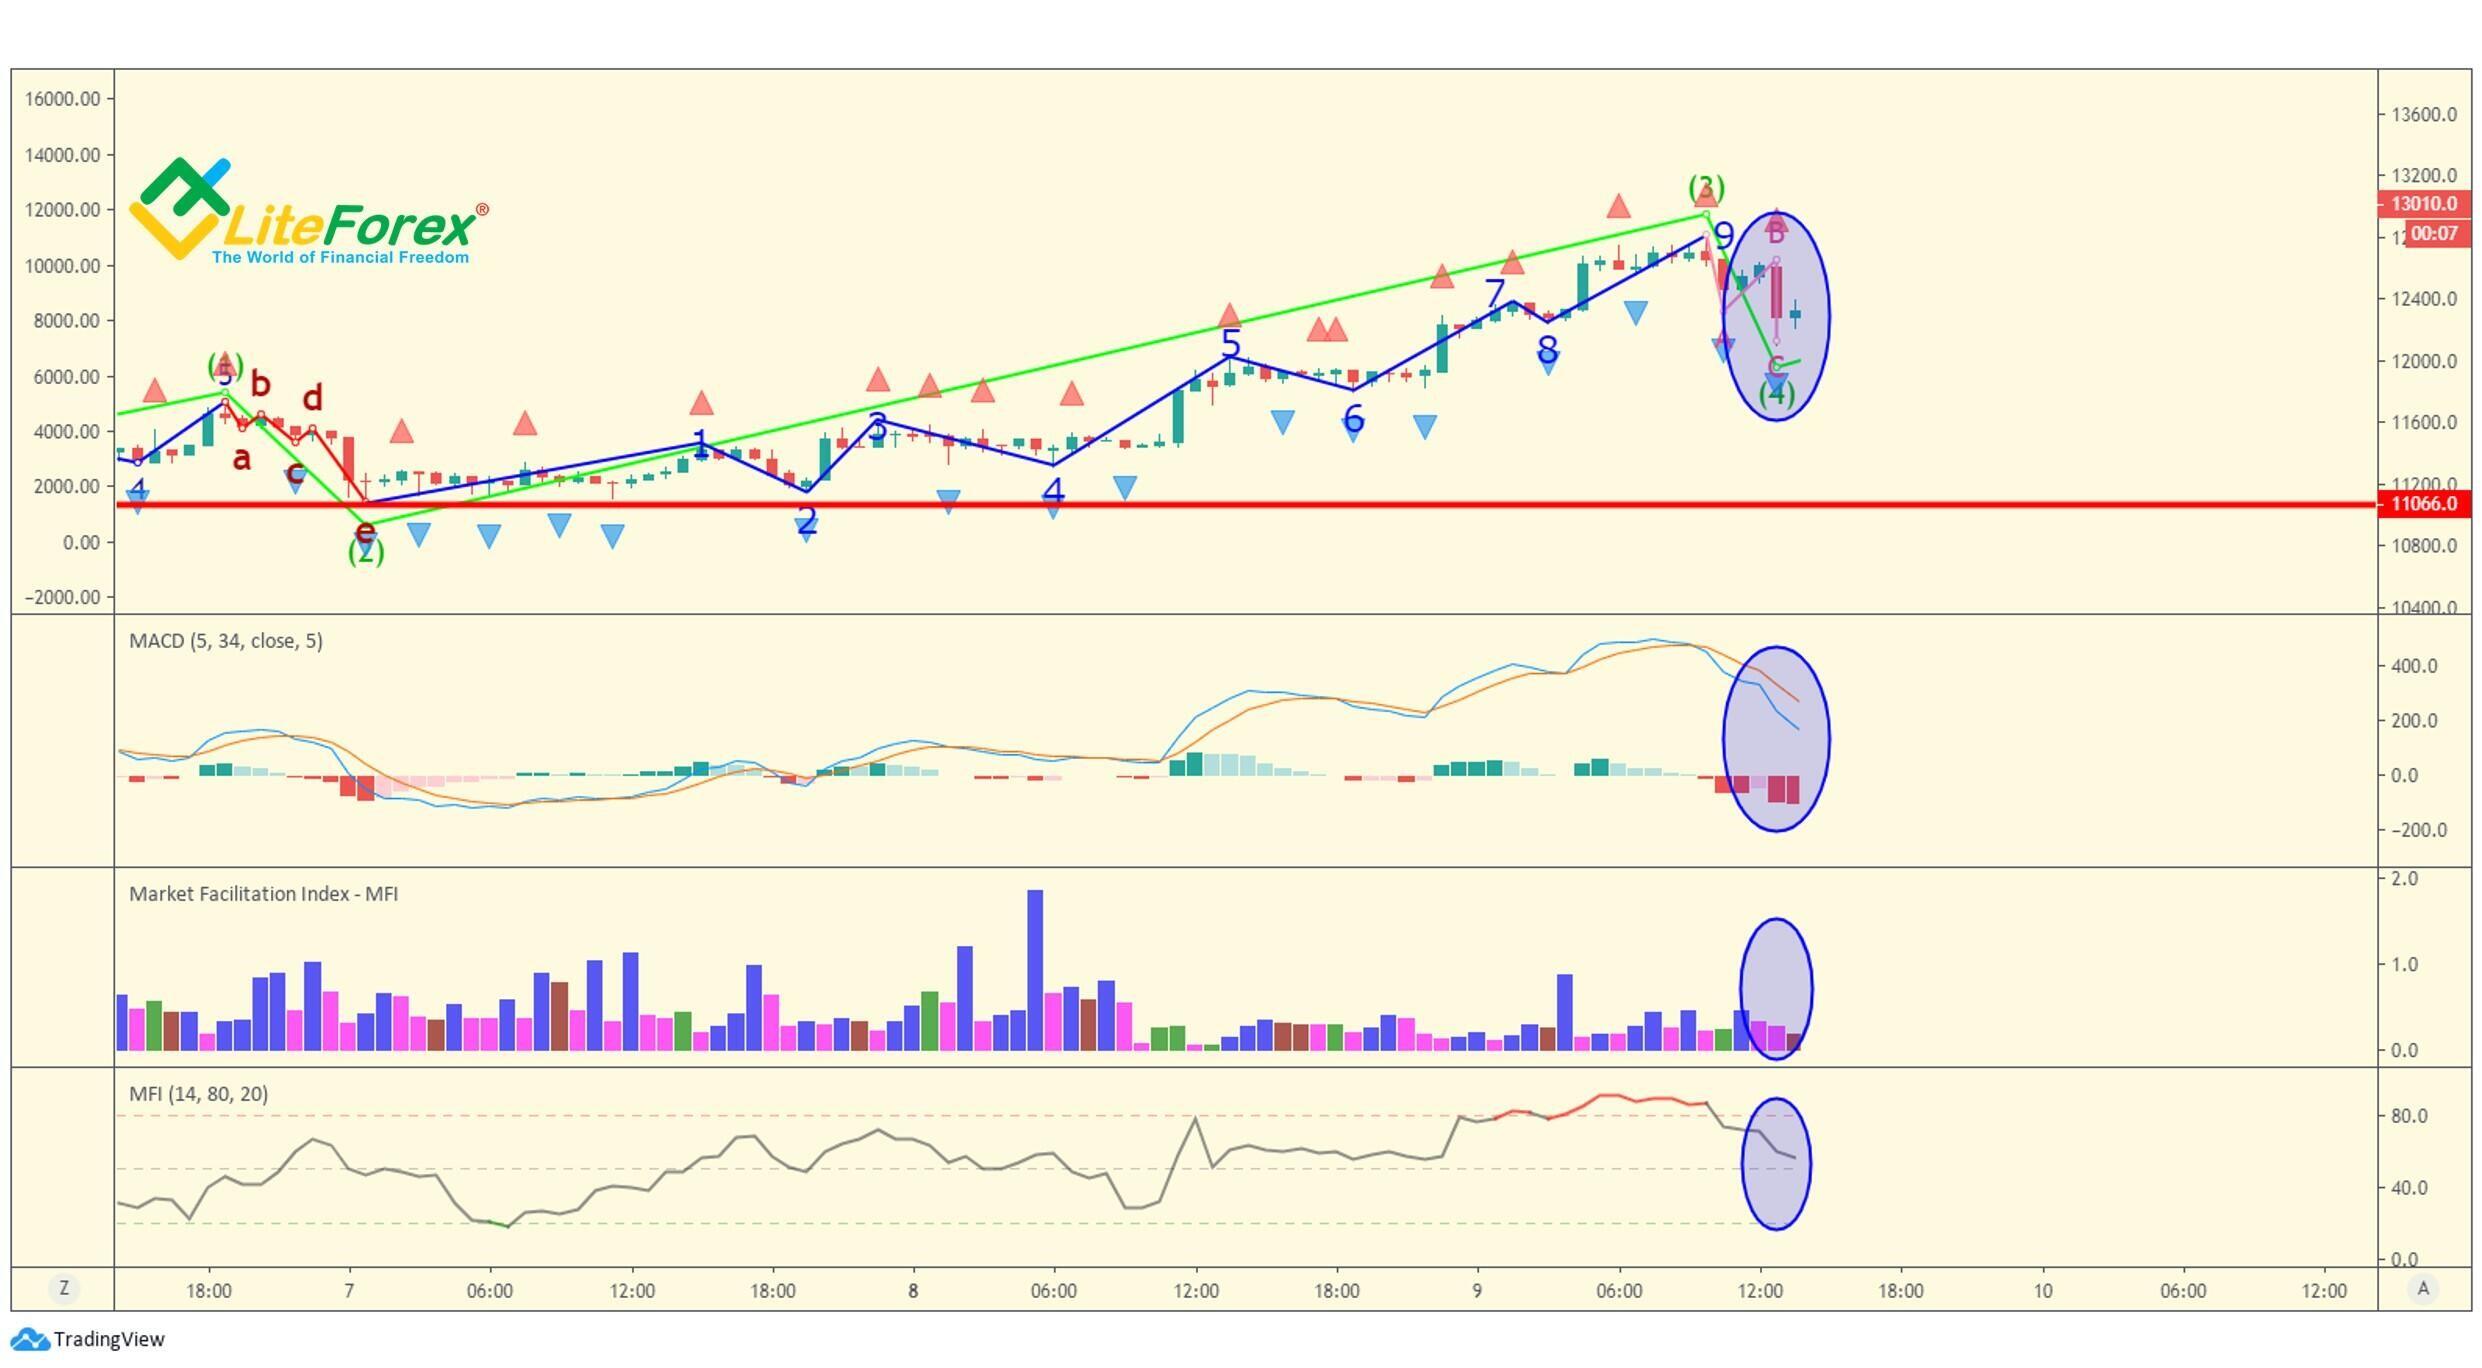
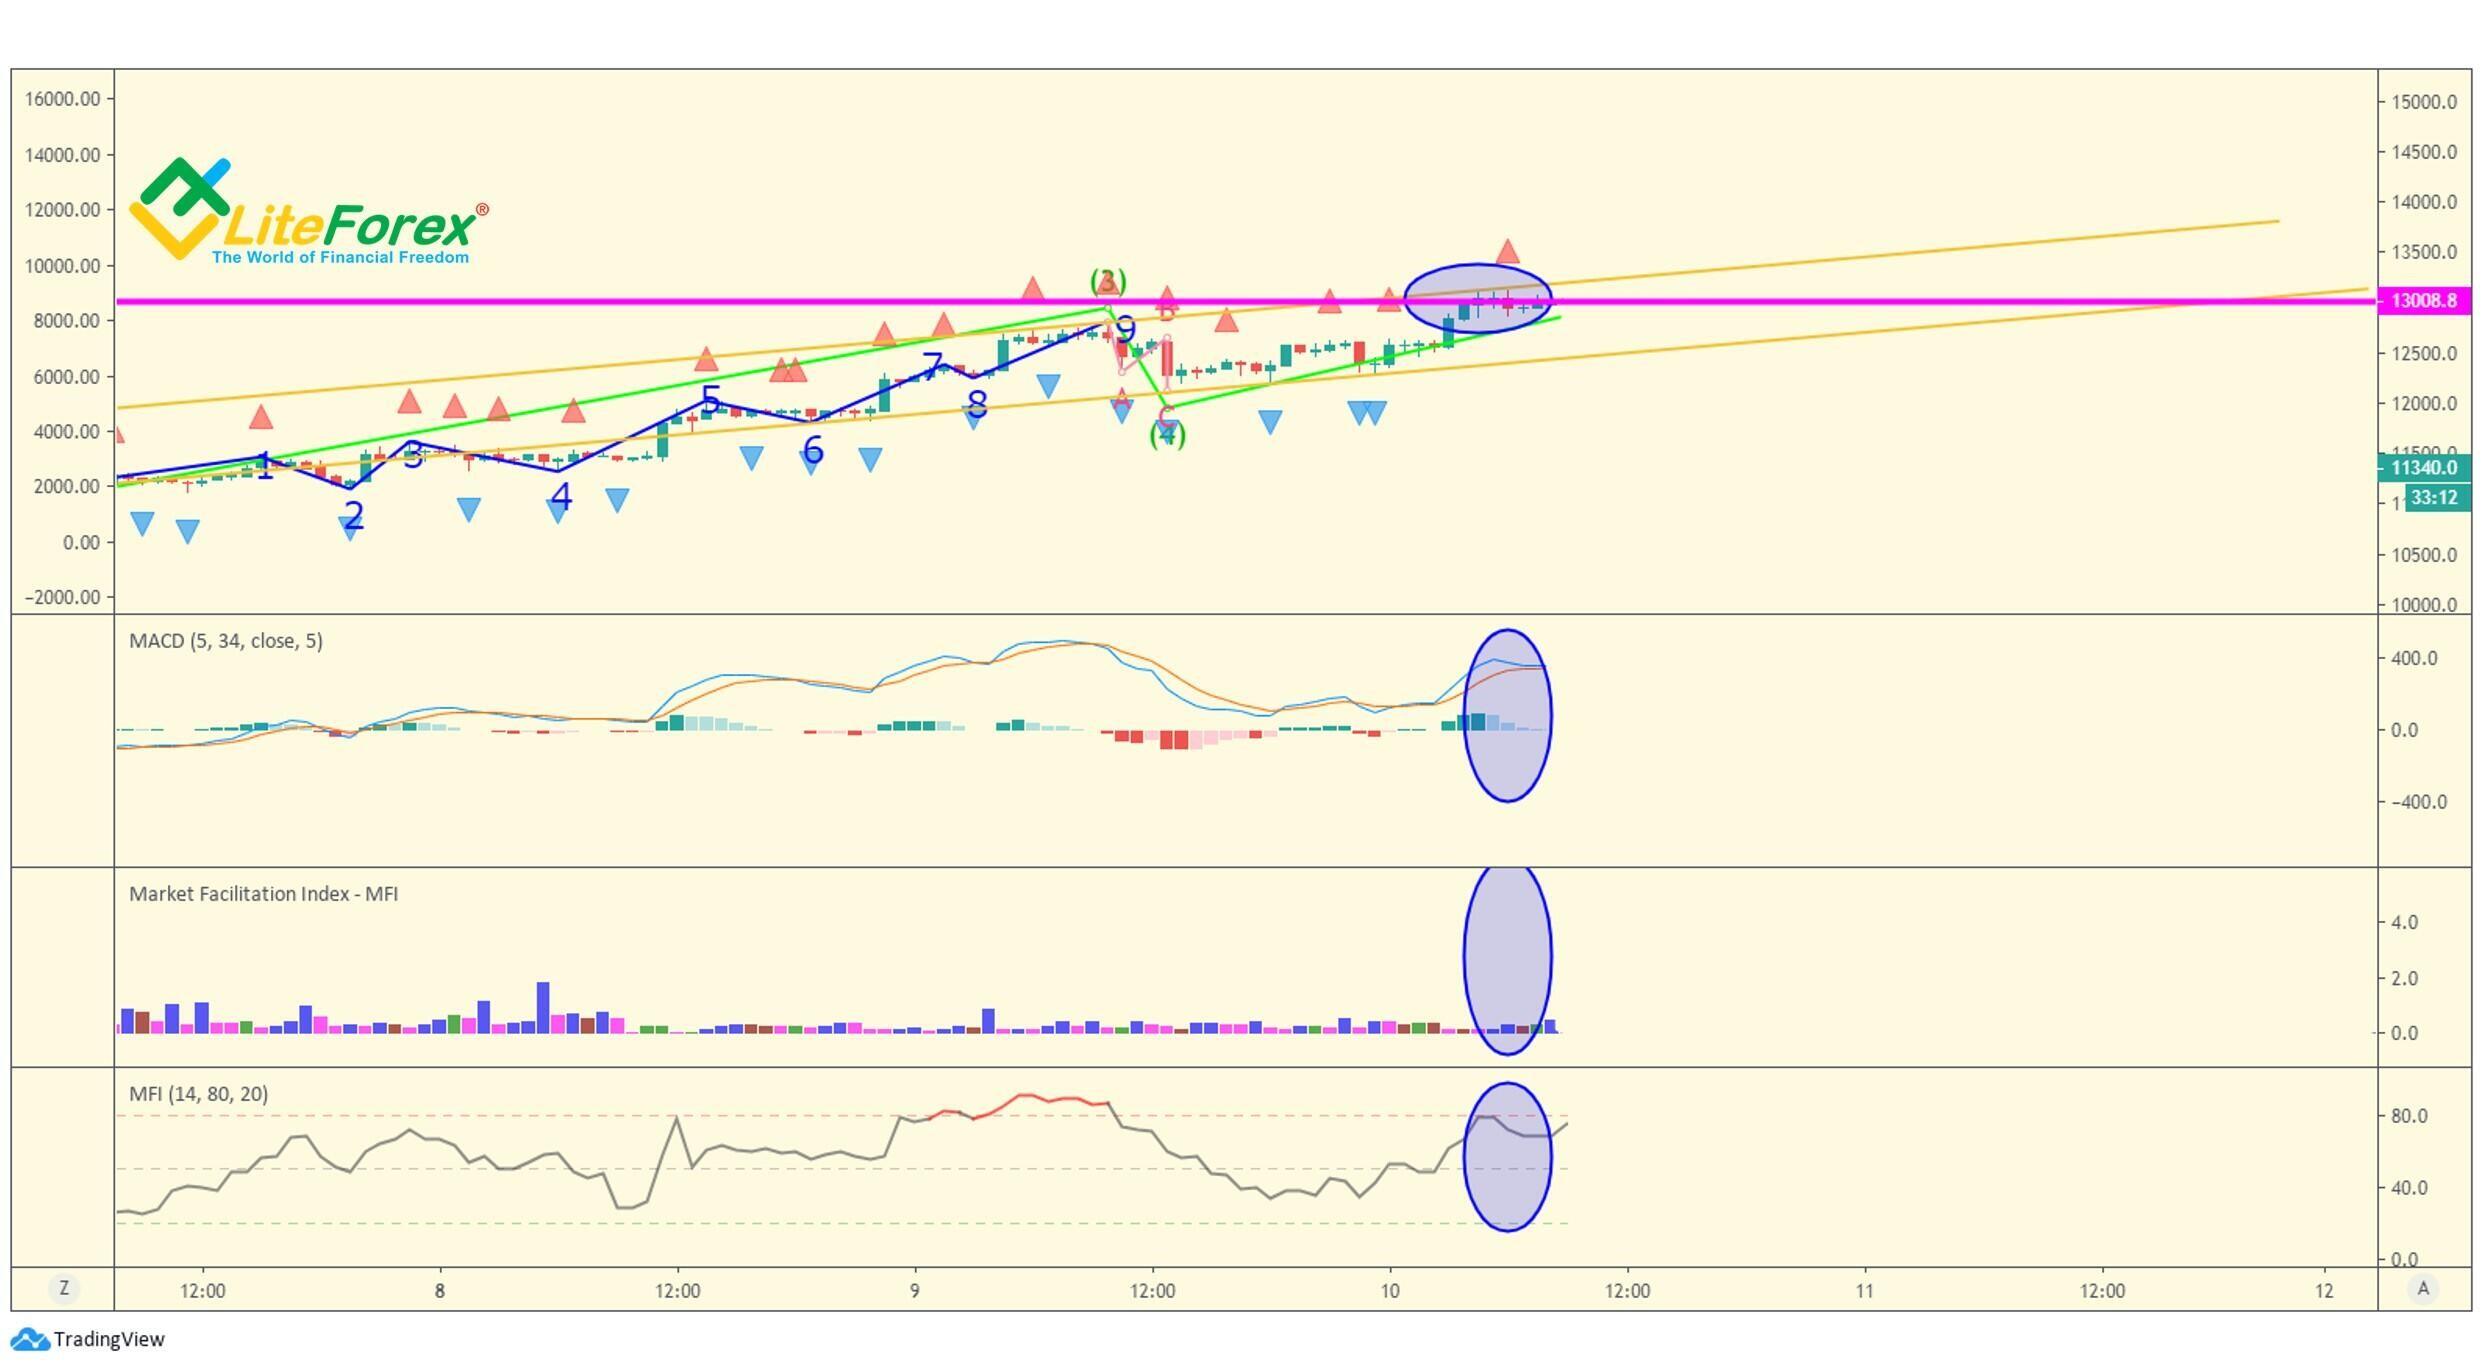
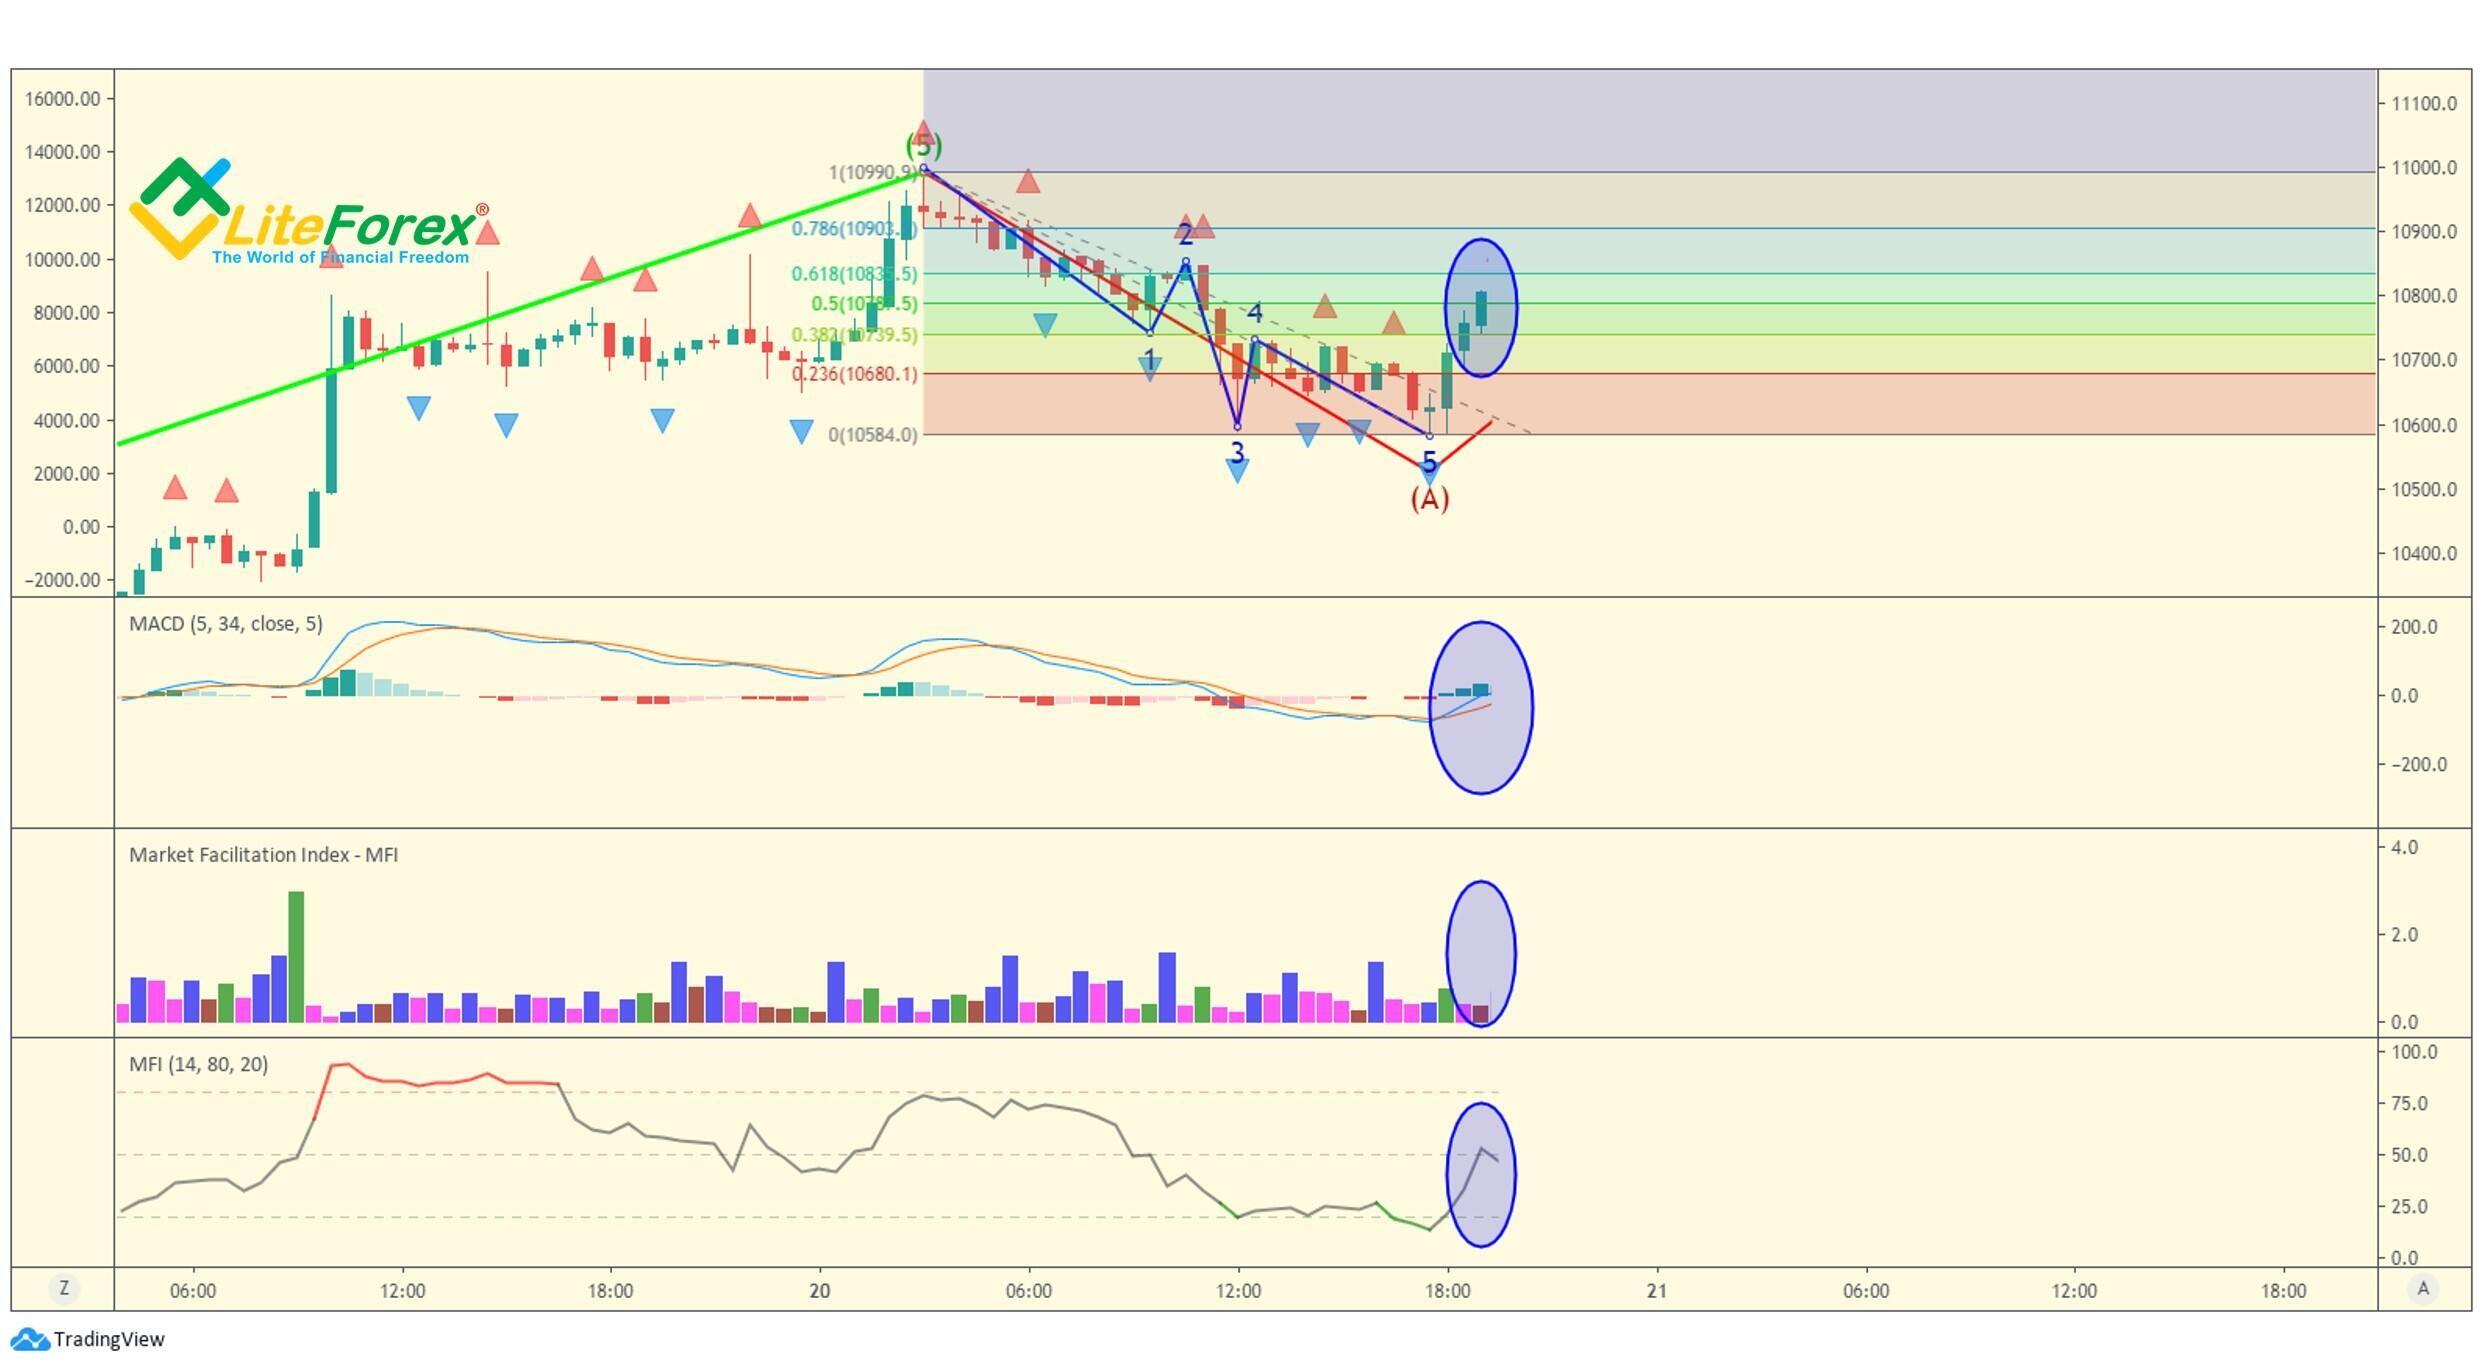
The necessary conditions for wave 4 are met when the histogram of MACD 5/34 goes below a zero level, which is seen in the indicator chart (marked with the blue oval). This condition must be fulfilled if we expect the trend reversal.
The next, more prominent reversal signal appears when there are at least two down fractals, and the latter one is the expected pivot point. At this point, we analyze the signals sent by the Market Facilitation Index. Here, at least one of the three lowest bars must be squatting. In our case, there are two pink bars, i.e. squatting bars. The next bar is brown (withering), it signals that the traders lose their interest in the market amid the continuous fall. Nonetheless, the classical MFI may fail in the case of short fourth waves, like in our example.
To verify the forecast, let us check if the length of the fourth wave corresponds to the 38.2%–50% ratio of the third wave, identified by Prechter.
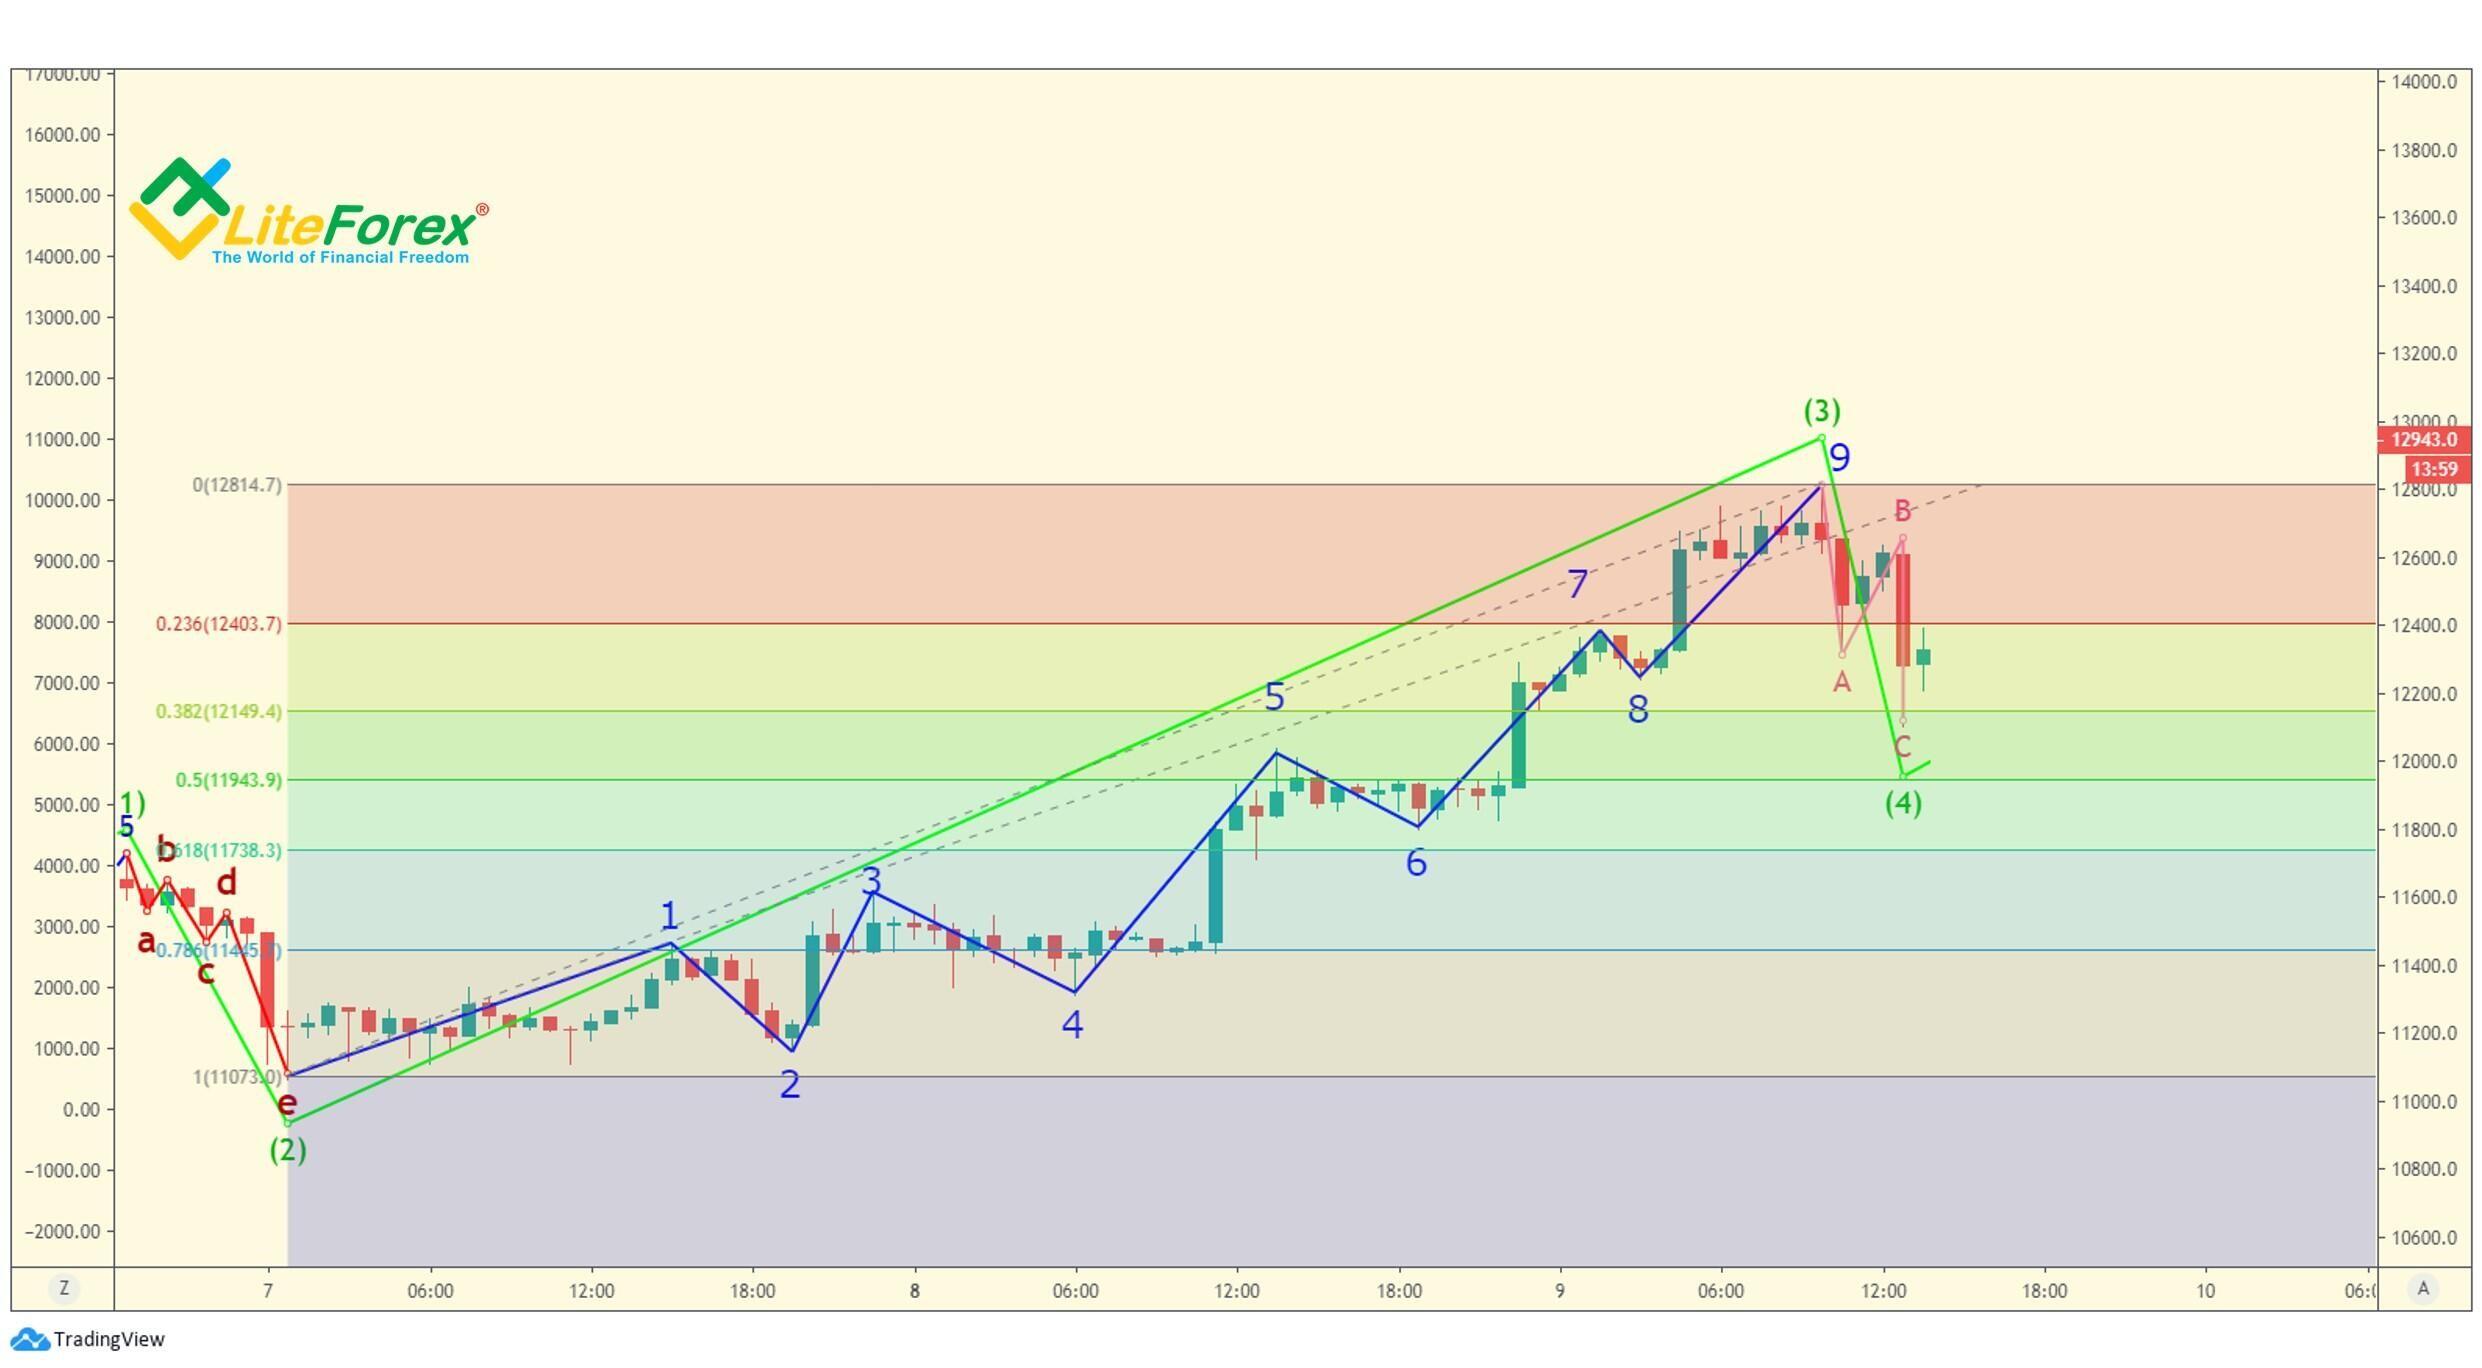
As you see from the BTCUSD chart, the expected pivot point is in the green zone, which is in the range of 0.382- 0.5.
Another good tool is the channeling technique. They are not always accurate relative to the fourth wave. Nonetheless, channels can well be used as a supplementary tool to validate the trend pivot point.
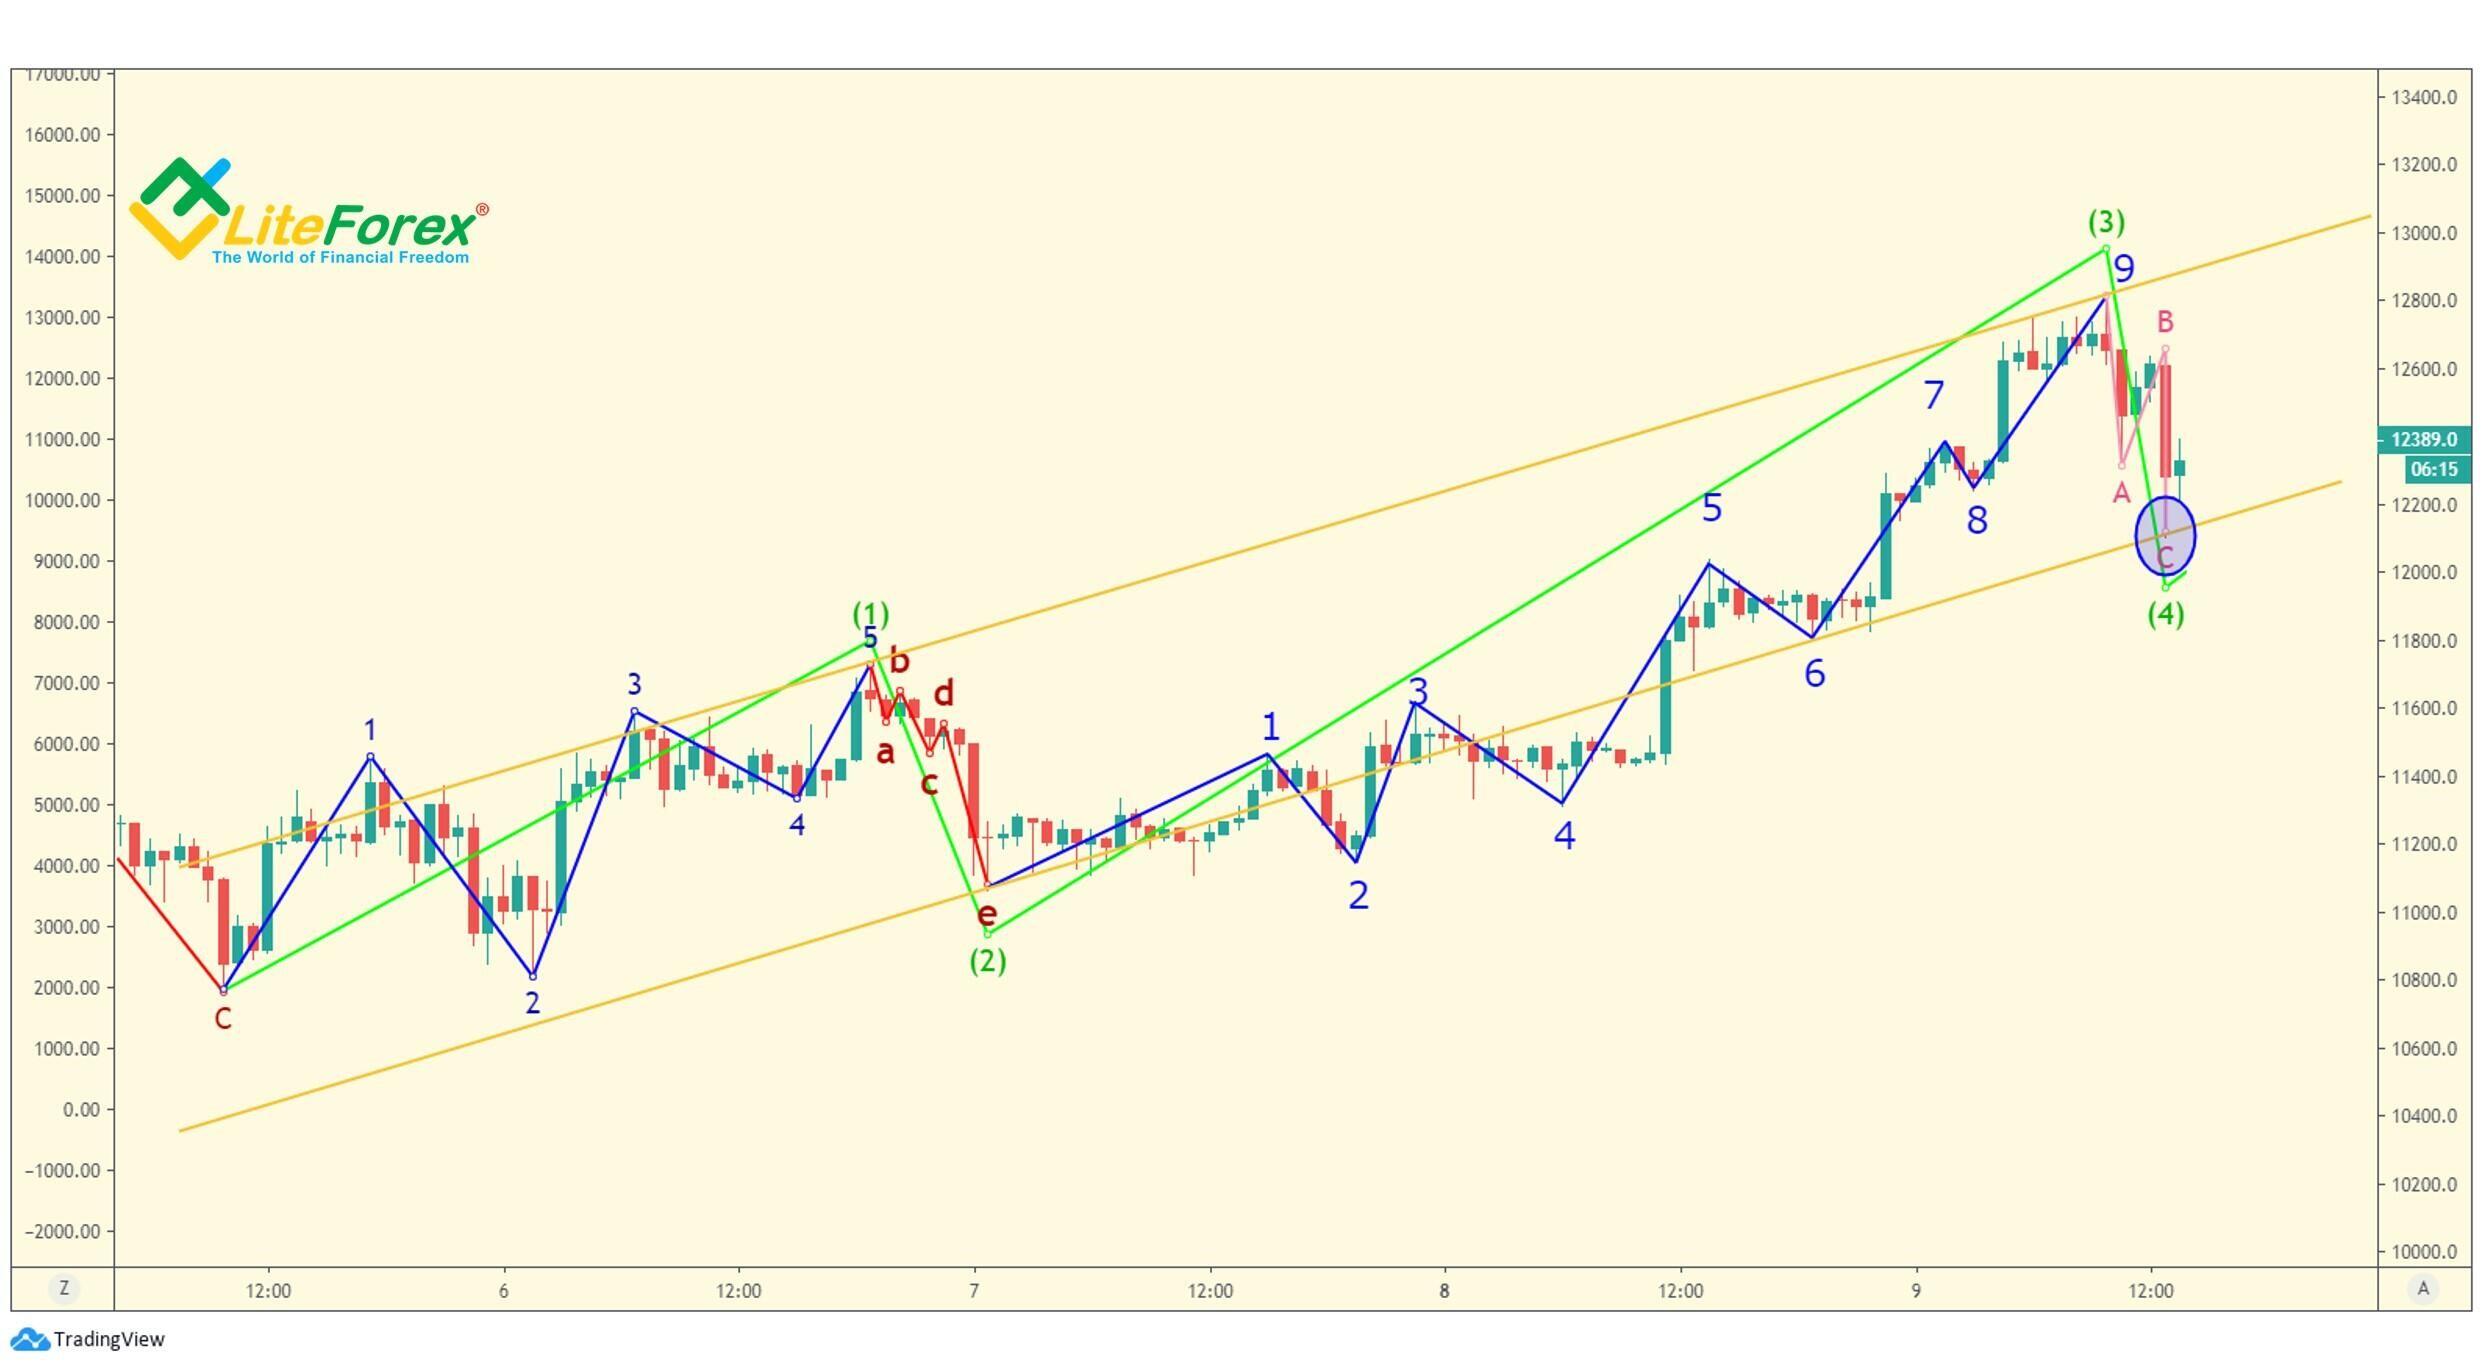
To build the channel, the yellow line connects the tops of the first and the third waves. Next, we draw a parallel line that touches the ending point of the second wave. In our chart, the expected end of wave (4) accurately falls on the lower border of the trend channel marked with the yellow line (the end of the fourth wave is marked with the blue circle). It provides a confirming signal that the forecast is correct. It also allows us to use this channel to predict the end of the fifth wave without any changes.
Wave 5
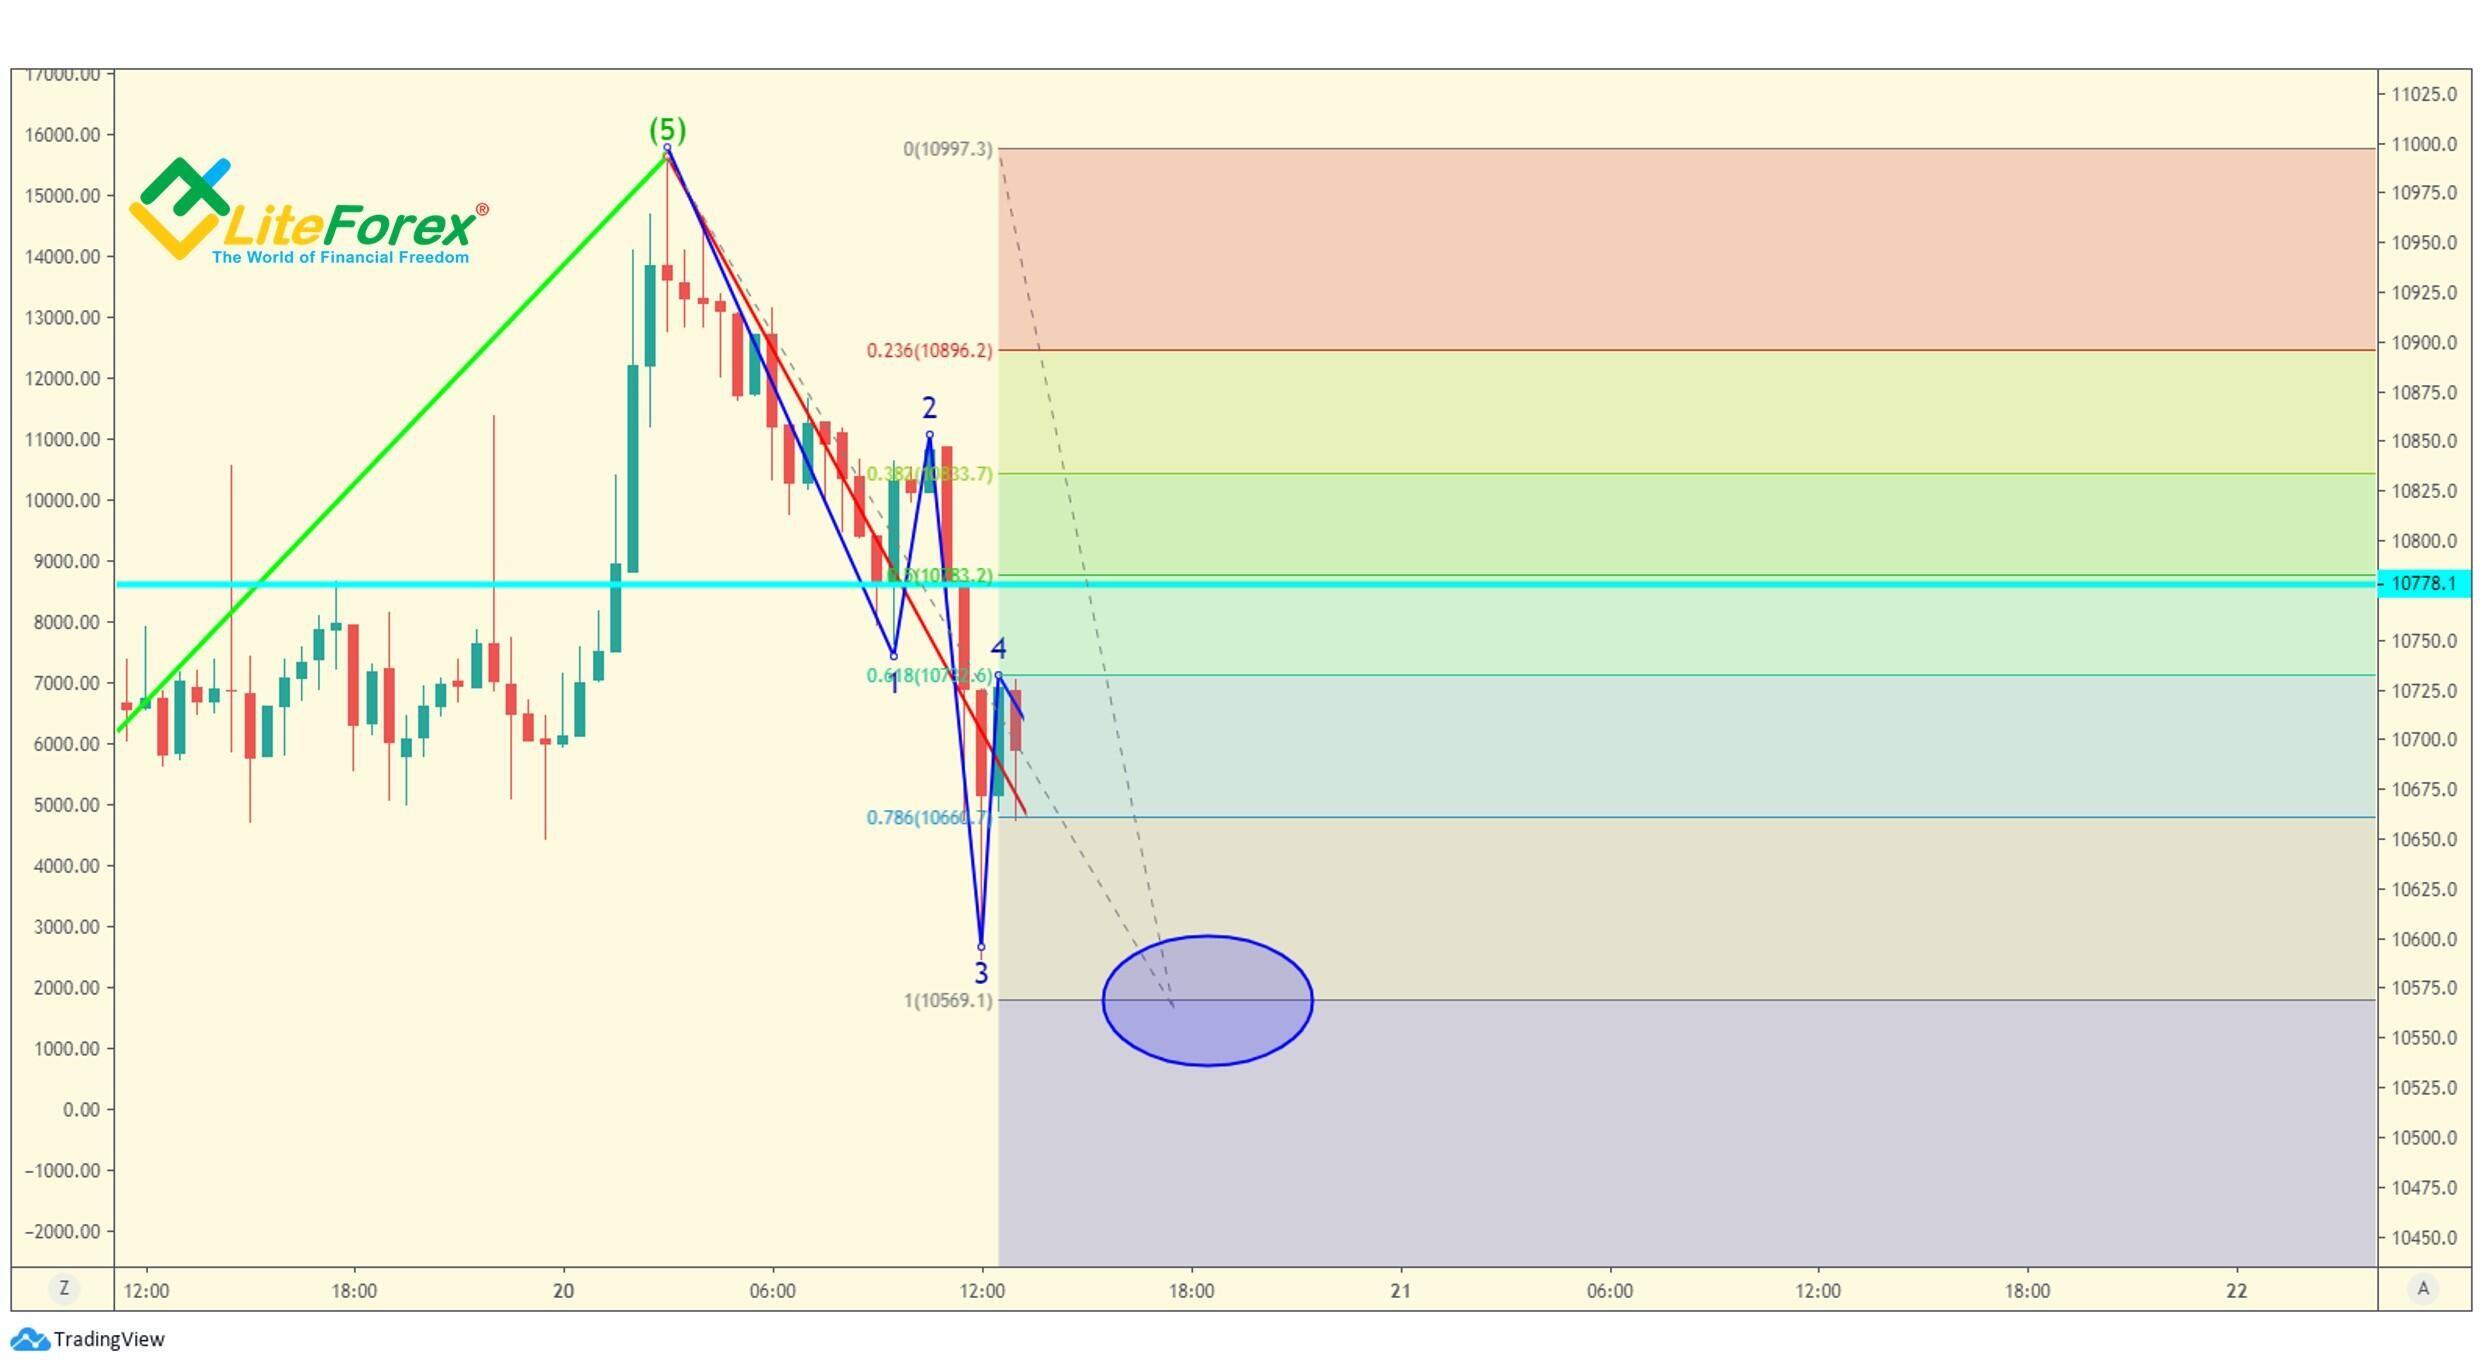
Having found the end of the fourth wave and, accordingly, the beginning of the fifth wave, we can decide on the number of orders to place. Williams suggests referring to the relations between wave (3) and wave (1). If the third wave is longer than the first by 1.618 times or more, it is extended, and so, the fifth wave will be short compared to the third wave. These rules are confirmed by the alternation rule described by Robert Prechter. In this case, we add another three orders to the first three trades held since the third wave, the total position now includes six orders.
If the third wave is shorter than 161.8% of the first wave, and the first wave has irregular structure, the fifth wave is likely to be extended. SI, according to this strategy, we enter another five trades, and the total position is now eight orders.
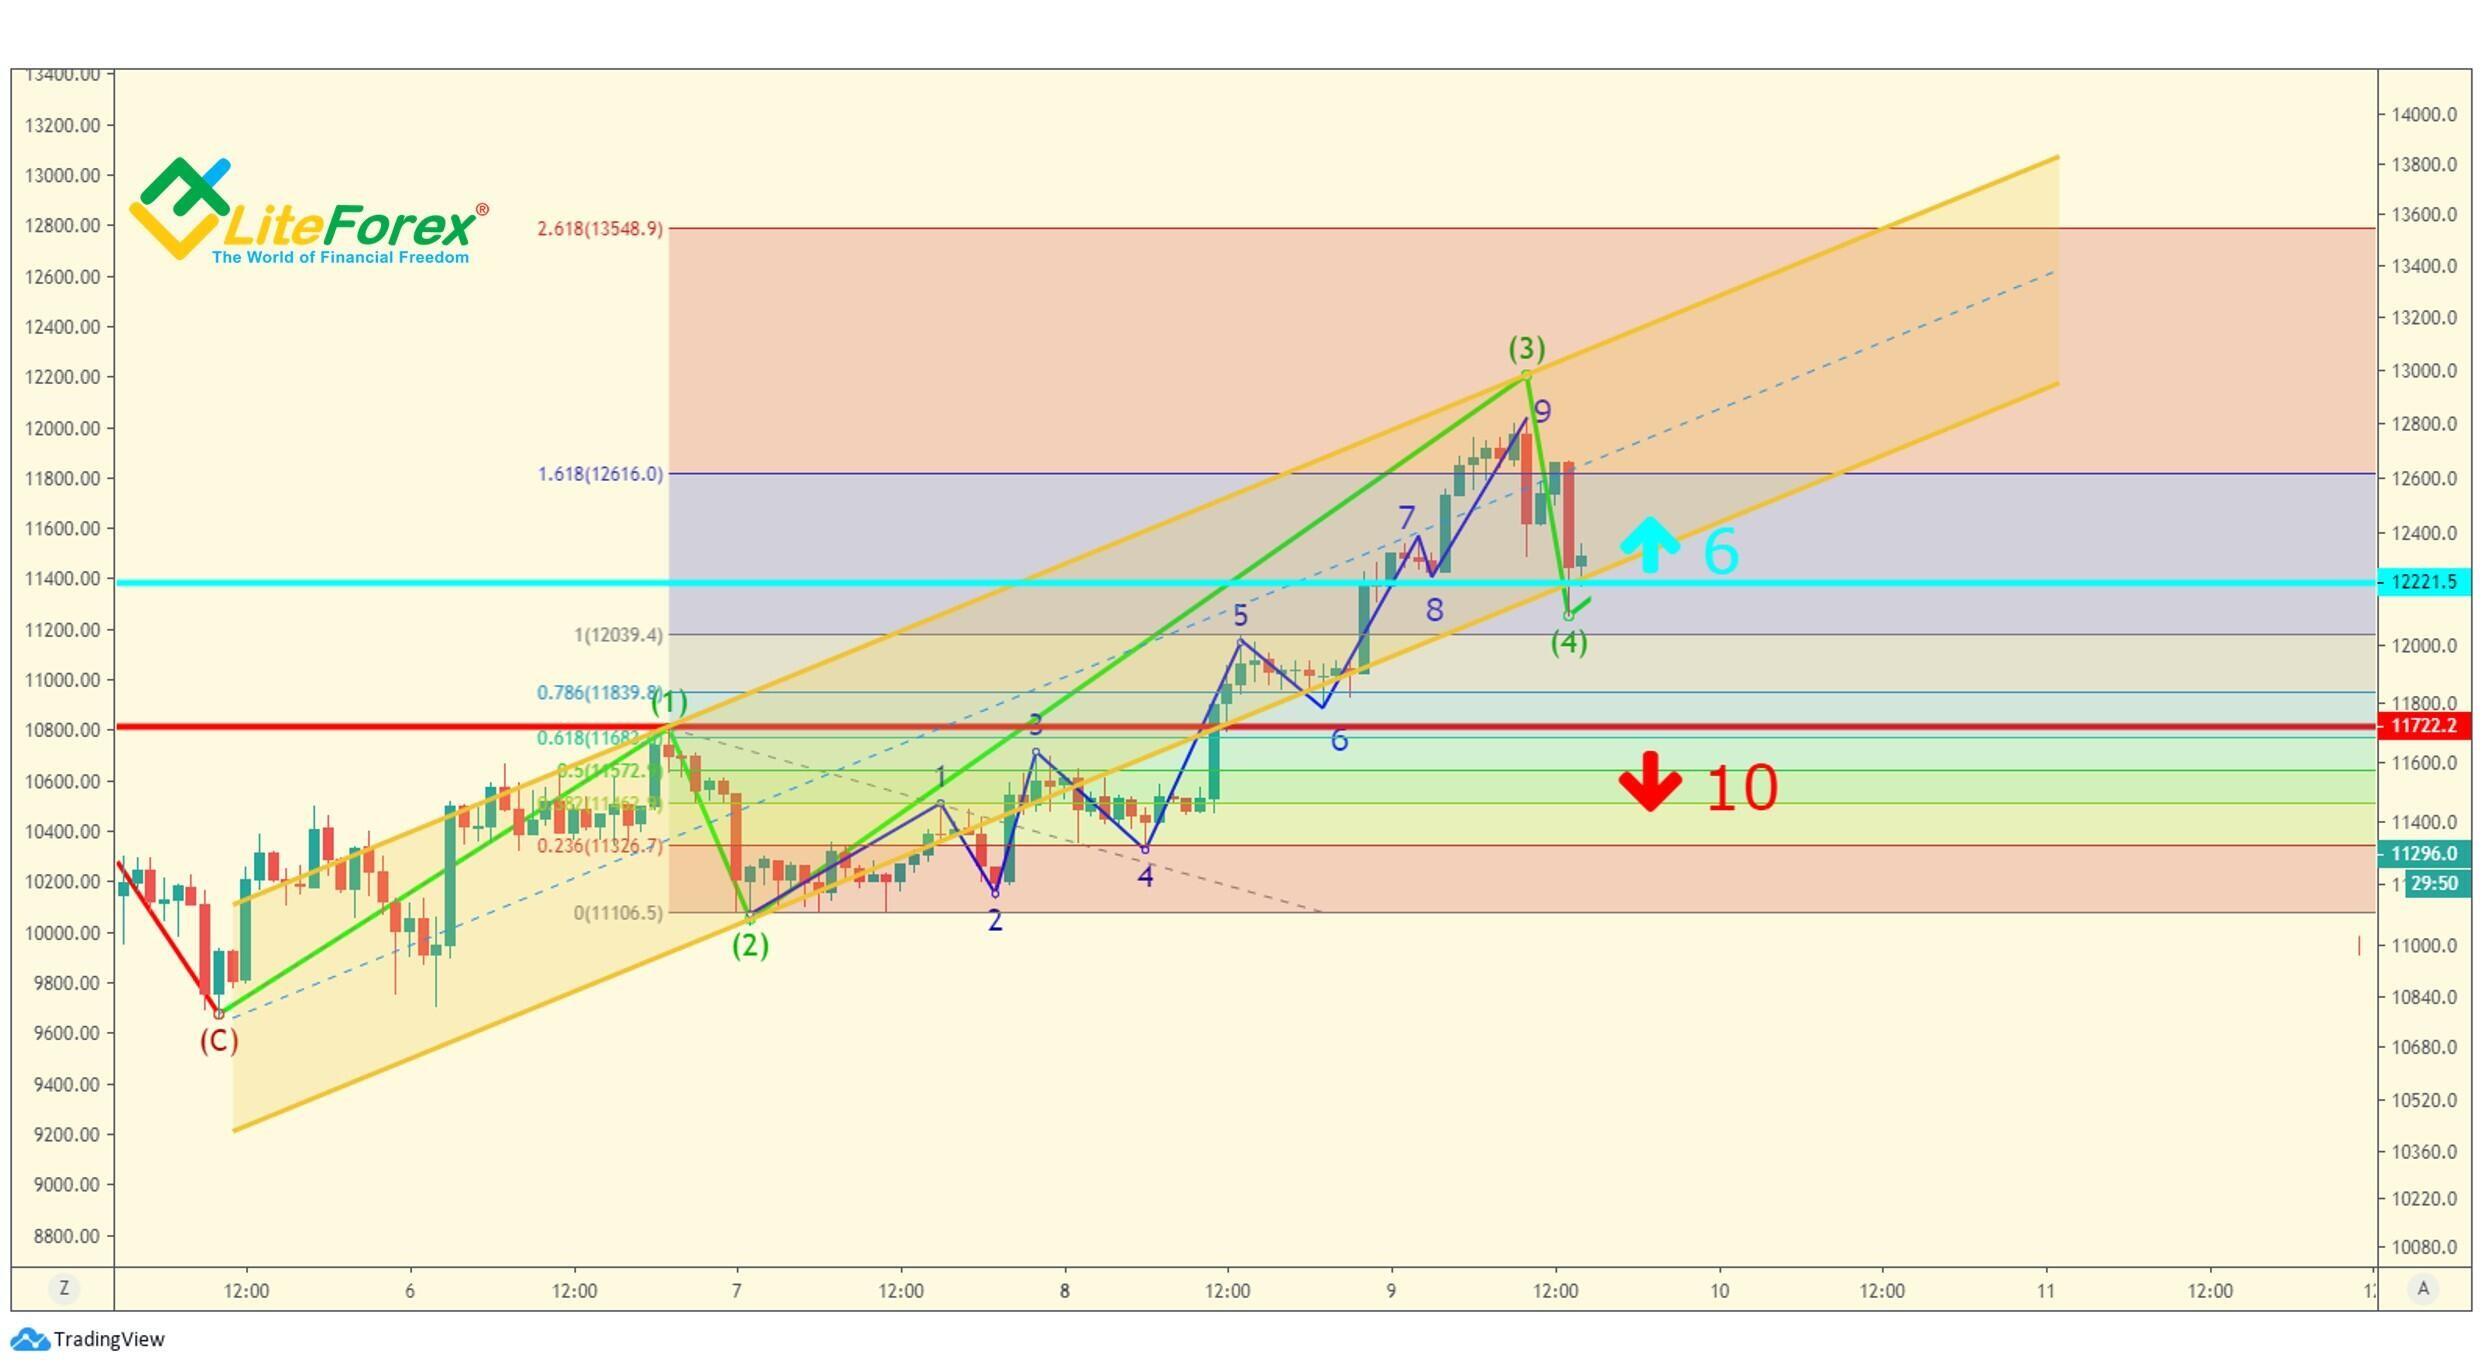
As you see from the BTCUSD chart, the top of the third wave of Primary degree is in the red zone, exceeding the first wave by more than 1.618 times. Therefore, we put three orders and get the position of six orders (the turquoise horizontal line in the chart). To balance these trades, we set 10 pending orders to sell at the level of the first wave’s top (the red line in the chart). When these orders are activated, the long trades must be closed, as the current interpretation will be wrong in this case.
If the price breaks through this level, there will be violated the fundamental rule, according to which the low of the fourth wave must be higher than the top of the first one. If so, we won’t know what the market structure is. Therefore, the best solution will be entering the sufficient number of short trades to make a profit from any down move and exit long trades without any losses.
The point where we make sure that the fifth wave has started is at 61.8% of the fourth wave’s length (the blue circle in the chart). If the market continues retracing and runs beyond this point, the price will hardly drop sharply. So, we can forget about stop-losses and move on to the next task and identify the current targets.
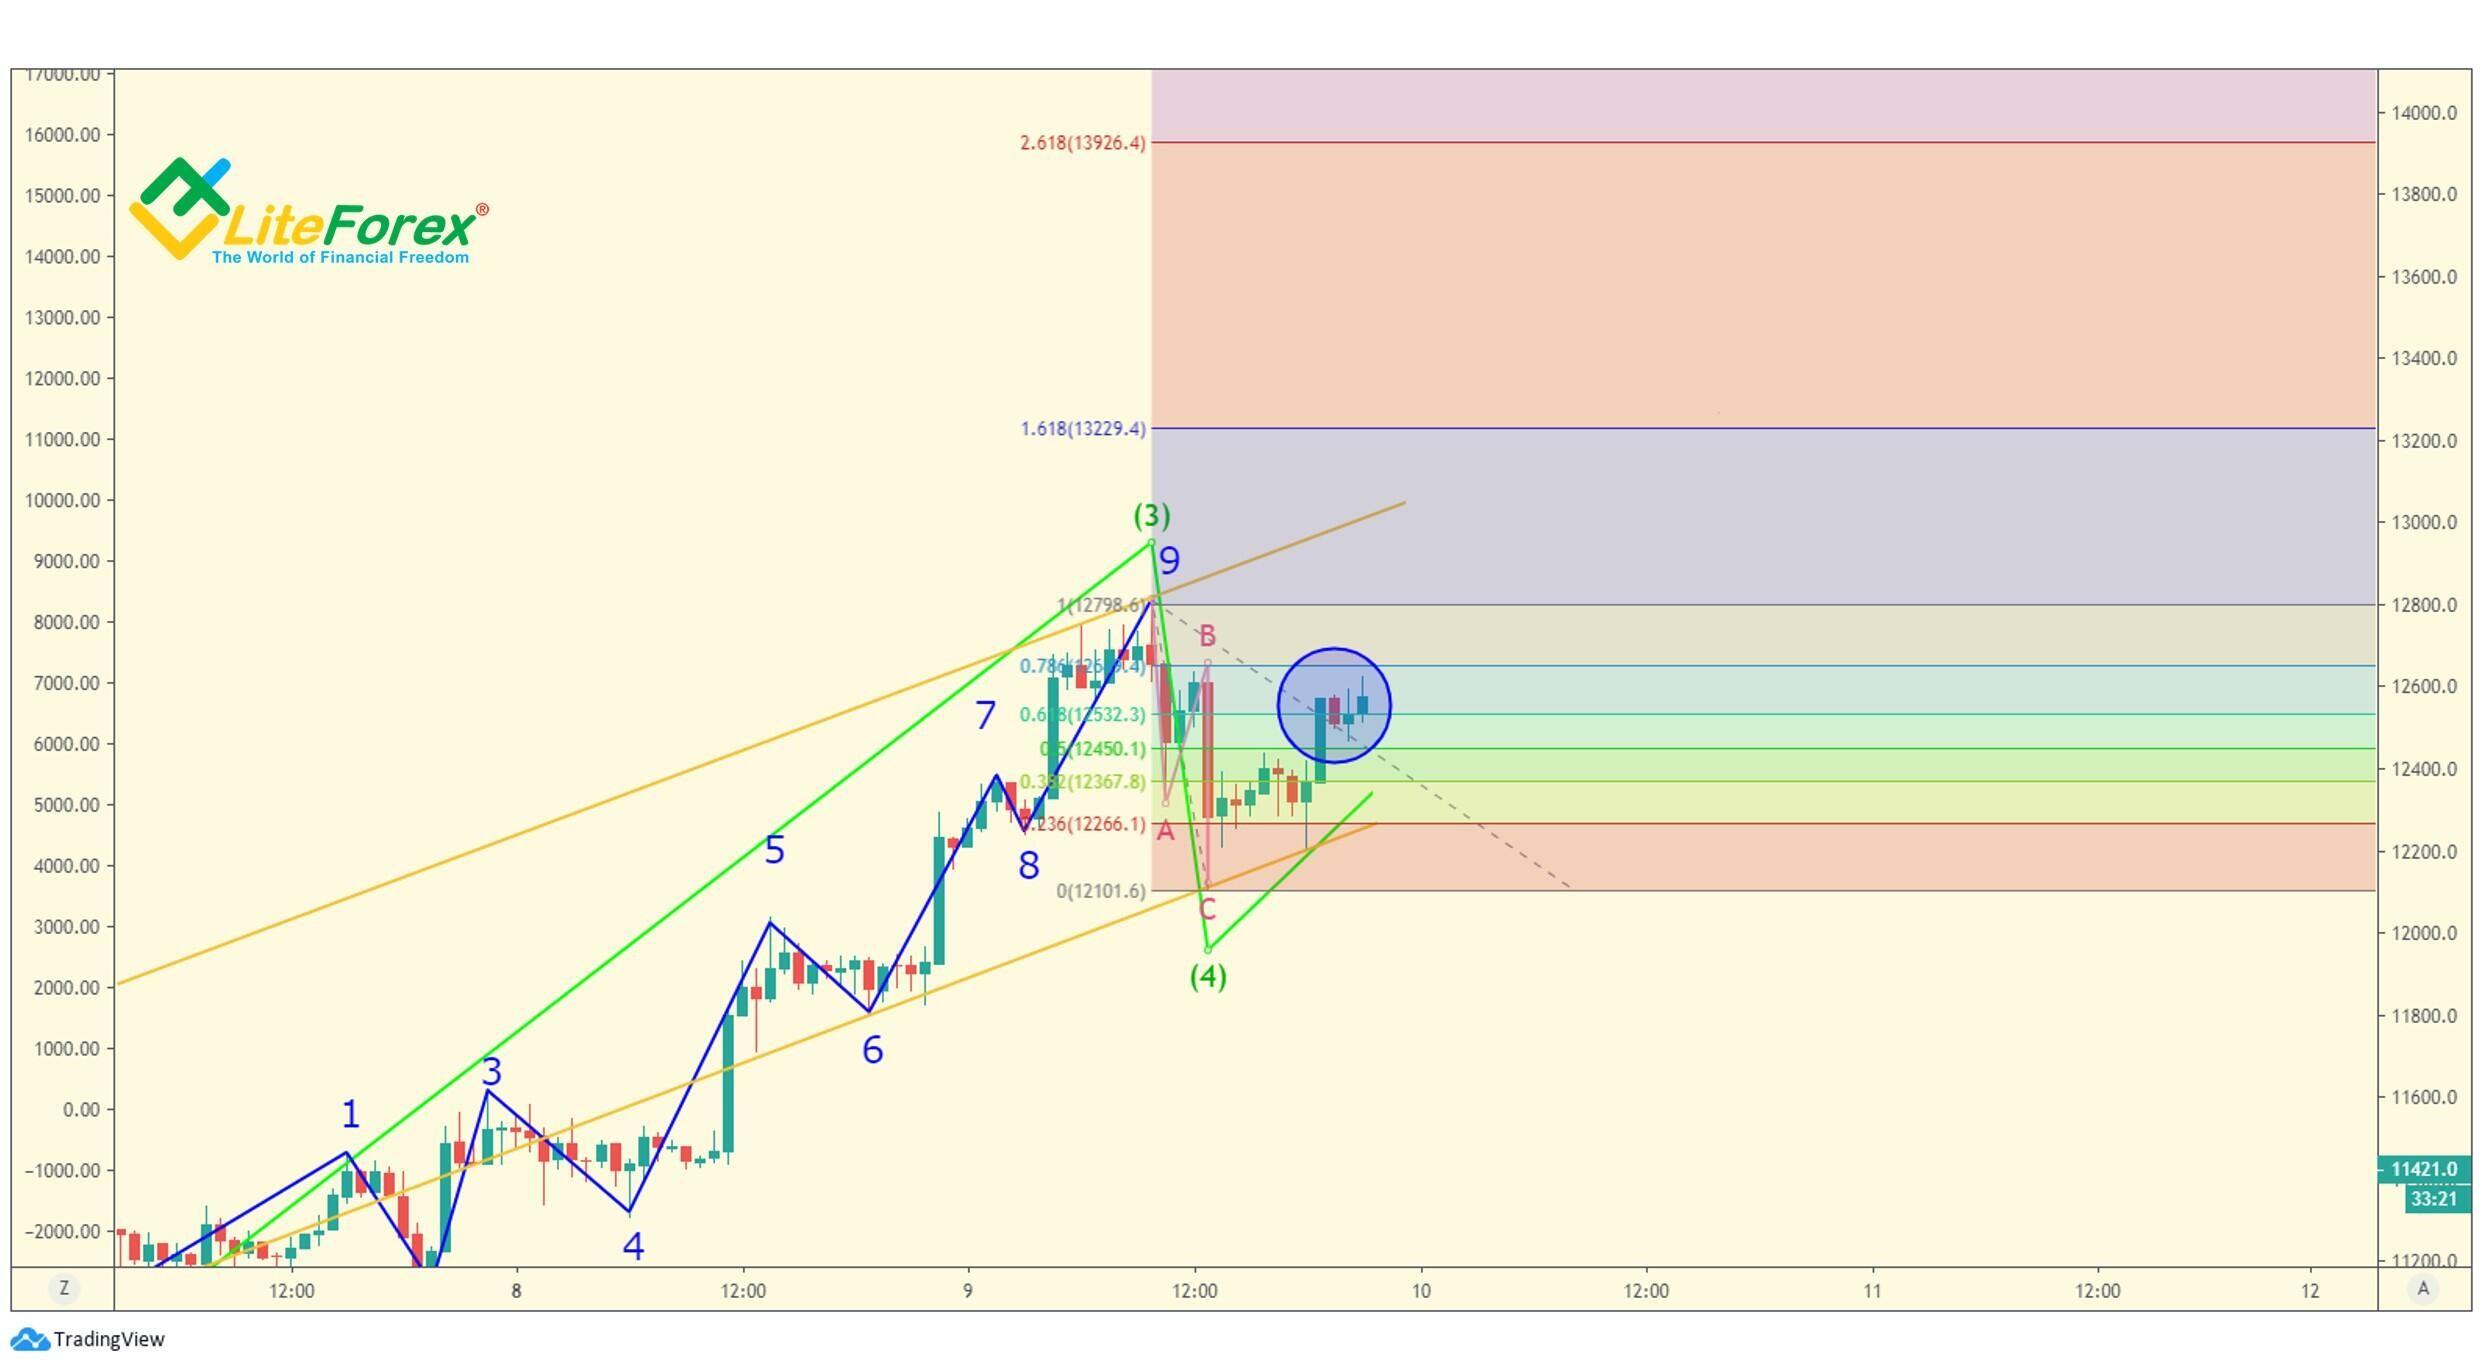
You remember that the channel built according to the tops of the first, second and third waves almost perfectly matches the end of the fourth wave. It should accurately determine the expected area where wave (5) should finish. It is also supported by the fact that the third wave should be extended, as the fifth wave should be normal, and so, there should not be overthrows (breakouts of the channel borders). According to the chart, wave (5) should finish in the price zone of 13000 –13500 points (green zone).
Now, let us try to identify the target zone using wave relations. According to Prechter’s theory, the distance between the start of the first wave and the end of the fourth wave, if the third wave is extended, is 61.8% of the entire formation. I placed the Fibonacci grid in such a way that level 0.618 corresponds to the low of the final bar in wave (4). Accordingly, around the conditional units, there must be the end of the fifth wave. I set the target a little higher than 13000, which corresponds to the conditional unit of the Fibonacci grid and is inside the range identified by visual analysis of the wave channel. I marked the expected target with the horizontal pink line.
When the price is approaching the horizontal pink line we verify the target point by Williams’s five bullets. The first such approximation is marked on the chart by a blue area, and in this case, the price came close to the boundary of the wave channel.
It looks like a perfect pivot point, but the readings of the indicators are contradictory. First, the upward fractal is smoothed (it is not clear). Next, instead of a sharp down move typical for the strong wave corrections, there is a kind of a sideways movement.
Other indicators also add doubts. MACD is in the green area, Market Facilitation Index displays two false bars (blue bars) and one withering bar (a brown bar), which can’t be interpreted as a reversal signal. MFI provides no information to the point. It doesn’t indicate the overbought area, and we can’t check the divergence as we can’t be sure about the wave structure (by the way, it is another evidence that the fifth wave hasn’t yet approached its termination point).
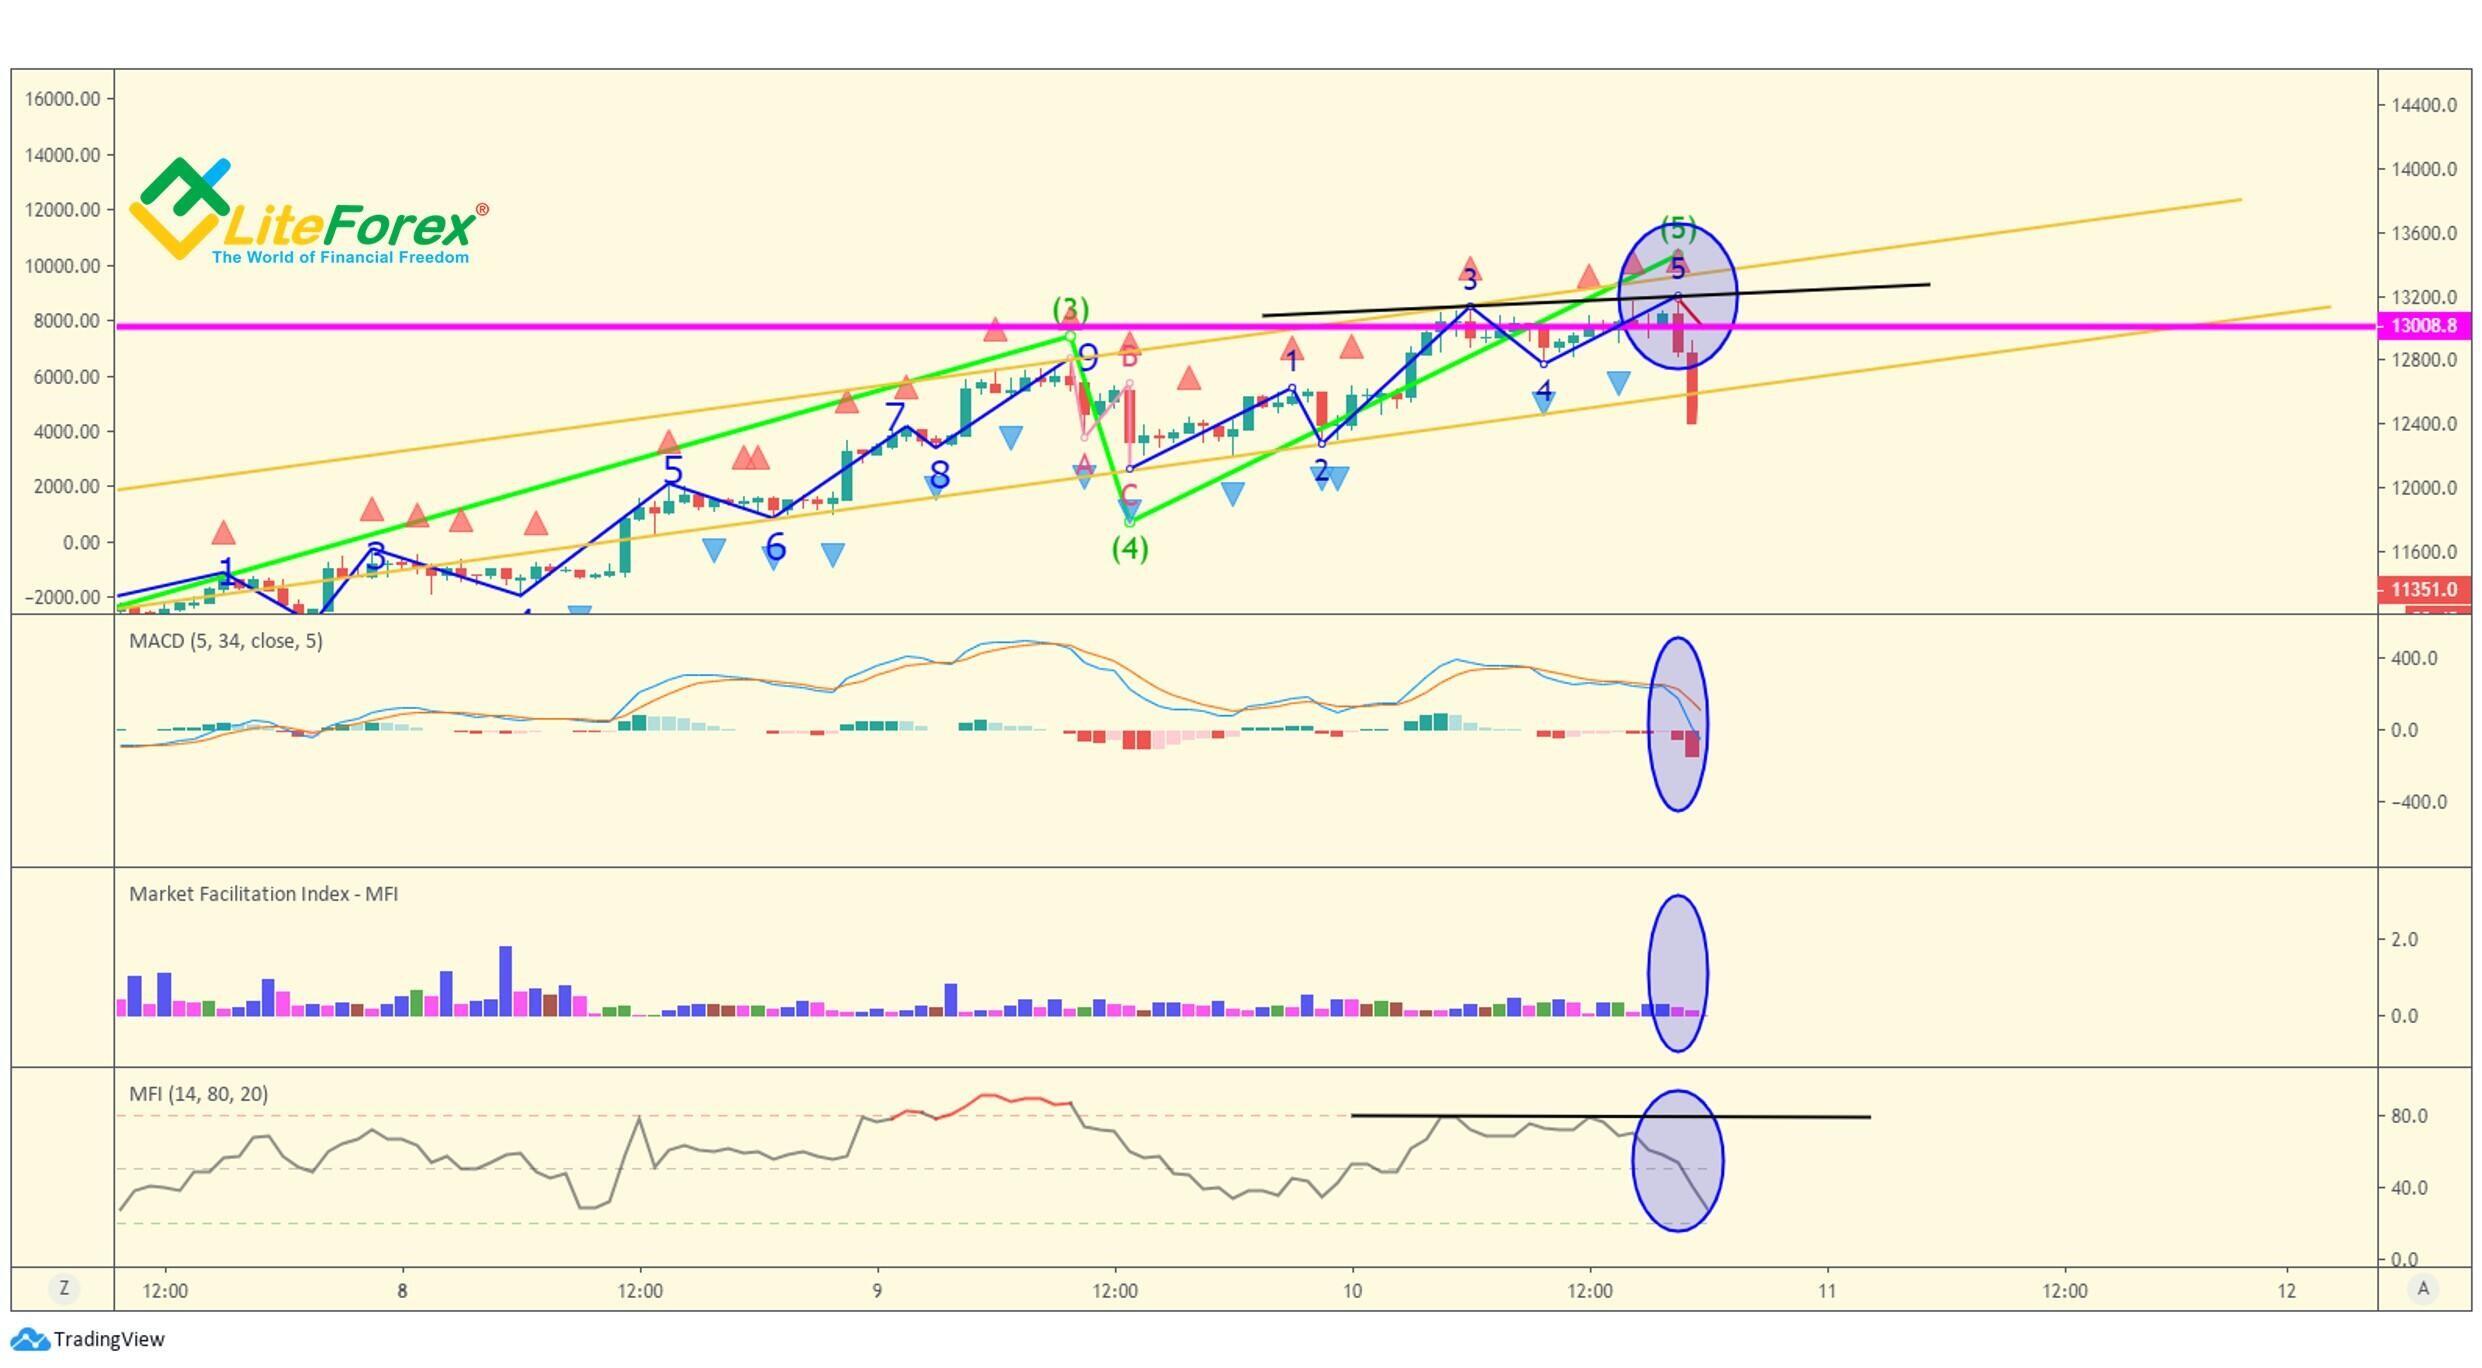
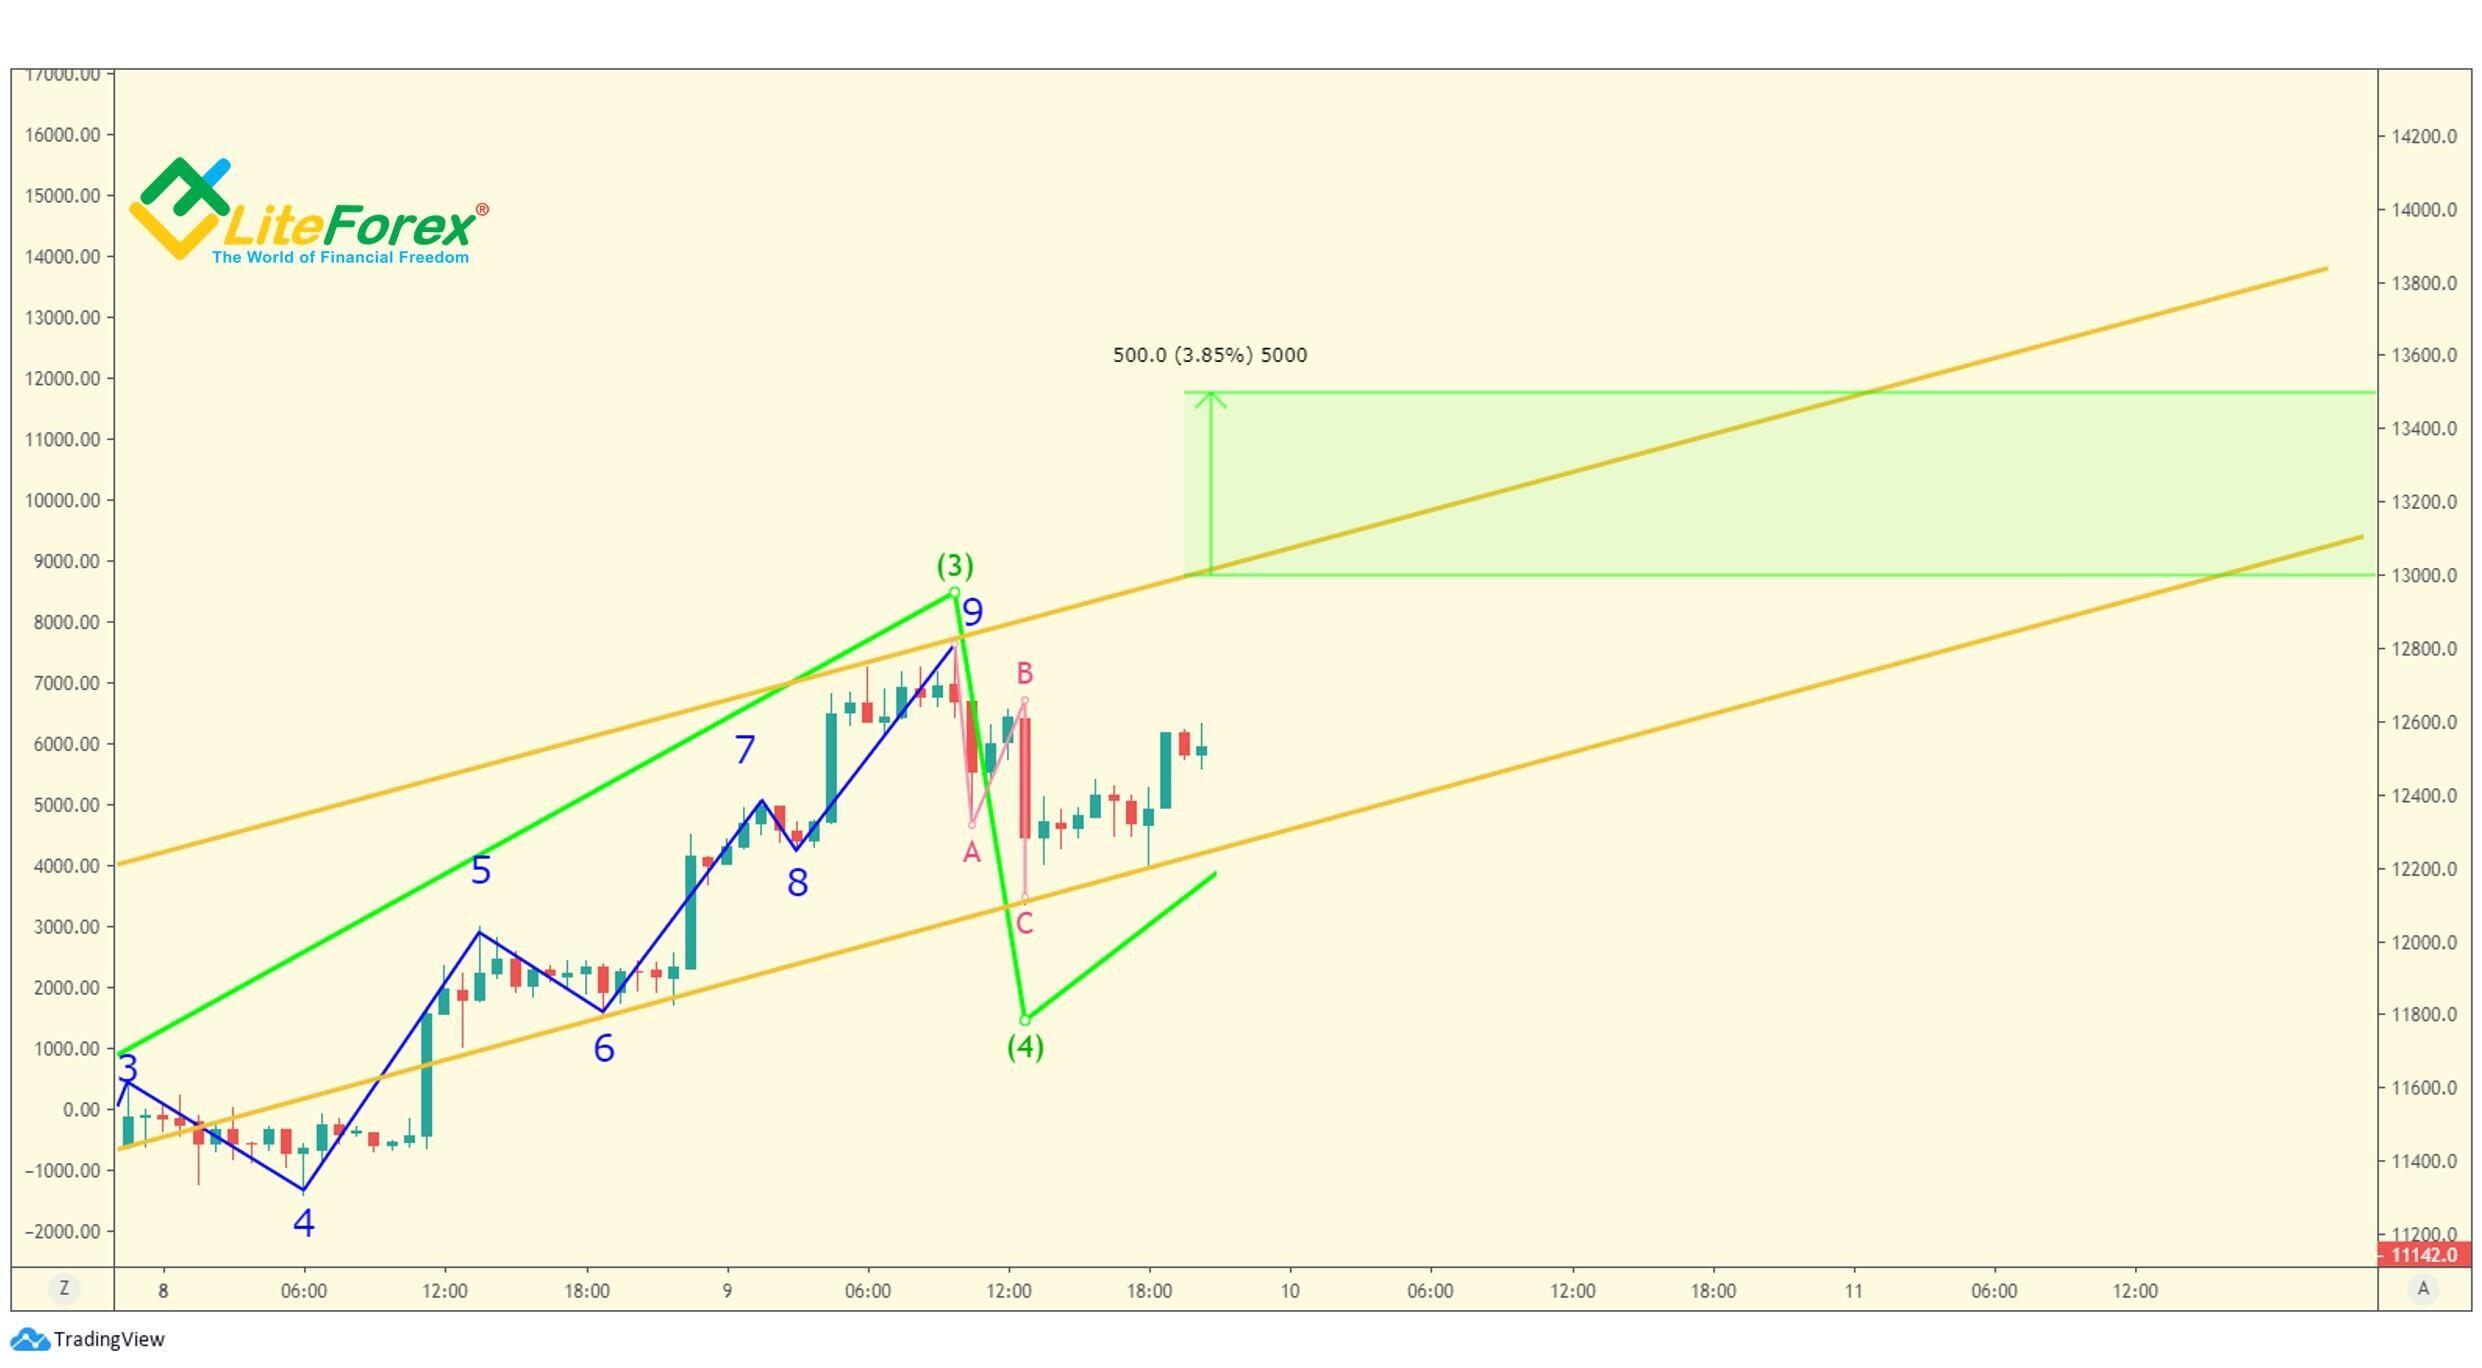
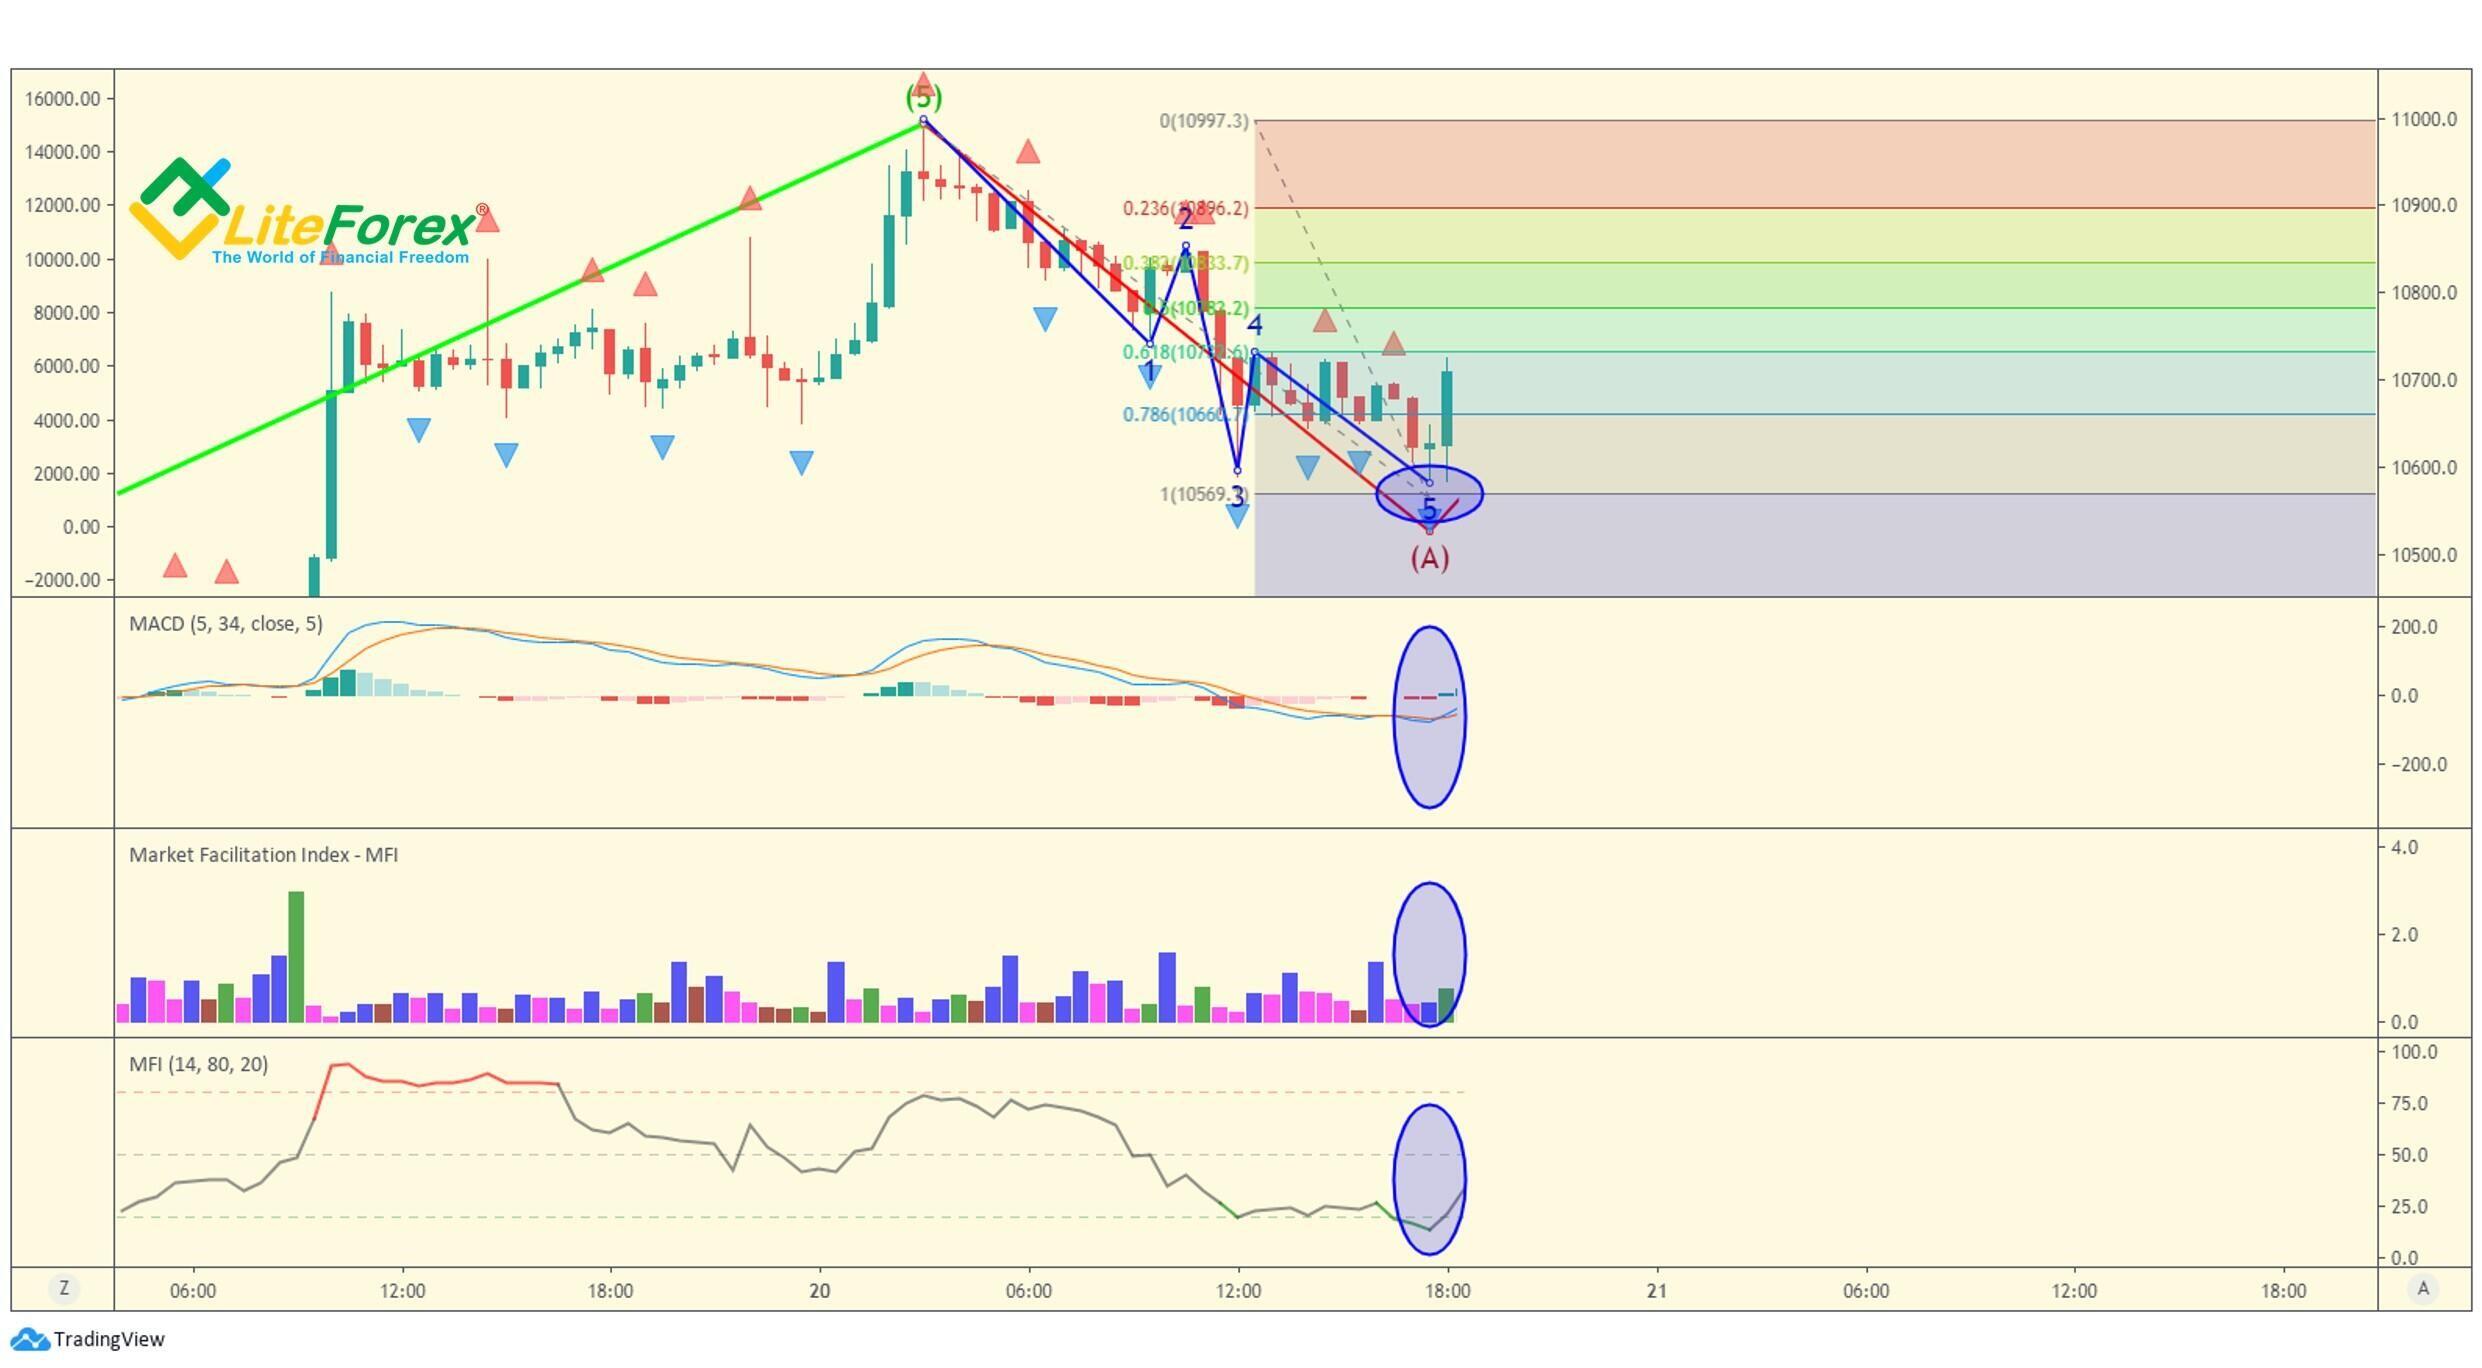
The BTCUSD chart displays the next wave top that is a little higher than the one I analyzed above. It seems more promising at least because there is a clear five-wave pattern at this moment. When this five-wave sequence completes, the price drops sharply. Besides, there three upward fractals around the peak, one of which is at the expected reversal bar (marked with the blue oval area).
MACD goes from the zero levels down to the negative area at the moment of the expected reversal. The blue MA also crosses the yellow one. In the range of three bars, the Market Facilitation Index displays one blue false bar and two purple squatting bars, which is a clear signal that the wave should finish soon. There is also a barely noticeable divergence on the classical MFI.
At the termination point of the fifth wave, we sell all the orders and exit the market.
Trading corrective waves
When trading corrective waves, we follow the same logic as in the case with the five-wave sequence. And the zero point is easier to identify here as it is the endpoint of the fifth wave.
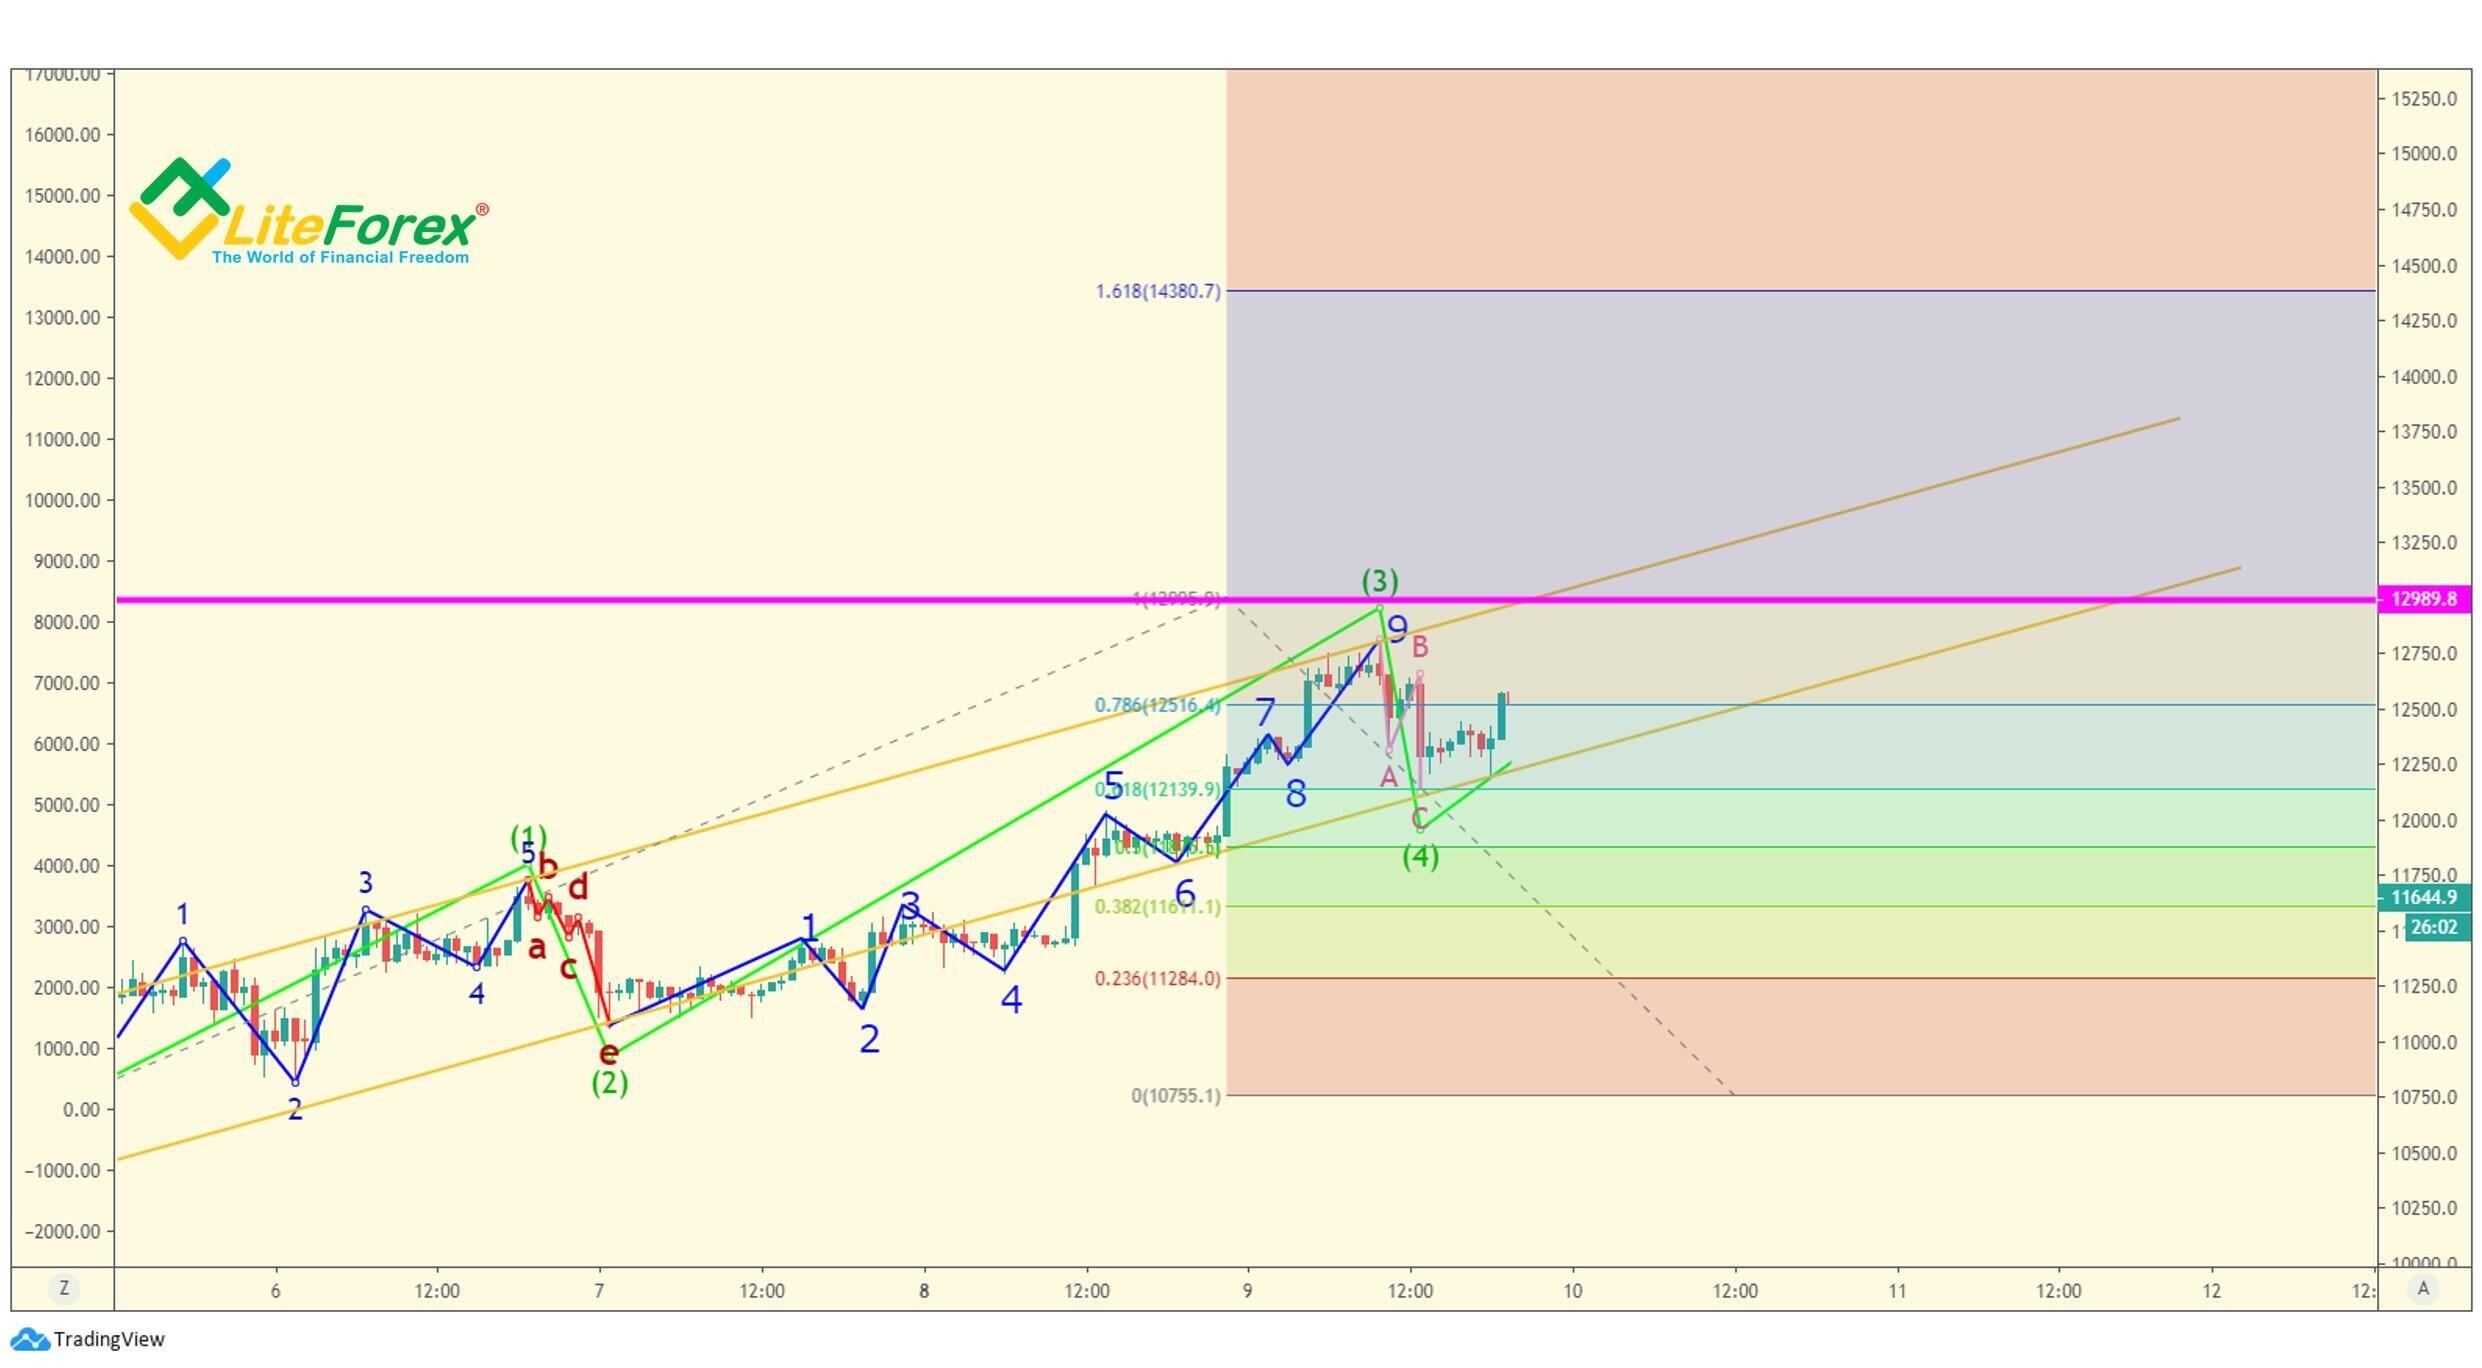
Wave A
As you remember from the previous article, during the first wave, we could watch the correct development or we could act more reasonably. In this case, I will follow the second way.
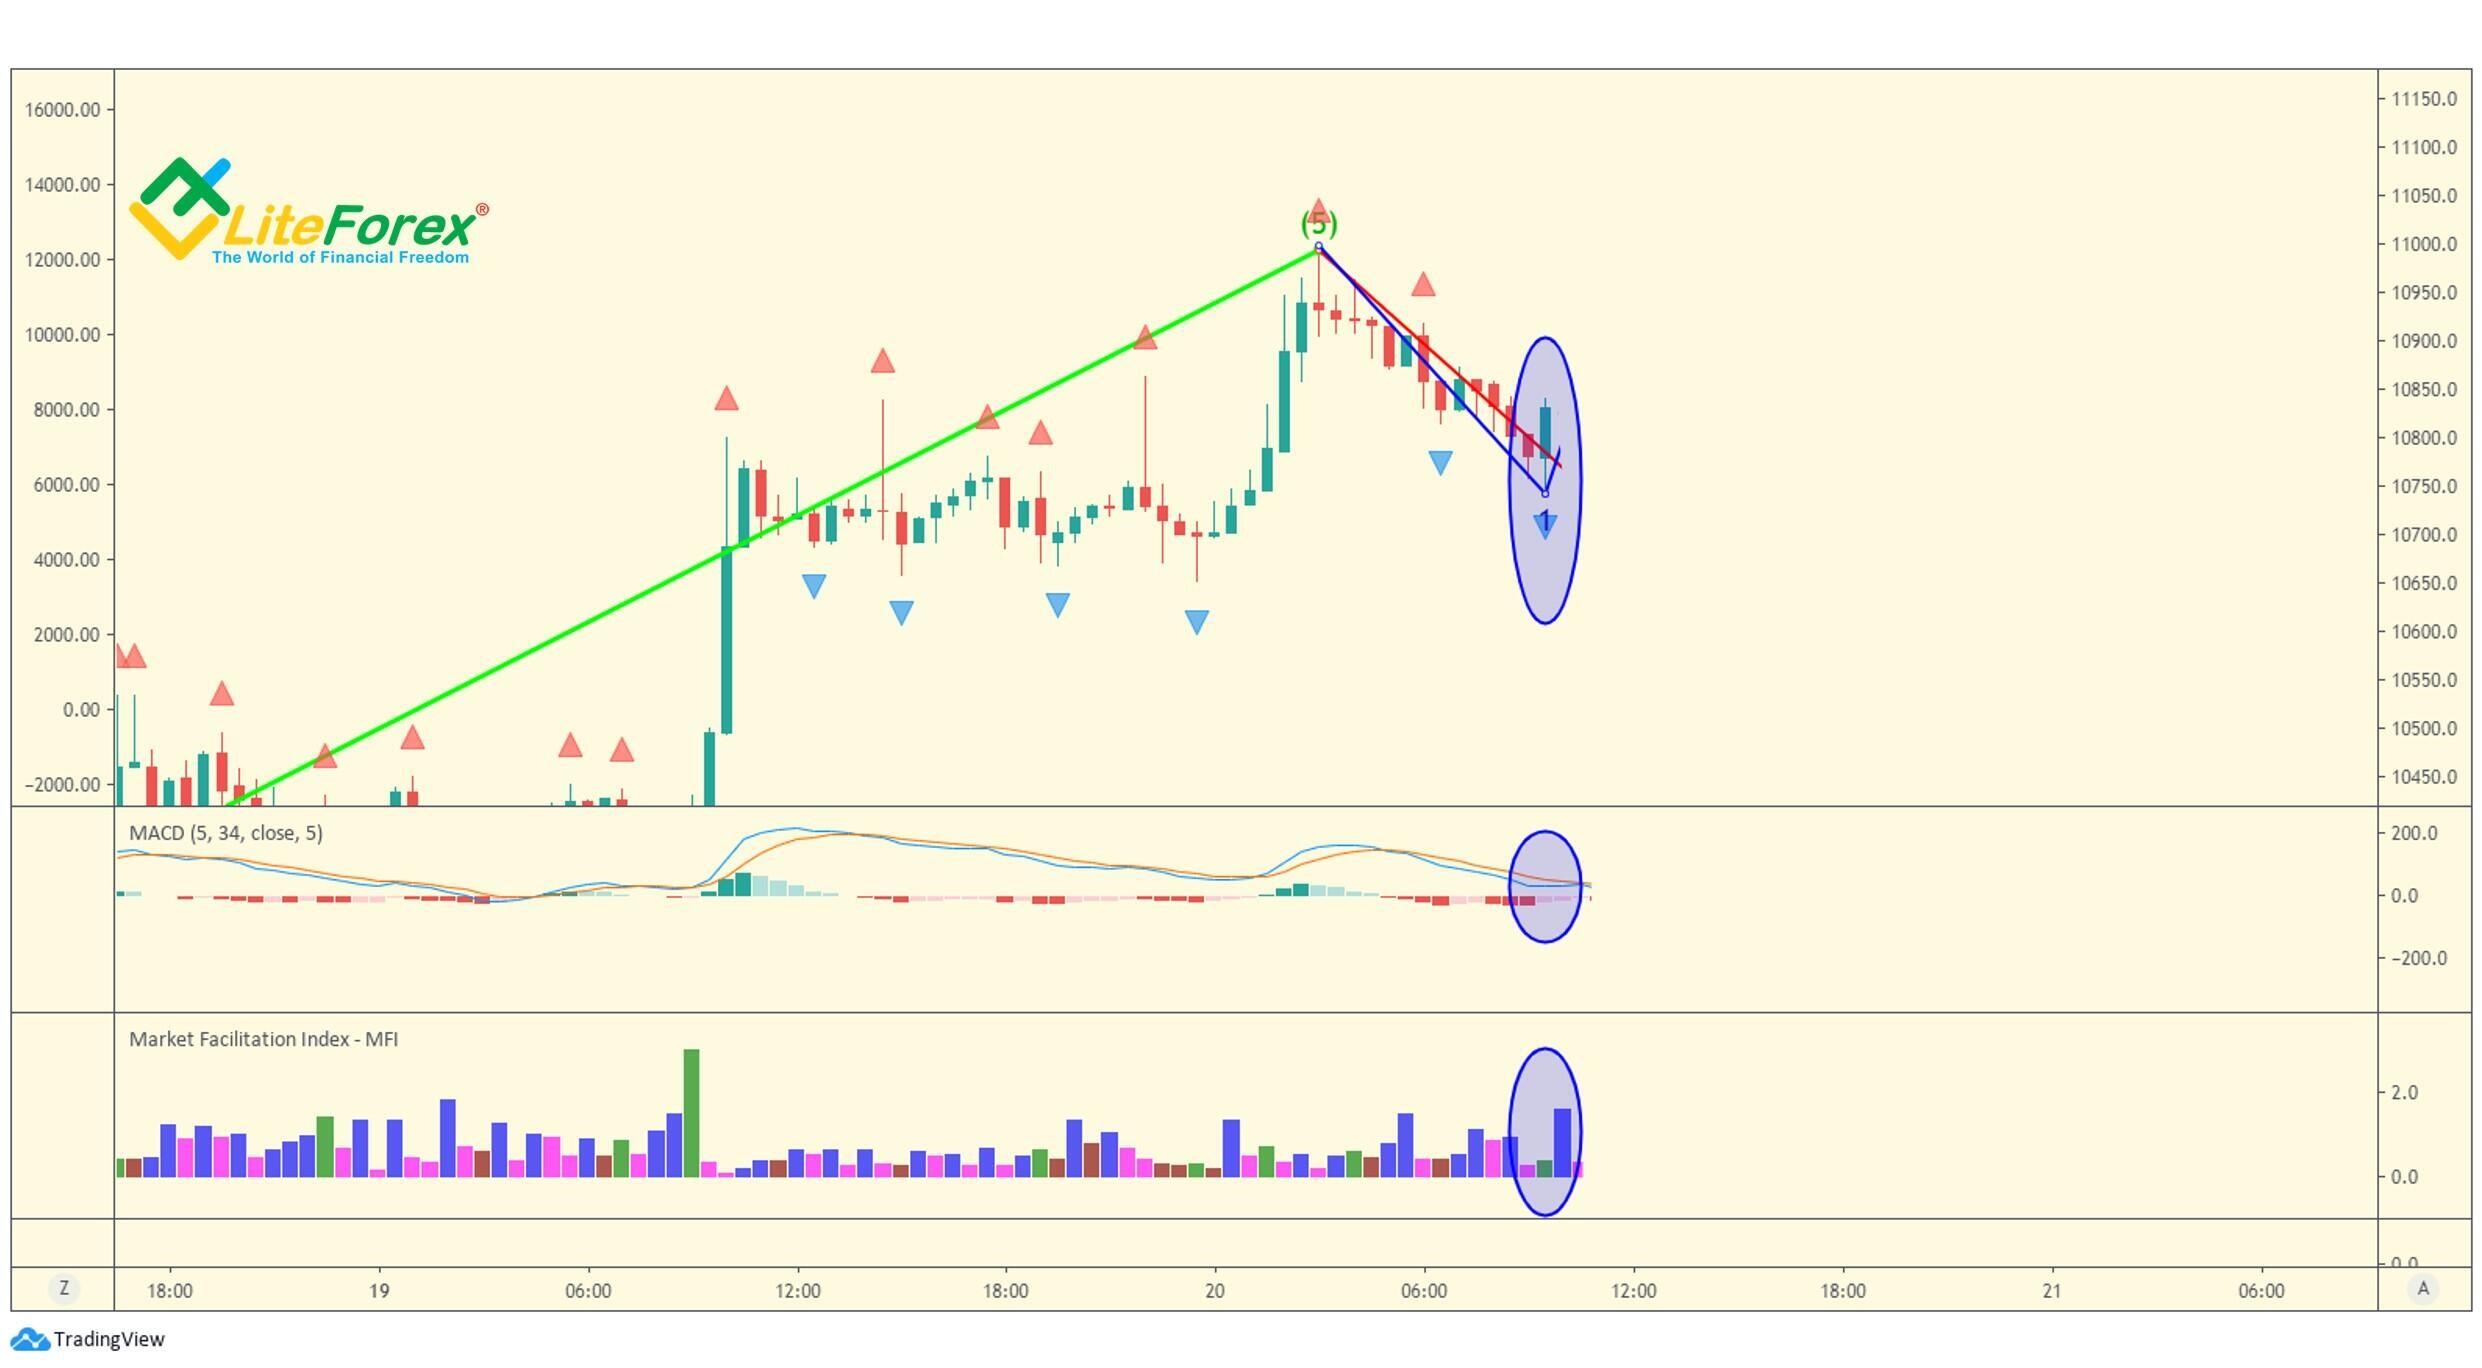
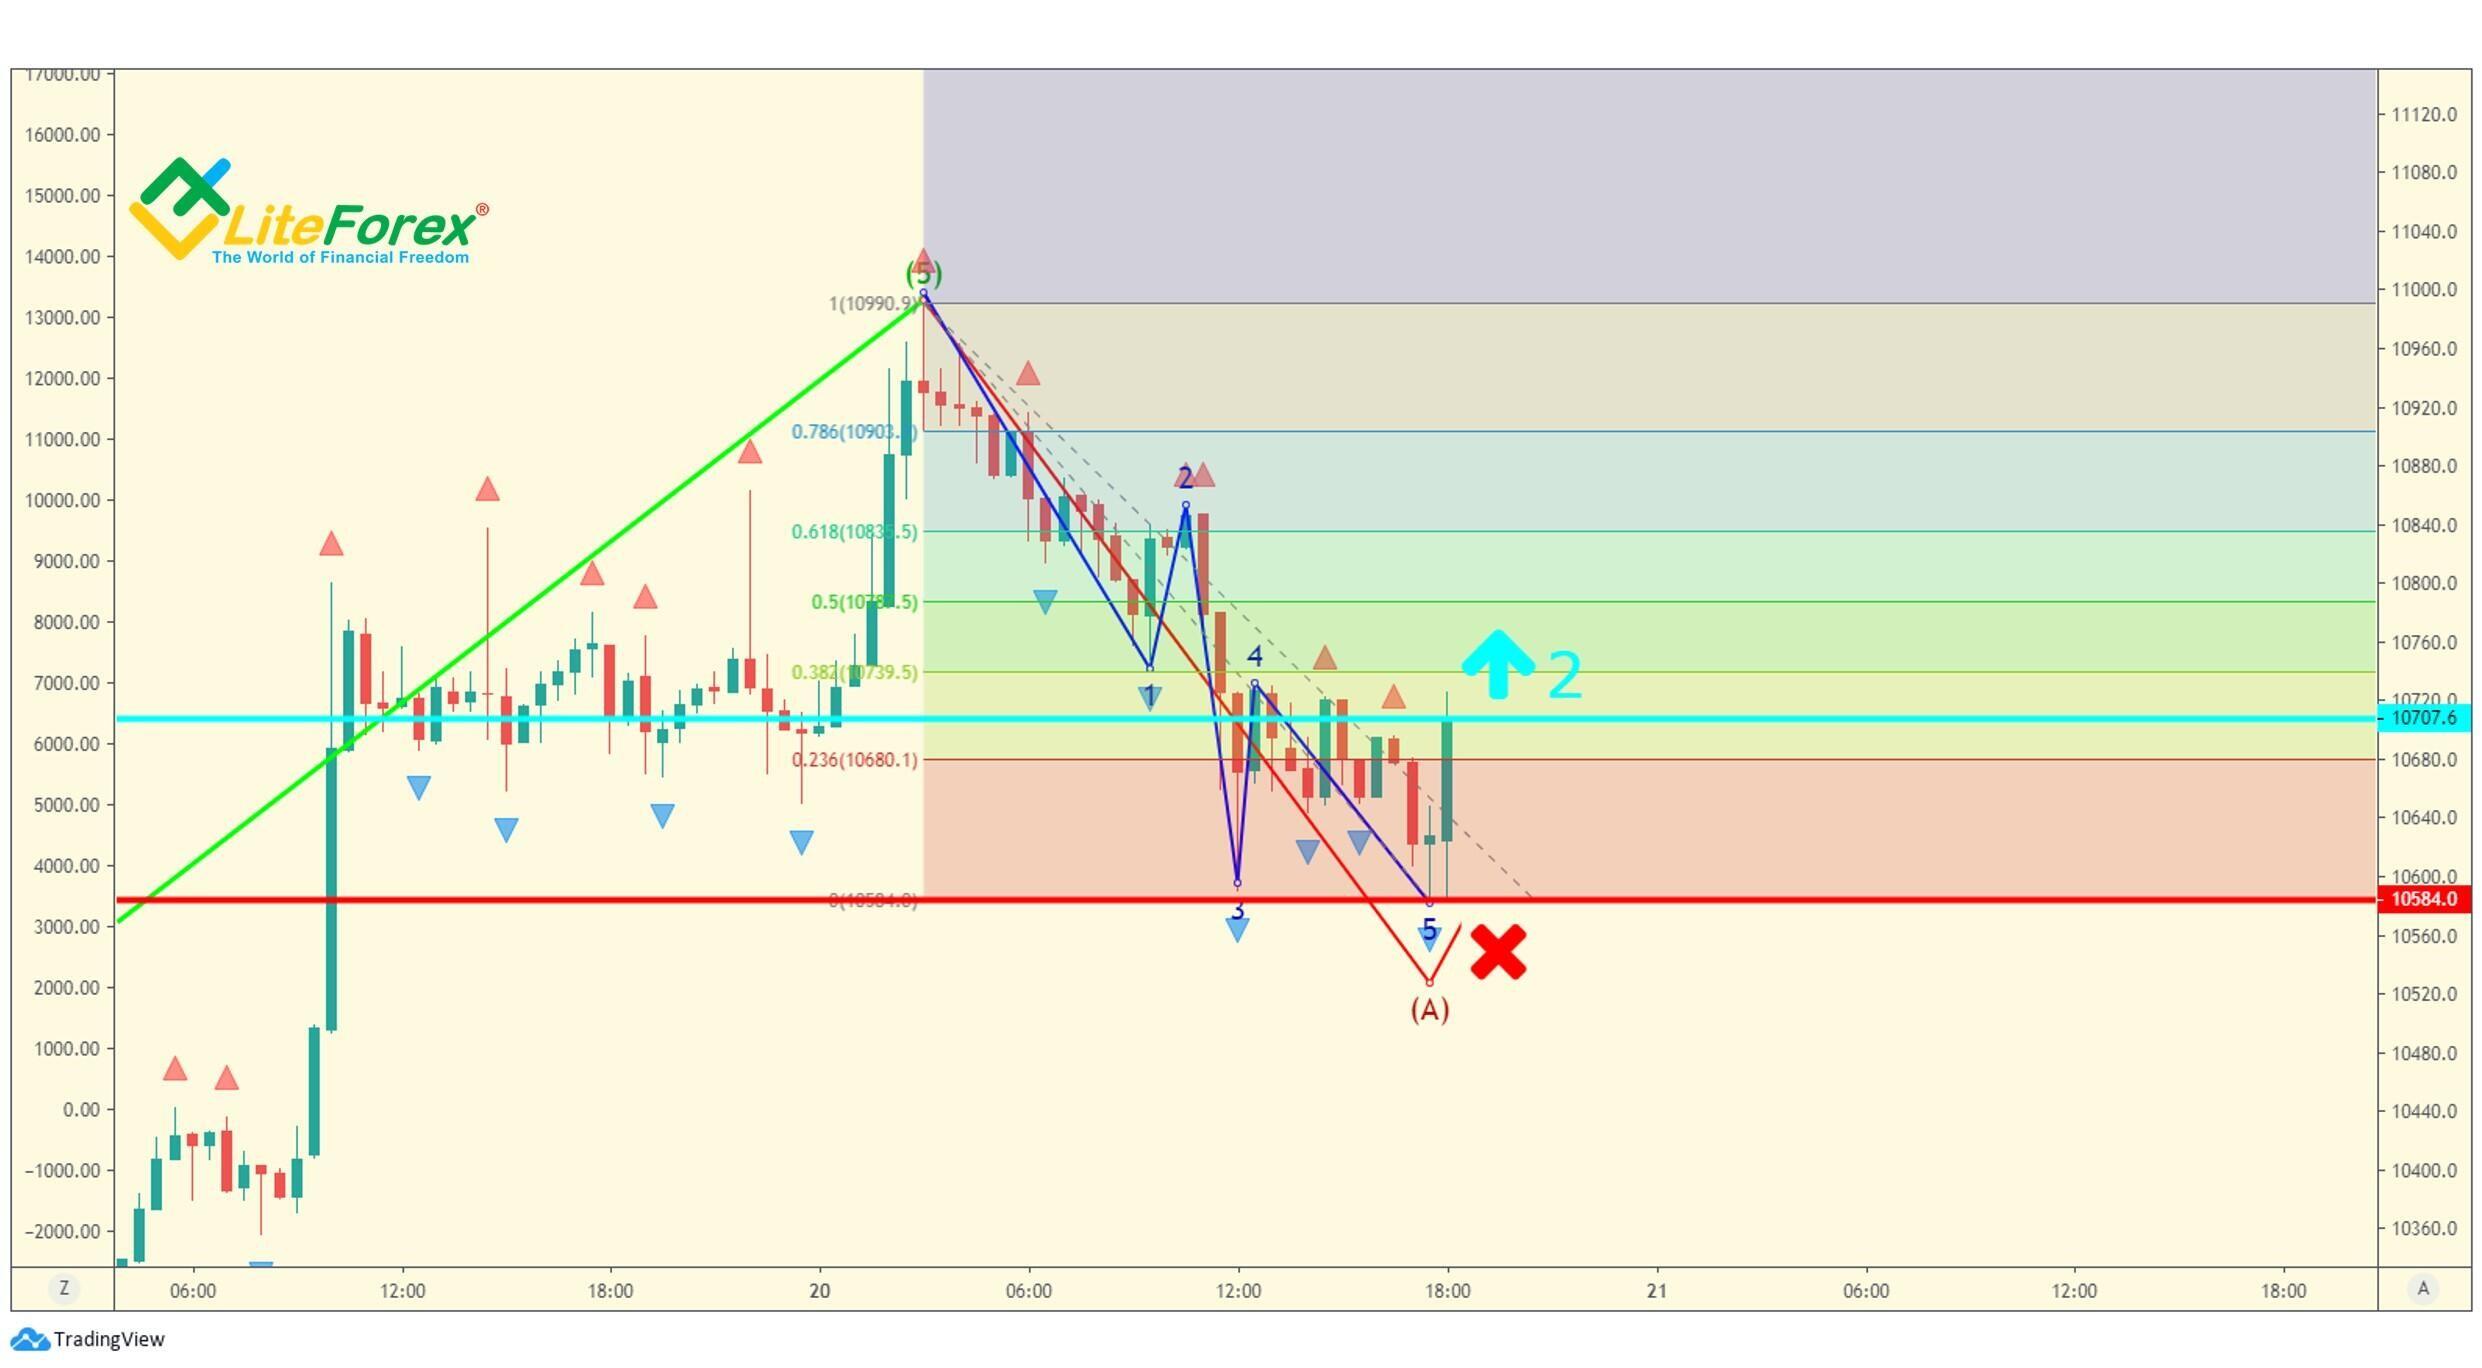
The end of the first sub-wave is indicated by a few signals: there is a down fractal (blue oval in the chart), the MACD moves into the zero zone, and there is a squatting bar painted by Market Facilitation Index (note that the green bar appears already during the price rise and is a signal of the further upward movement).
At the start of the second sub-wave, we see that there is at least a three-wave pattern, and we expect until the second wave reaches 50% –61,8% of the first wave’s length. We also note the five bullets' signals.
In this example, the market reverses a little lower than 50% of the first wave’s length. We need to close the position according to few signals: there to consecutive upward fractals, the MACD is in the zero zone, and there is also a squatting bar on the Market Facilitation Index (marked with blue ovals).
At the start of the third wave, we sell at the level marked by the horizontal turquoise line and set a stop loss a little higher than the fifth wave of the impulse pattern (the red line). As the corrections are not deep, we shall trade around the recently opened position.
At the fourth wave, we see that it is a five-wave sequence. To identify the target, we use the wave relations offered by Prechter, according to which, the distance between the start of the first wave and the end of the fourth wave is 61.8% of the entire impulse. So, the trend should reverse at 100% or the value of 1 in the chart (an approximate zone is marked by the blue oval in the chart; the turquoise line marks the entry-level). Channeling will produce little or no effect in this case, as the formation has irregular design.
By the way, as the reversal starts with the five-wave cycle, we shall expect a zigzag-shaped correction of a higher degree.
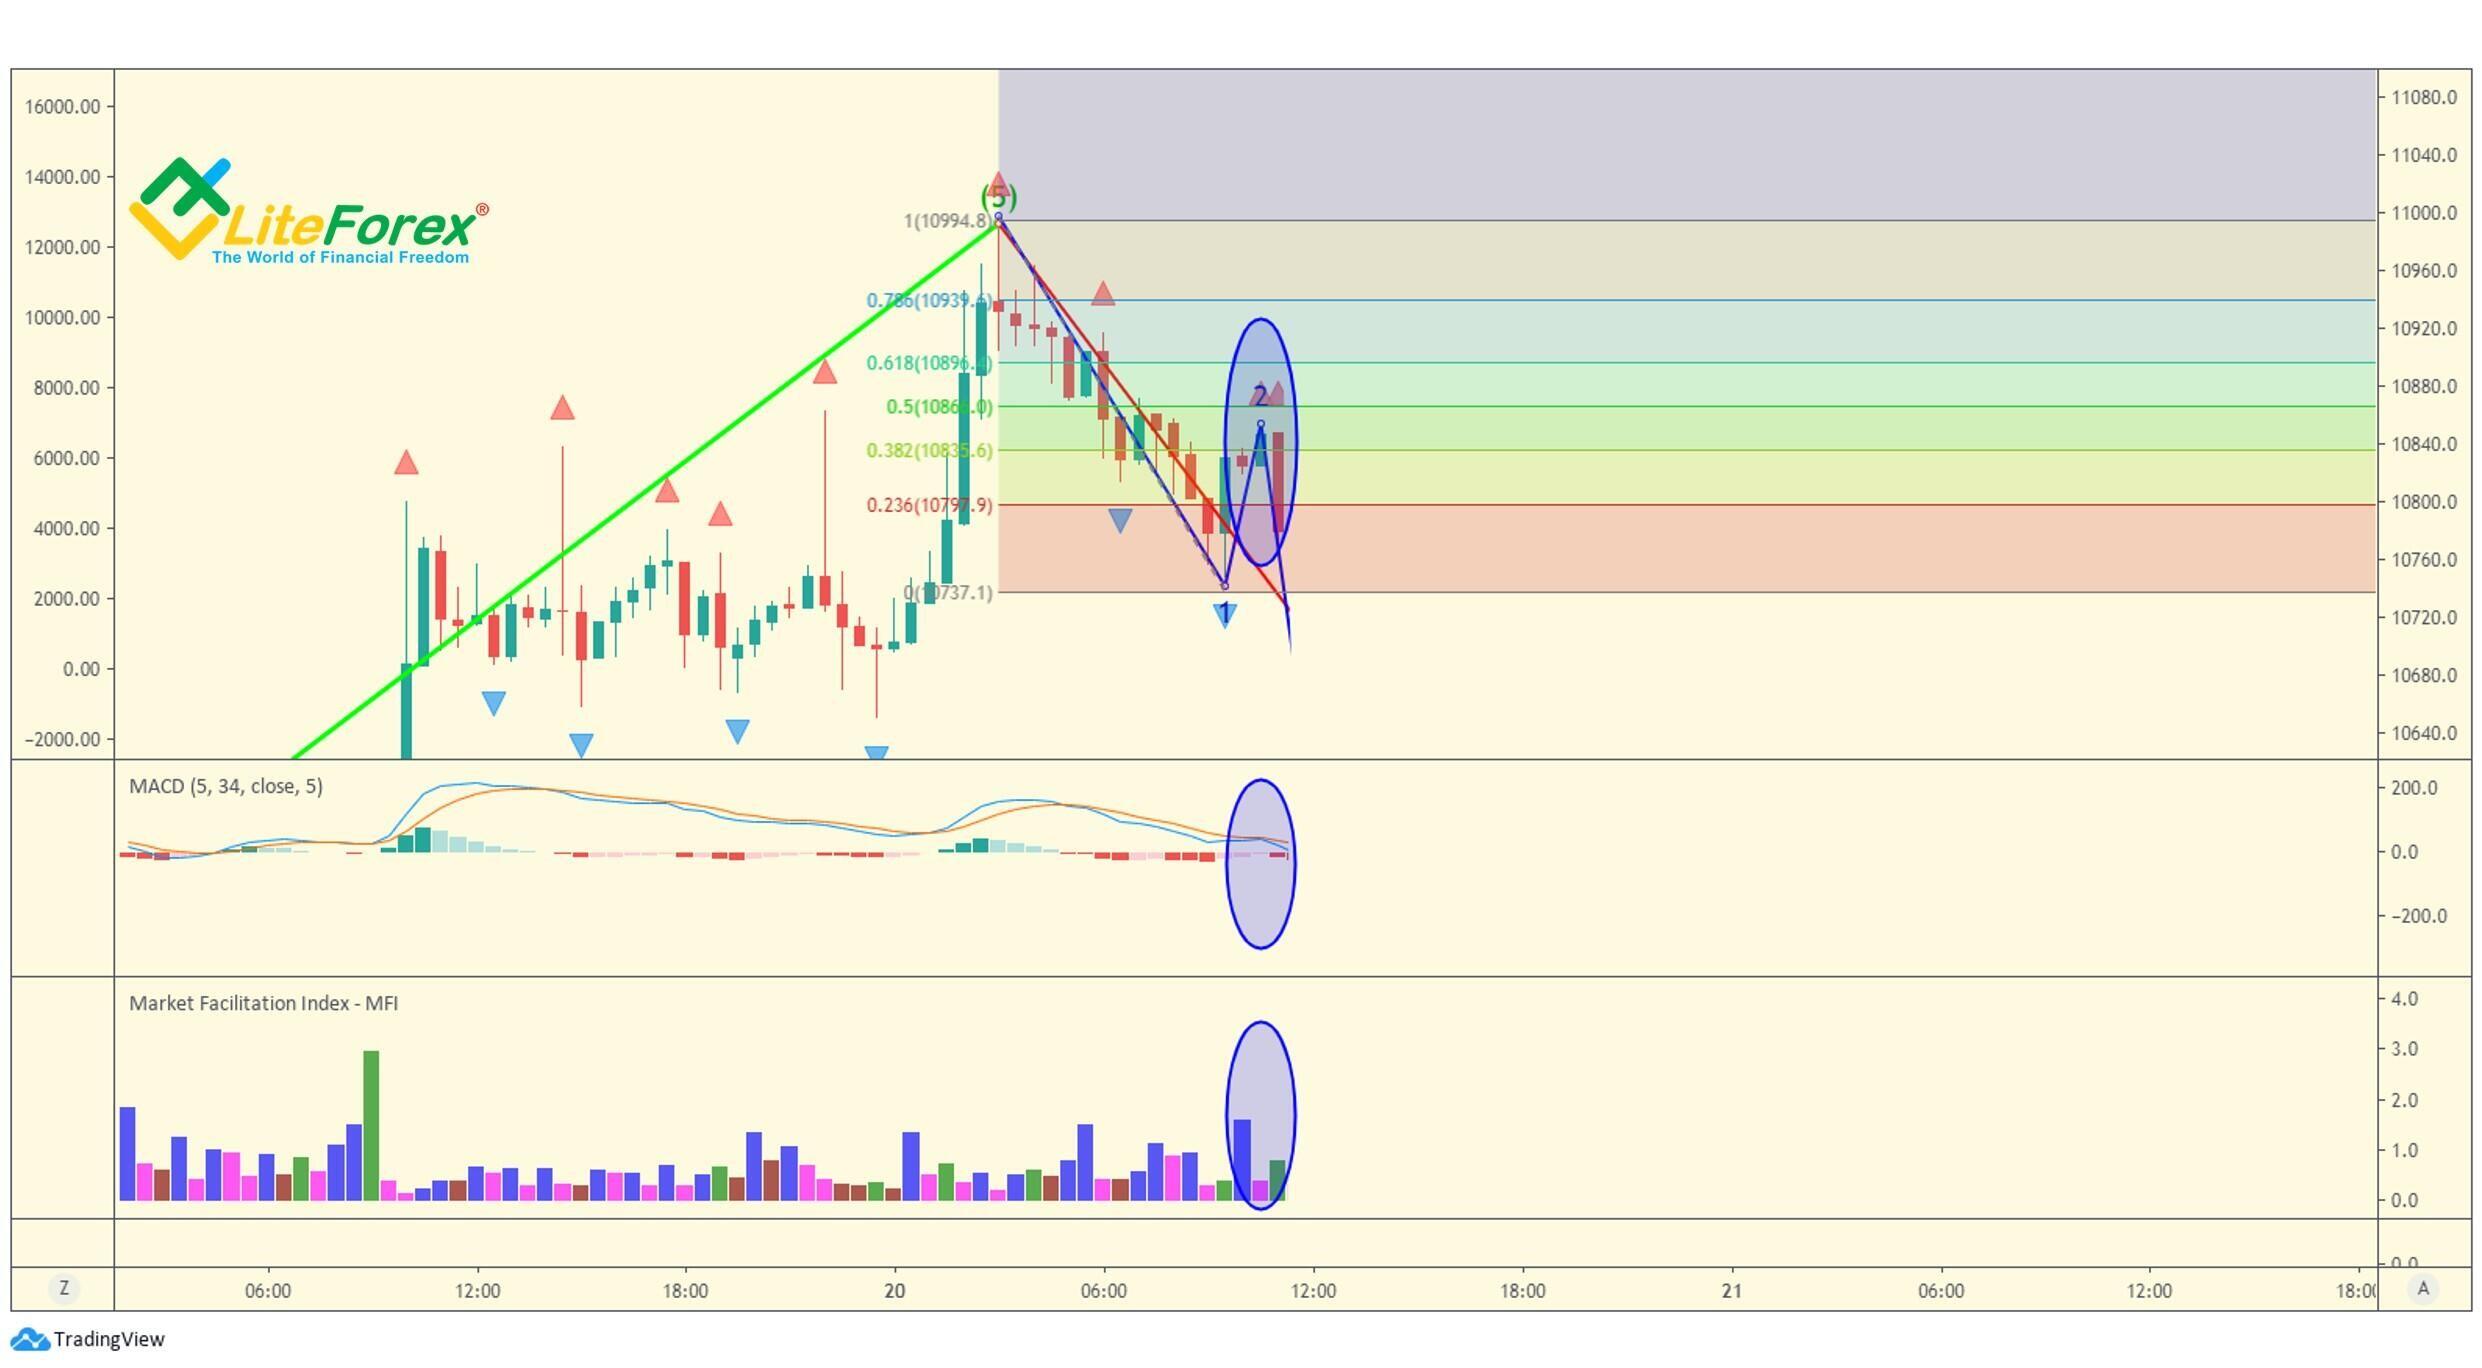
Once the price approaches the target zone, we check the five bullets. The bar marked with a blue circle forms a down fractal. It is followed by a sharp price rise. The MACD goes from the red zone into the green one, its MAs are crossing. The Market Facilitation Index paints a squatting bar in the area of three bars, the following rise looks like the green bar, which signals the price should continue growing. The MFI is in the oversold zone. I can surely say the A wave is finishing.
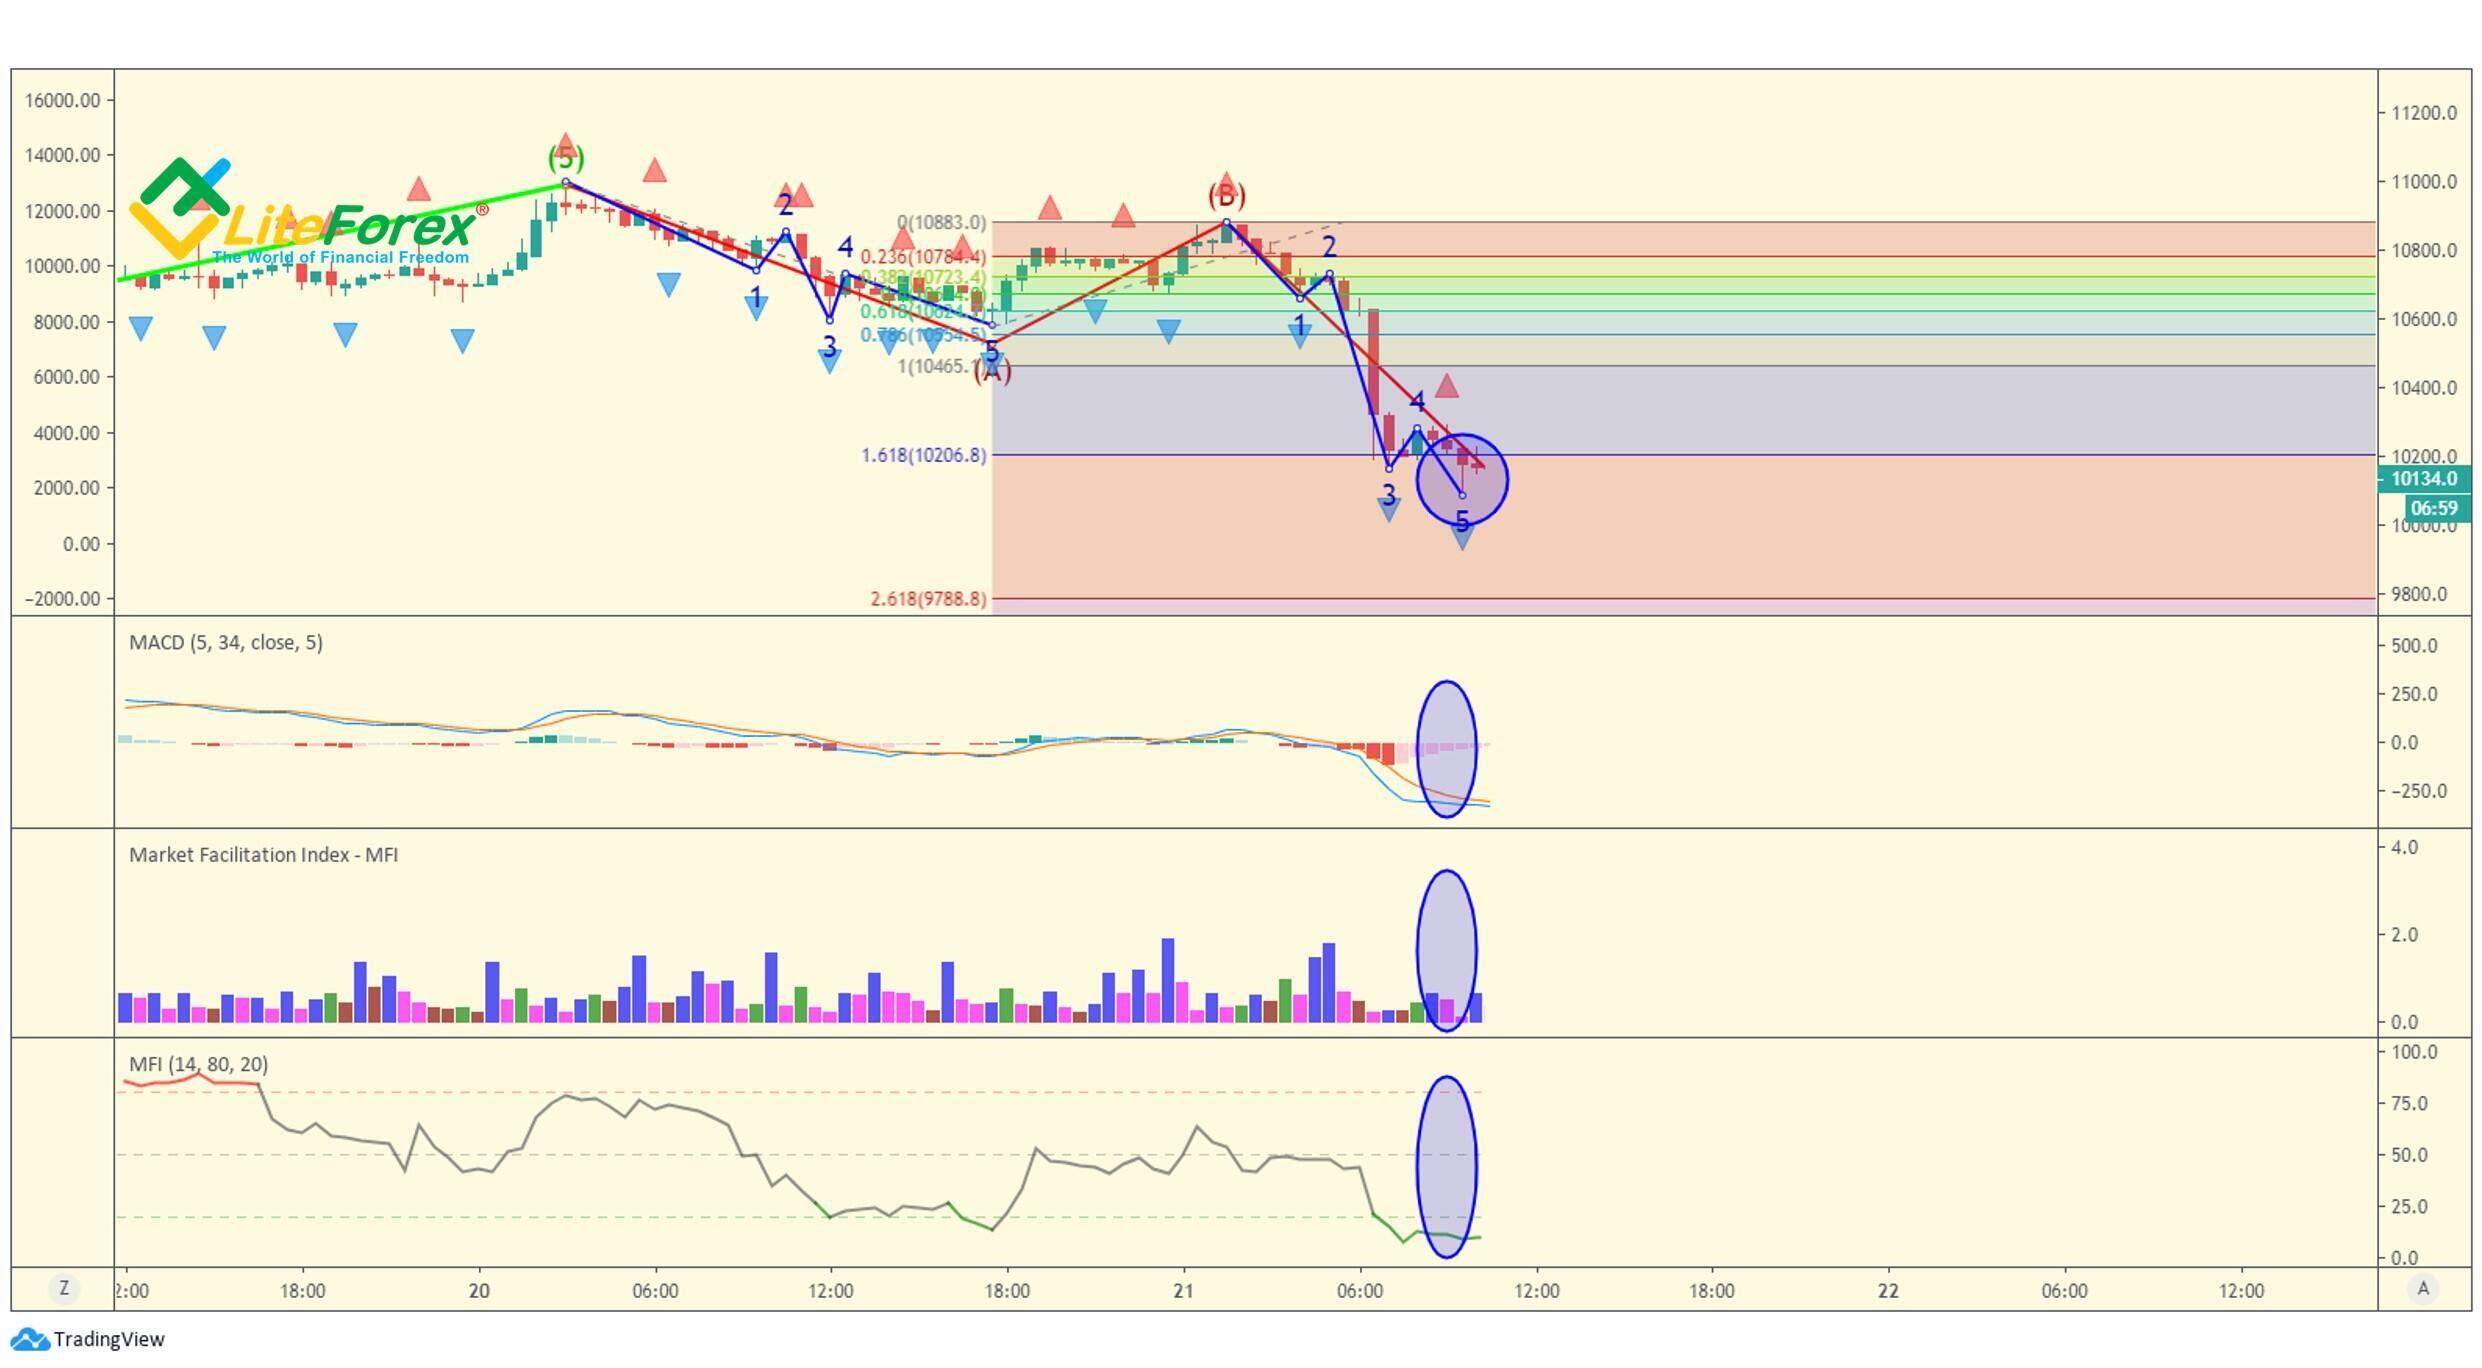
At the end of the second wave, we don’t take the profit, expecting the down move to continue after the end of the B correction. To make a profit from the correction, we enter two long trades (turquoise horizontal line). The new target profit will the range of 38.2%–50% of the A wave (green area on the Fibonacci grid). The new stop loss is at the expected termination point of the A wave (the red line).
When the price is approaching the target zone, we check the five bullets. There is no fractal, the MACD is in the green areas, which signals the up move is to continue, the MFI is in the balance zone. The Market Facilitation Index paints the squatting (pink) bar and the withering (brown) bar. However, this signal alone is not enough to expect wave termination.
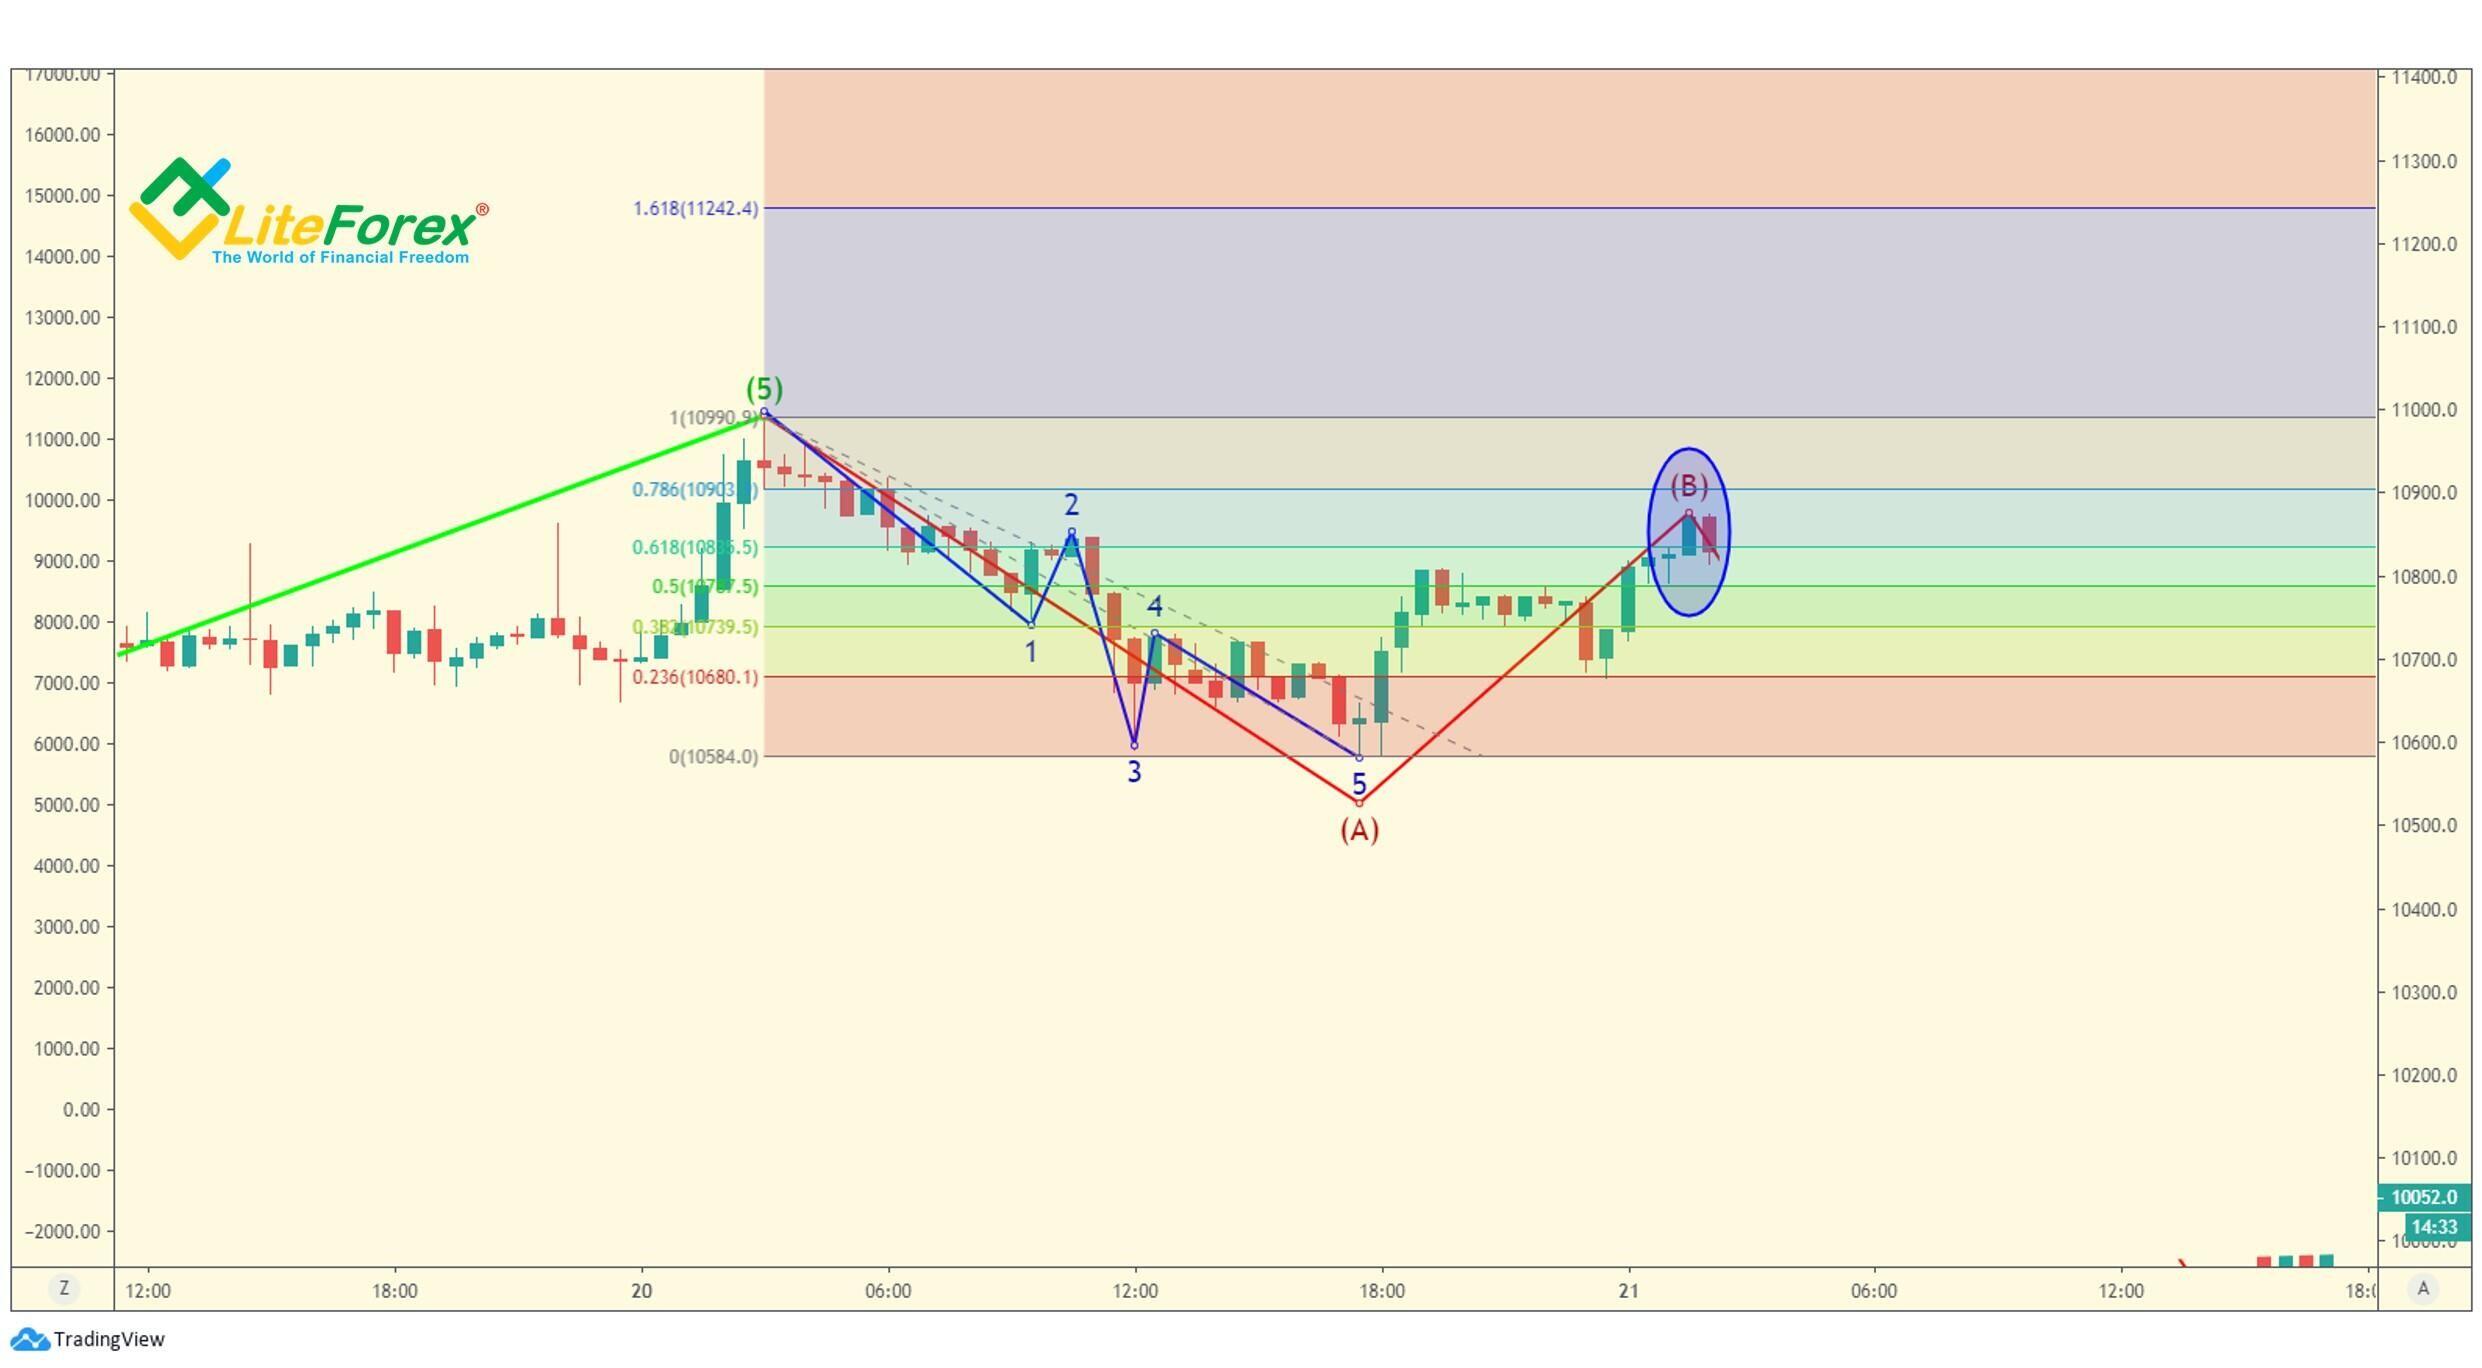
The next check of five bullets is when the B wave crosses level 0.618 (blue oval in the chart).
Besides the price entering the target zone, there is also a fractal, the MACD moves from the green area into the red one, its MAs cross, and there is also a squatting (pink) bar. We can say the B wave is finishing and take the profit from the two long trades entered earlier.
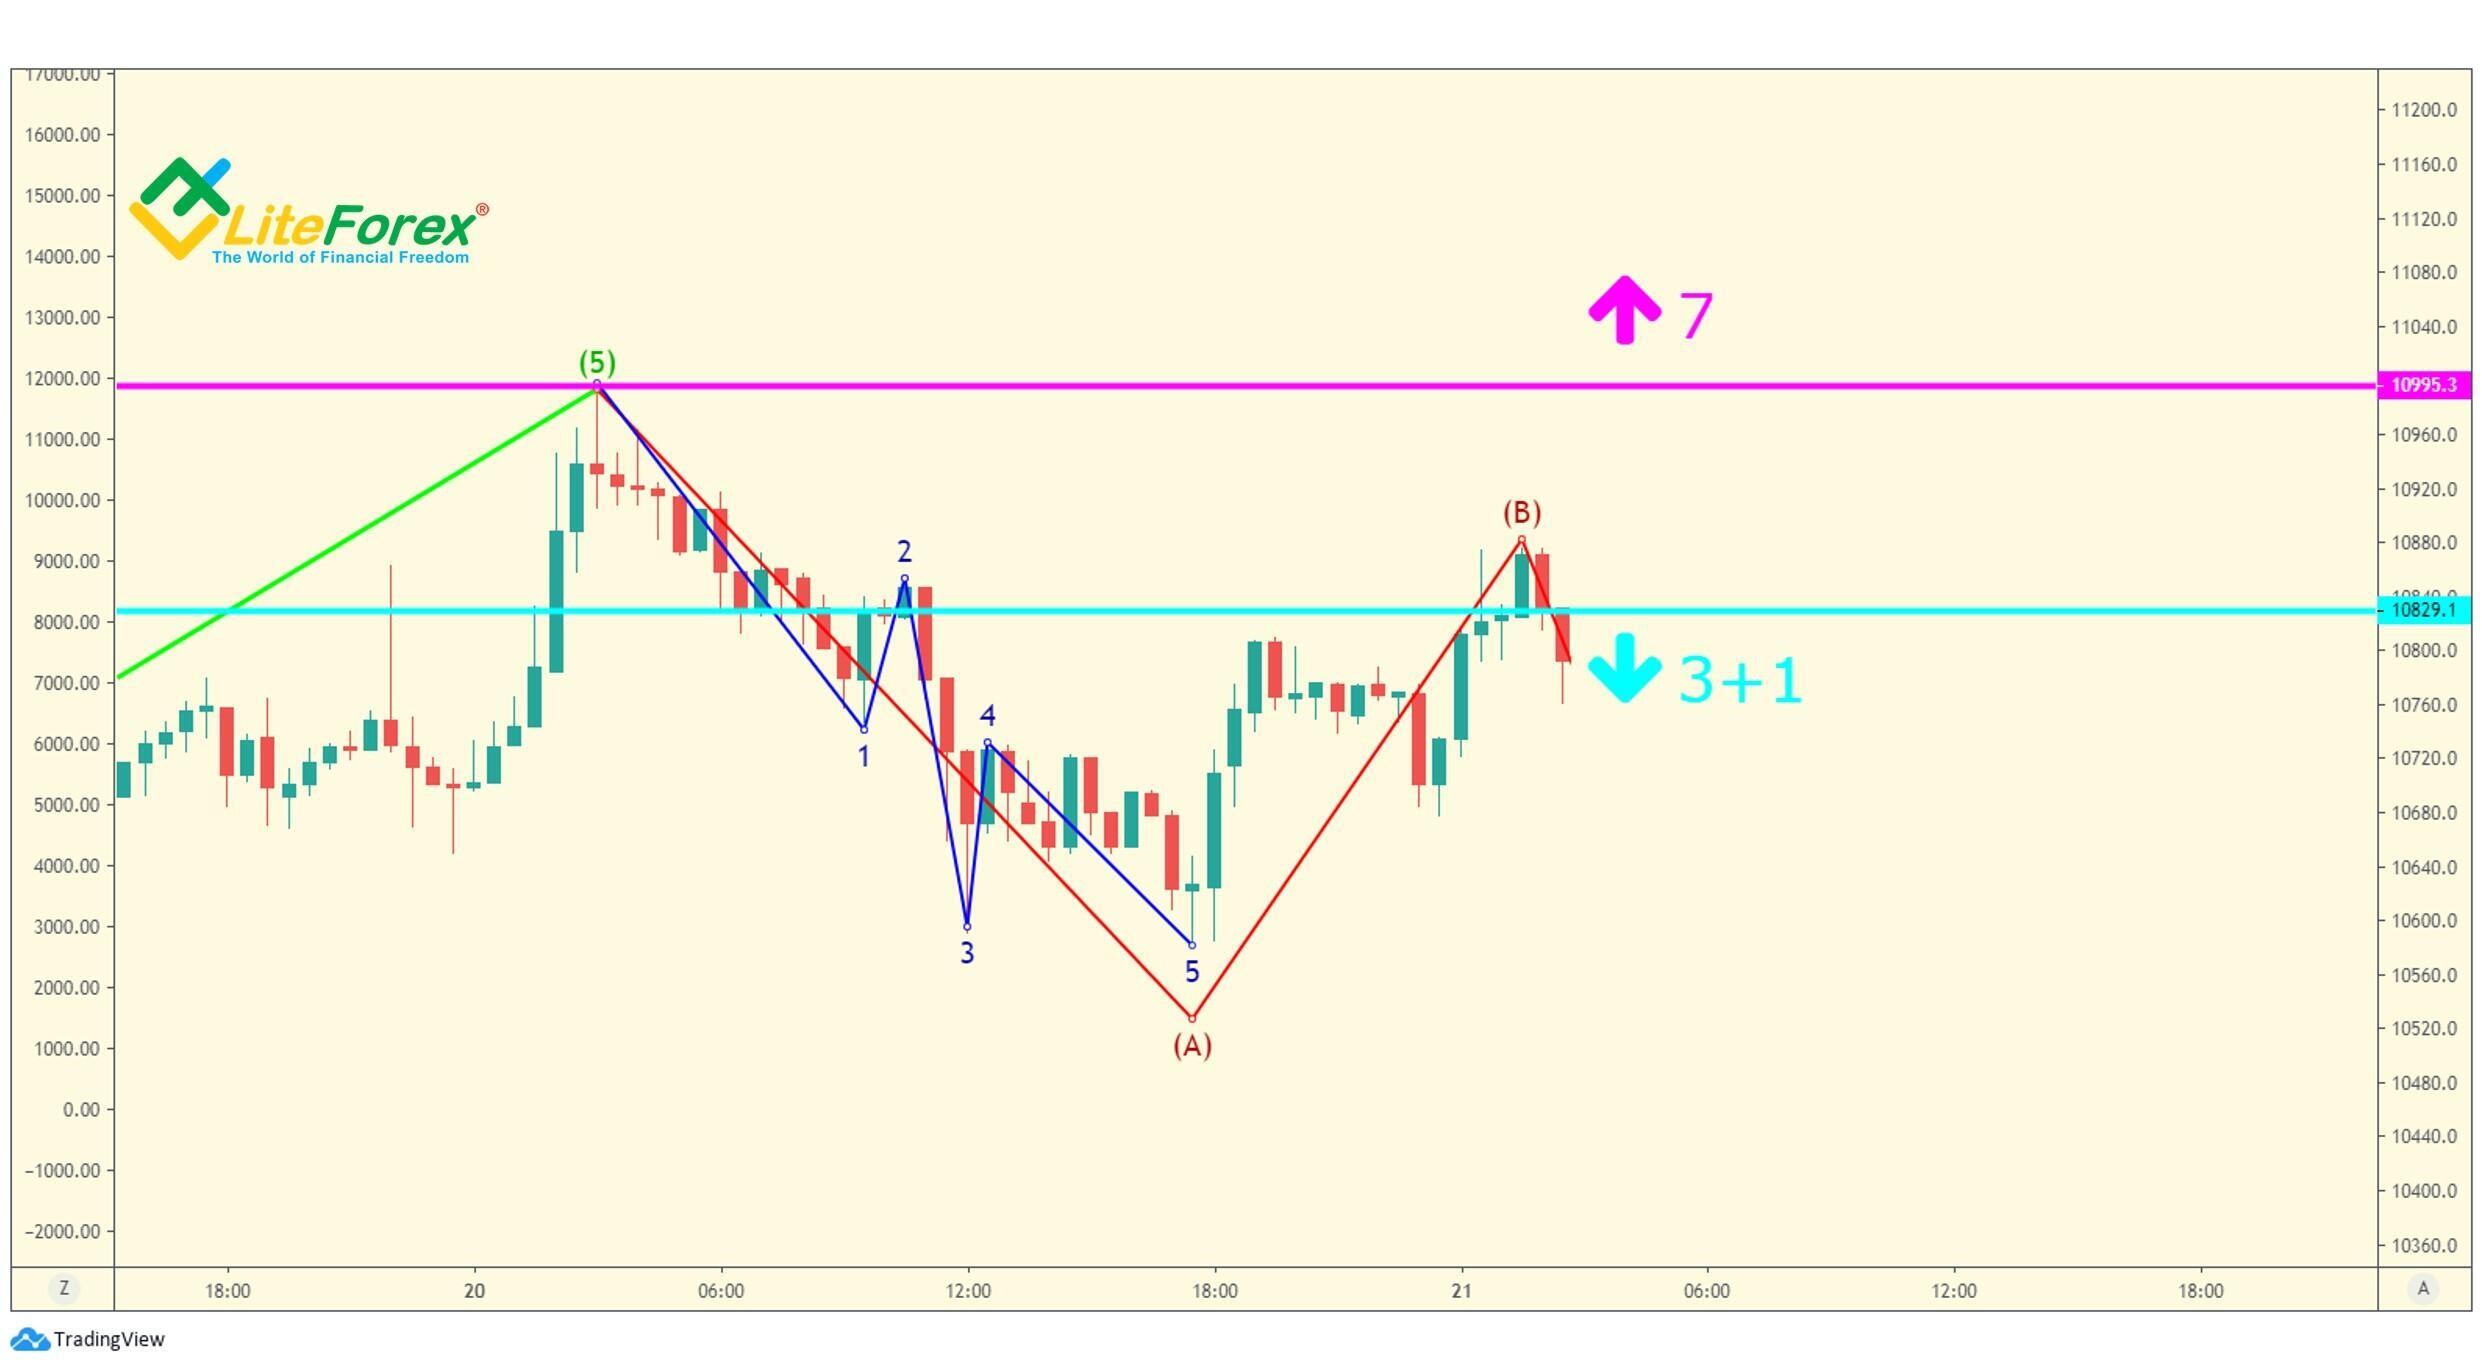
The ongoing C wave, according to the alternation principle, is likely to resemble the third wave in the impulse pattern. It means it should be longer than the A wave and is likely to be expanded. So, at the beginning of the C wave, we enter another three short trades (turquoise line) and there will be four sell orders in total (there was one short entered earlier). To balance the position in case we were wrong, we put seven buy stop orders (pink line).
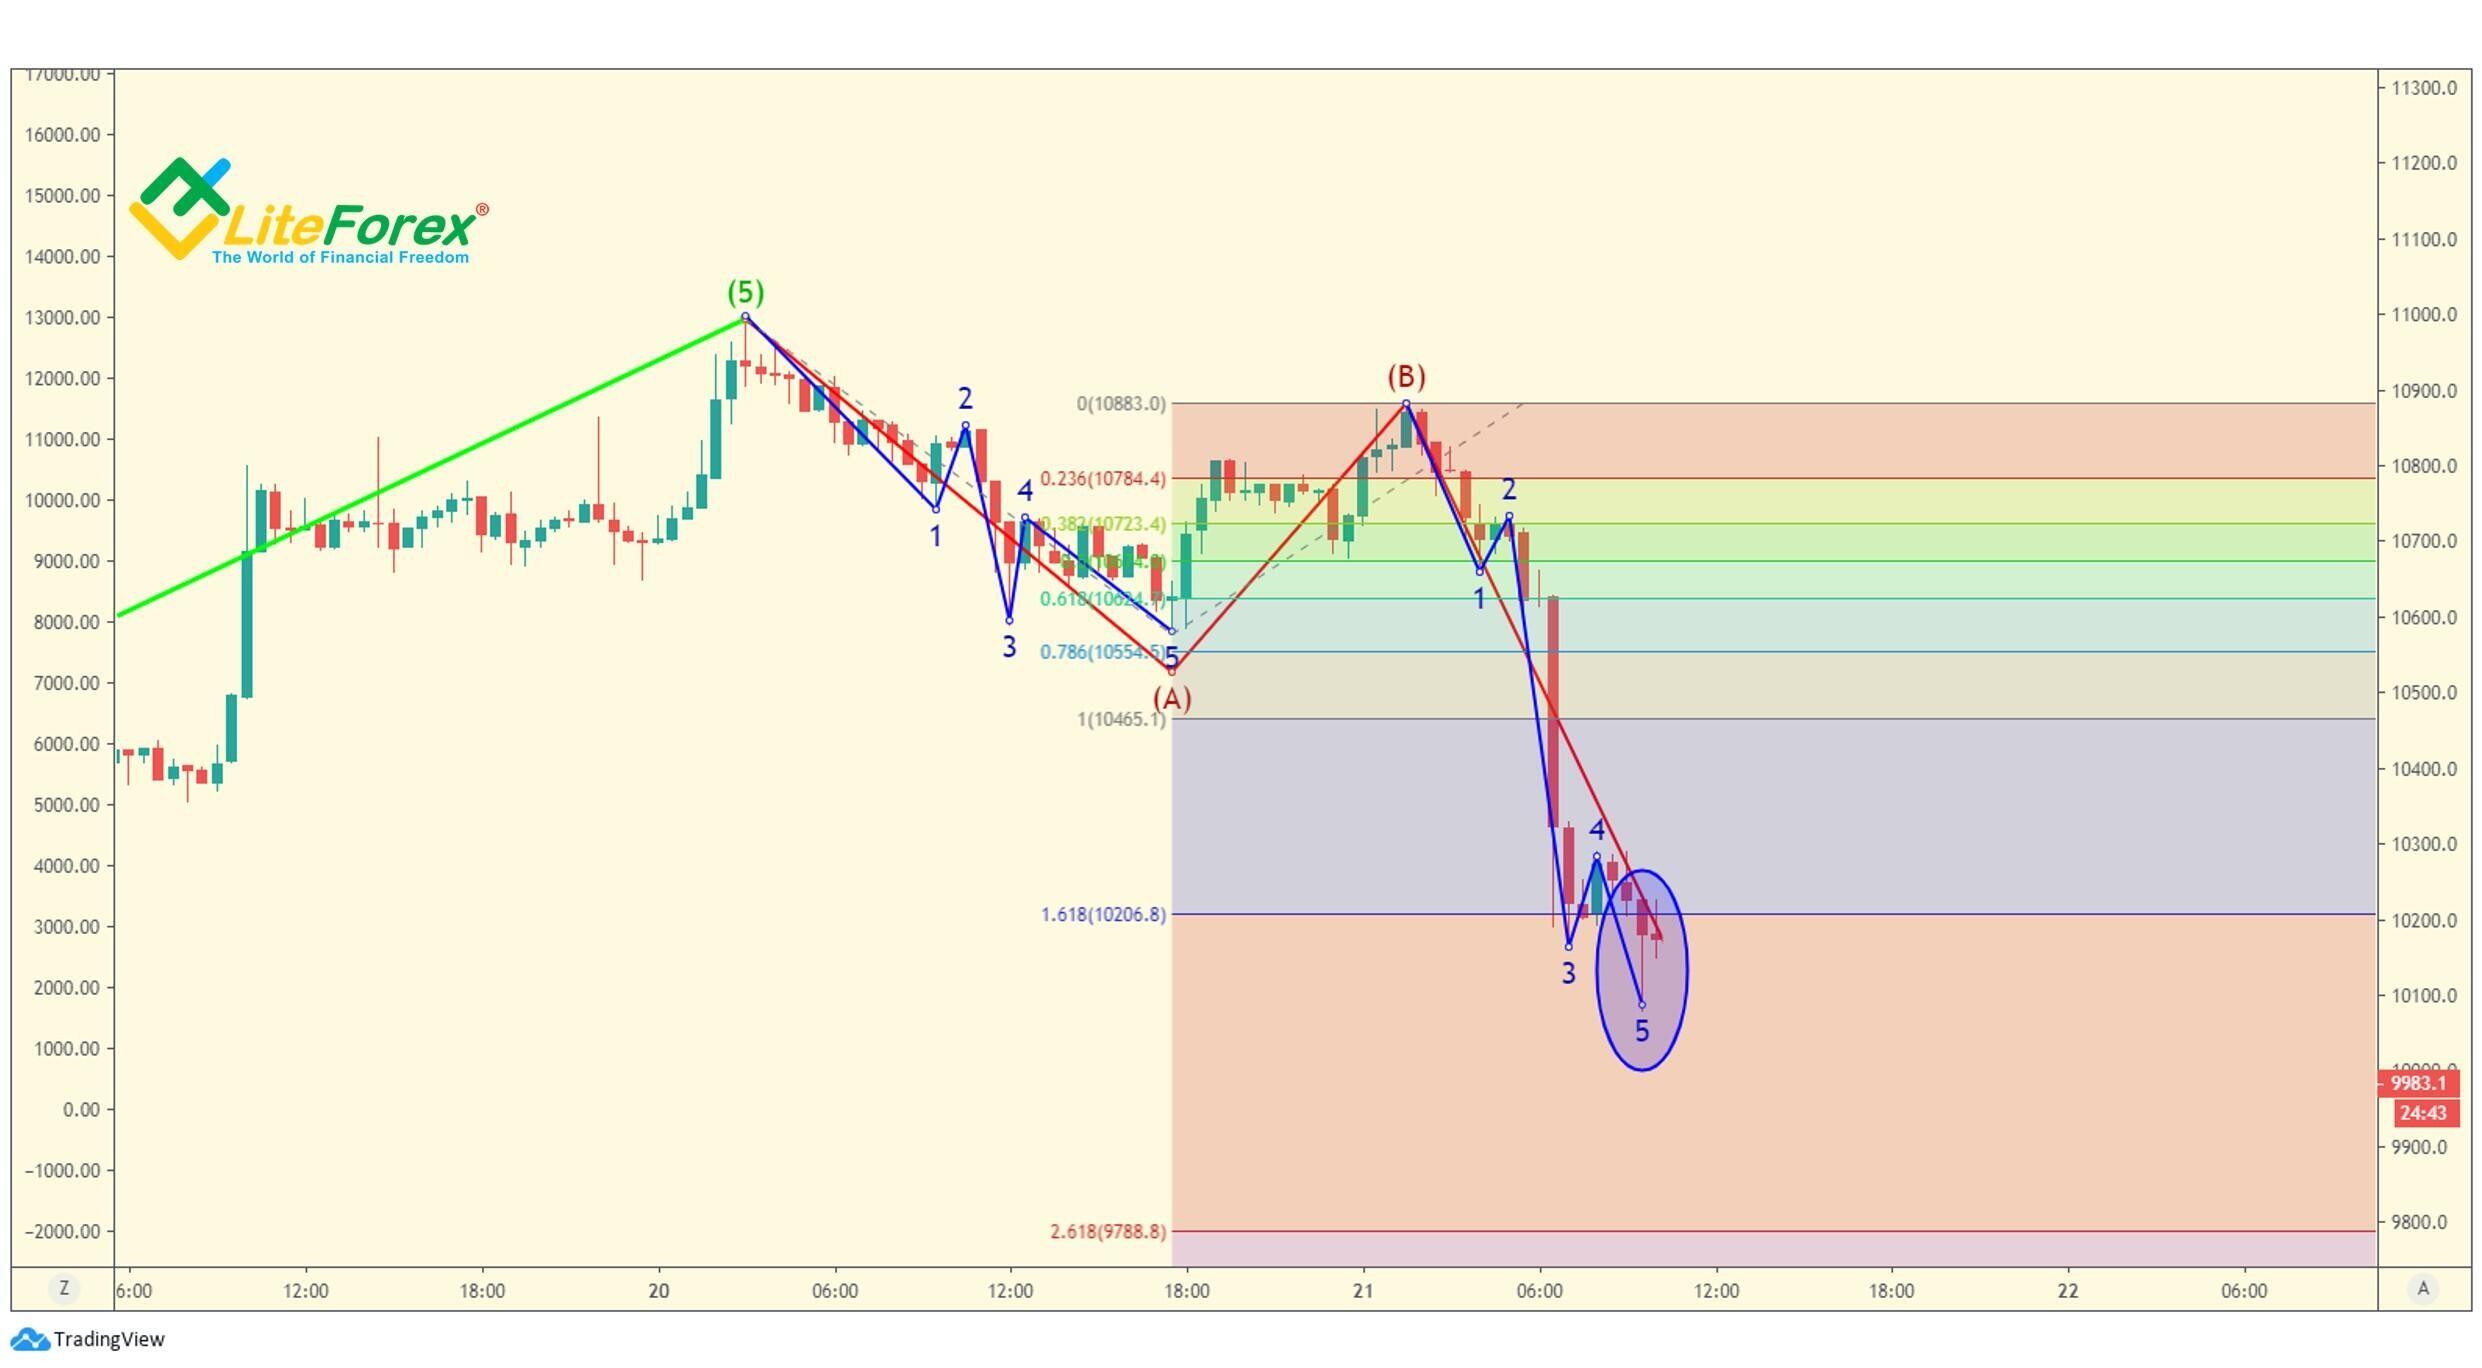
The first point, which we should check for the potential end of the C wave, is marked by a blue oval in the chart. By this time, there is a complete fifth wave, and the C wave itself crosses 1.618 (this is the ratio, in which waves A and C relate to each other).
In fact, at the expected peak of the C wave, there is a down fractal, squatting (pink) bar on the Market Facilitation Index. Also, the MFI is in the oversold area, which usually occurs at termination stages of a down move.
The only inconsistencies are the likely extension of the C wave, and the MACD is in the red area, although it is tending to the green one. So, we exit three shorts of the four. The remaining short is left in case the down movement still goes on.
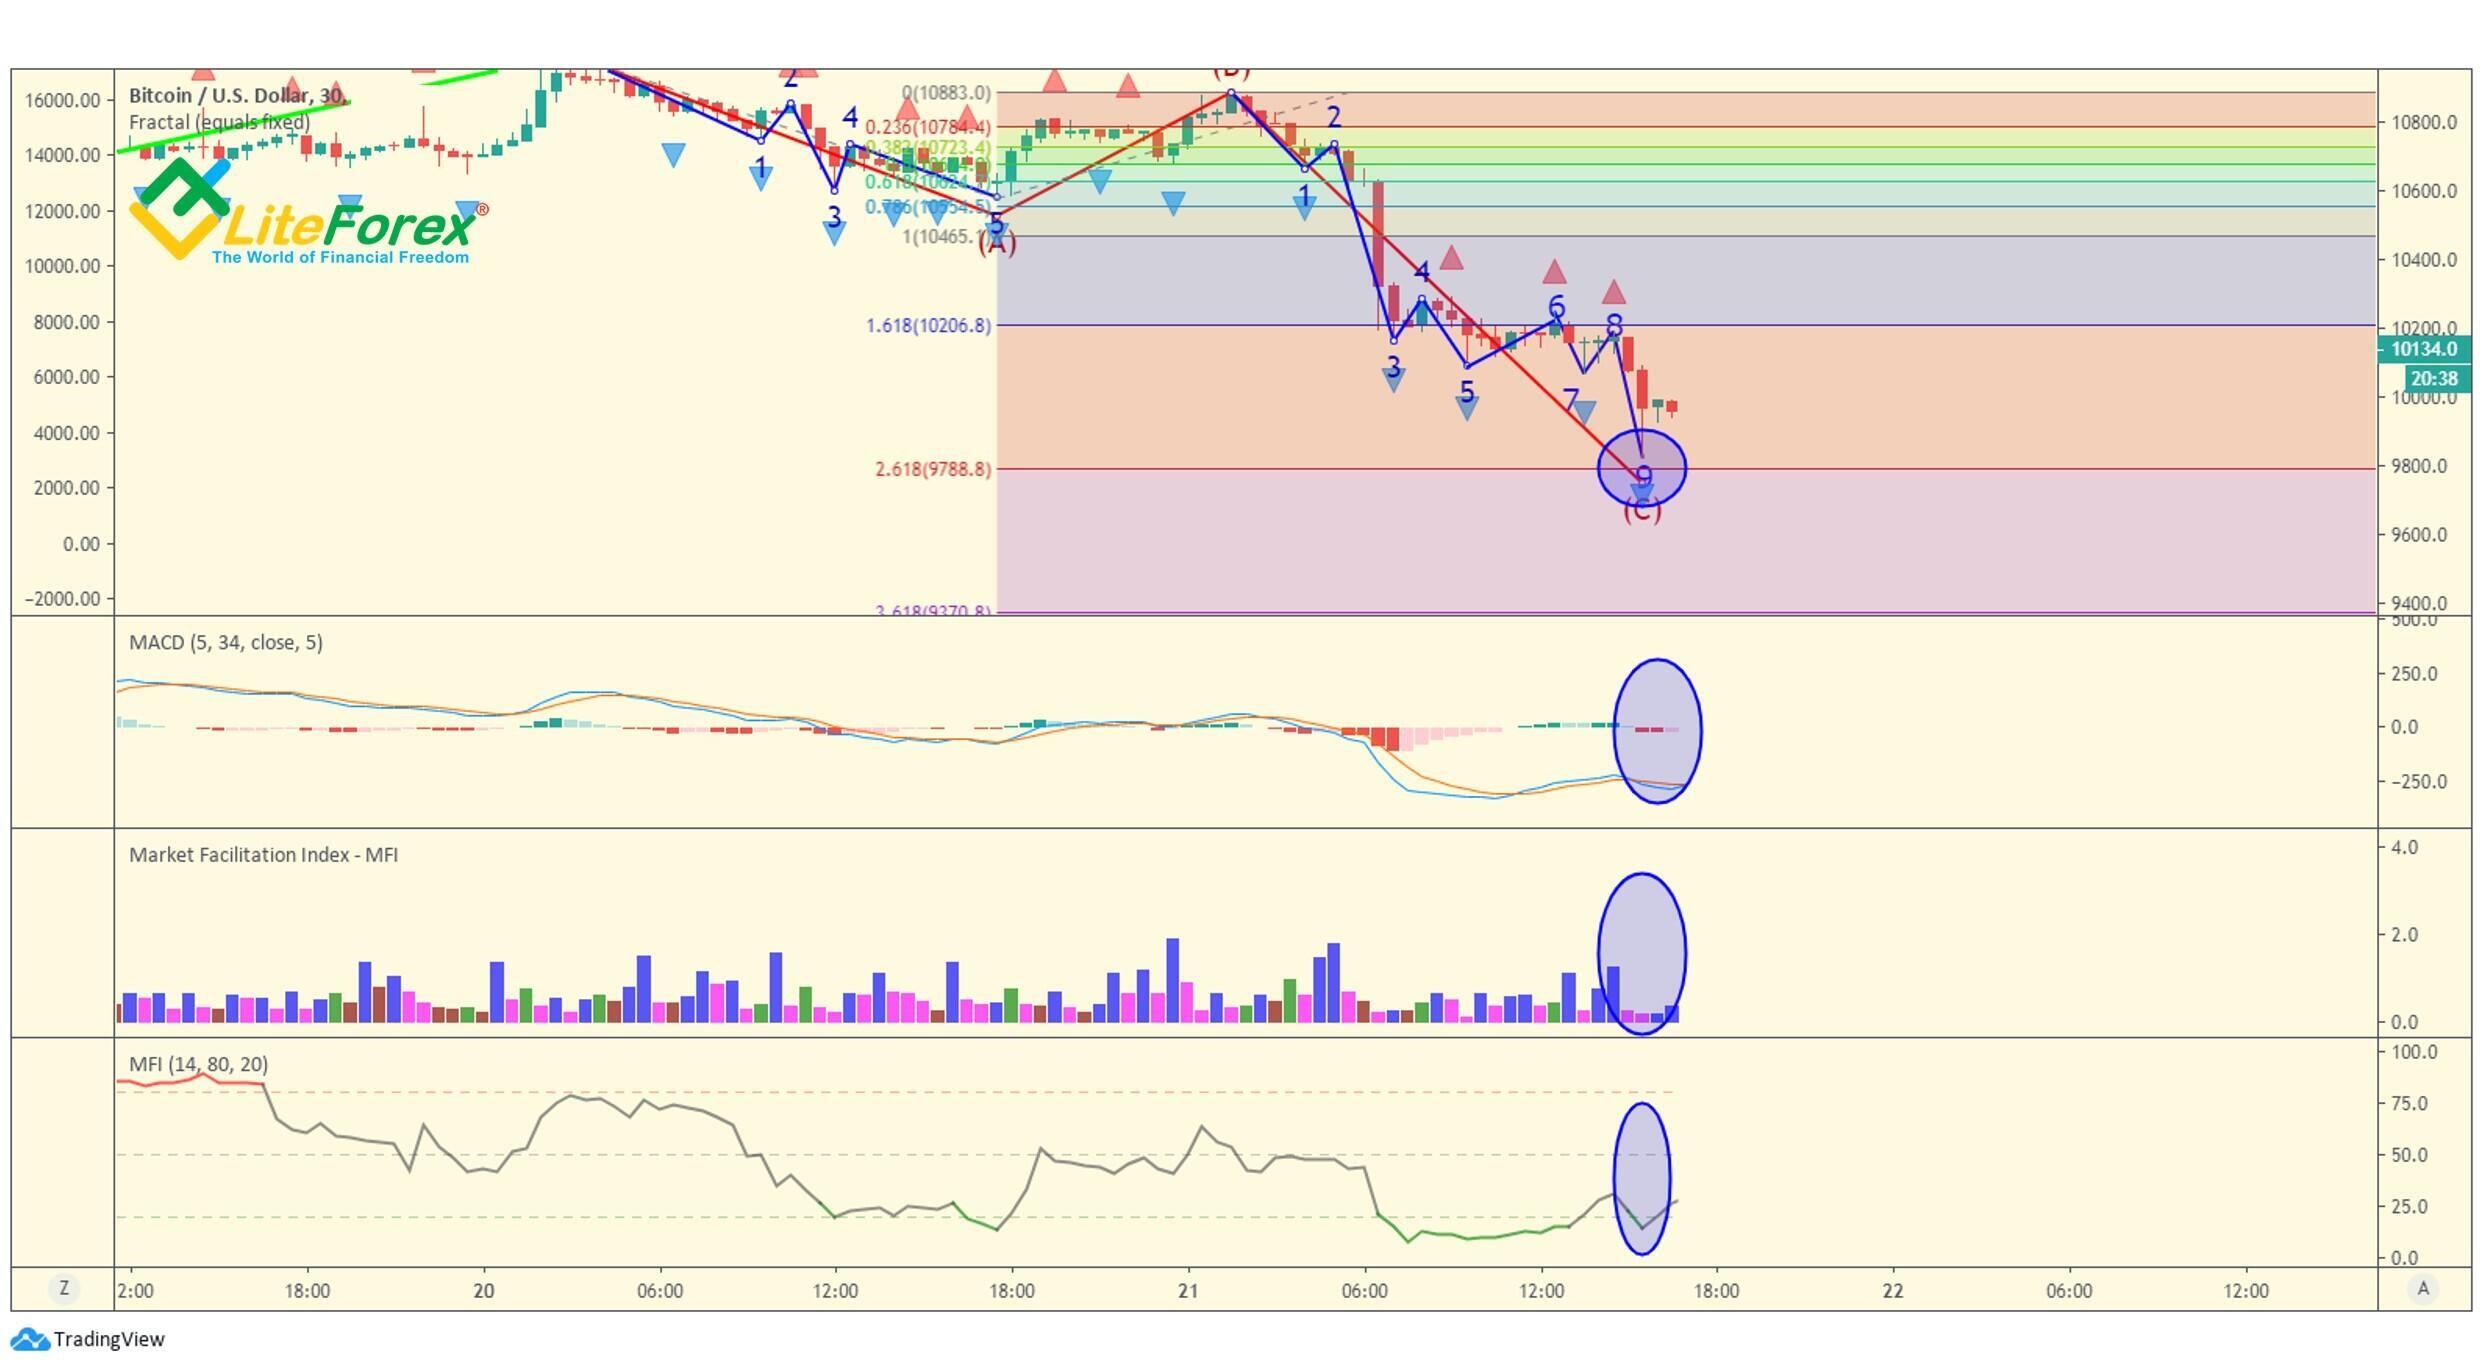
As it turns out later, we have been right leaving one short in the market. The C wave continued developing and completed as a full nine-wave pattern that runs through level 2.618 (marked with a blue oval). However, such long corrective waves are very rare.
As for indicators, they signal the same situation as it was in the fifth sub-wave of the impulse. There is a fractal, a little late shift of the MACD into the zero zone from the red one, two squatting bars, and the MFI shift into the oversold zone. All this signals that the current bar is the endpoint of the corrective zigzag. So, we close the rest of the position and expect next wave formations.
That is all for today. The new Elliott wave strategy to trade cryptocurrency is complete. In practice, I also use Tom DeMark's range projections and differential arrows. The combination of all these tools provides an excellent forecast with great accuracy if execution and good entry/exit points according to money management. A good example of practical use of this strategy is here The Best Dow Jones Shares: Sell or Buy?
Nonetheless, I still want to stress that trading is always associated with a risk to lose all the invested money, and no strategy can 100% guarantee success. My articles are published for solely educational purposes, they are not trading recommendations or financial advice. You take all trading decisions independently and you are responsible.
Take care of yourself and your money!
I wish you good luck and good profits!
P.S. Did you like my article? Share it in social networks: it will be the best "thank you" :)
Useful links:
- I recommend trying to trade with a reliable broker here. The system allows you to trade by yourself or copy successful traders from all across the globe.
- Use my promo code BLOG to get a 50% deposit bonus on the LiteFinance platform. Simply enter this code in the appropriate field when funding your trading account.
- Telegram chat for traders: https://t.me/litefinancebrokerchat. We are sharing the signals and trading experience.
- Telegram channel with high-quality analytics, Forex reviews, training articles, and other useful things for traders https://t.me/litefinance
The content of this article reflects the author’s opinion and does not necessarily reflect the official position of LiteFinance broker. The material published on this page is provided for informational purposes only and should not be considered as the provision of investment advice for the purposes of Directive 2014/65/EU.
According to copyright law, this article is considered intellectual property, which includes a prohibition on copying and distributing it without consent.