Cryptocurrency trading strategy based on the Elliott wave studies by Bill Williams and Robert Prechter
Dear friends!
I have given a detailed description of the Elliot Wave principle in the interpretation of Bill Williams and Robert Prechter. If you haven’t read those articles or have forgotten theory, I recommend you get familiar with the following materials:
Elliott Wave Theory according to Bill Williams (Part 1and Part 2),
Elliott Wave Theory according to Robert Prechter (Part 1and Part 2, Part 3, Part 4, and part 5).
This post starts a series of articles devoted to my own trading strategy that I developed based on the three tools offered by the two authors I mentioned above. I want to note at the beginning that I write this material for solely educational purposes. Trading with this strategy doesn’t guarantee a profit. If you decide to trade with this strategy, you should understand that this is your responsibility.
Going back to the previous articles, my own experience proves that Williams developed a highly efficient tool to identify the trend pivot point, he called it Five Bullets; he also gave detailed instructions on the trading algorithm and money management. Prechter went deep into studying the wave structures that should be taken into account when interpreting the price charts.
So, I extracted the most important information from these two approaches and decided to develop a cryptocurrency trading strategy based on this material. I will describe it in the process of analyzing a few impulse waves and corrections used as an example. I will also describe the tools I chose for the analysis. Well, let’s get down to business.
Identify a zero point
Williams and Prechter agree that the analysis of any wave or wave-pattern starts with the identification of their starting or zero points. To do this, we need to learn how to determine the end of corrections.
At the first stage, you need to at least approximately identify the structure of previous impulse waves and corrections.
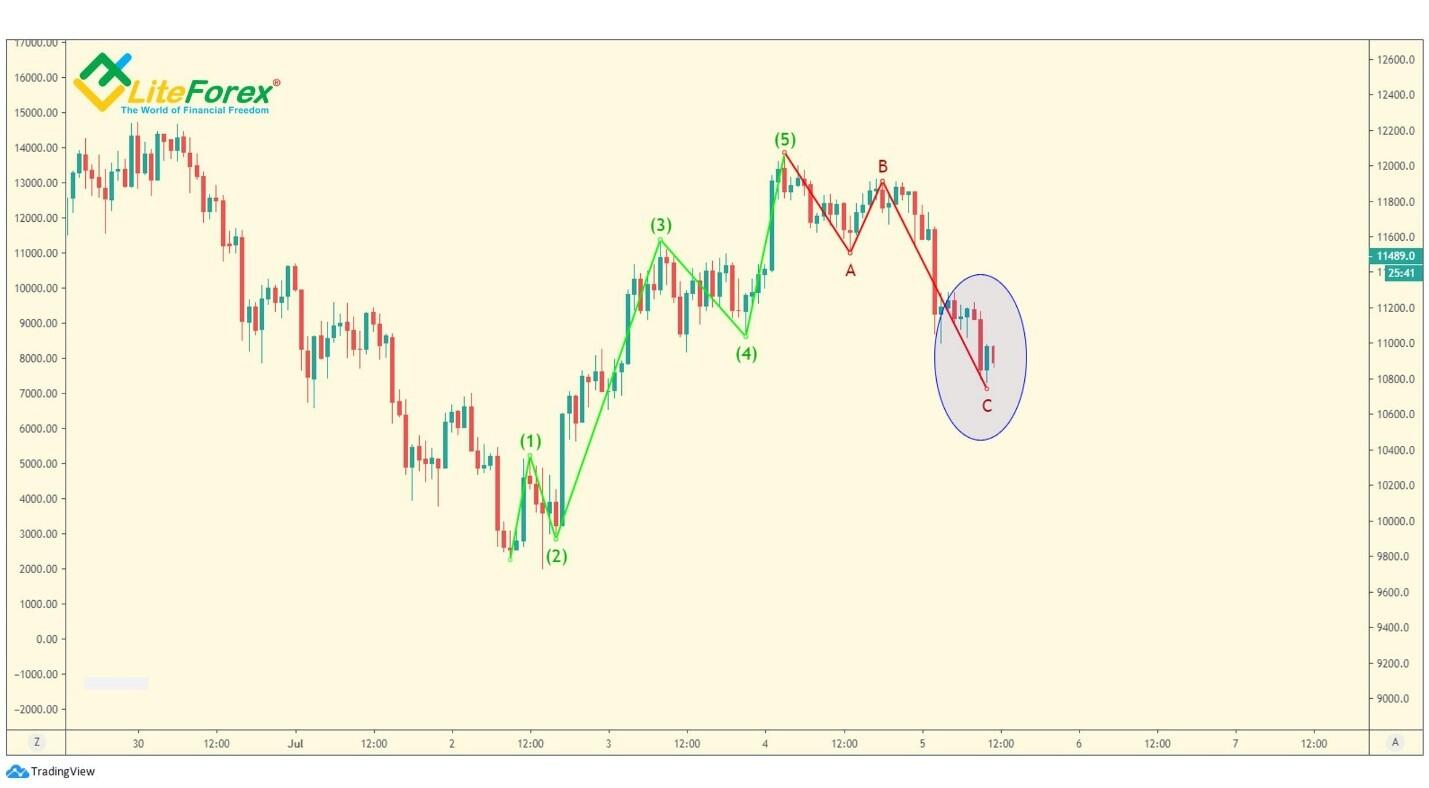
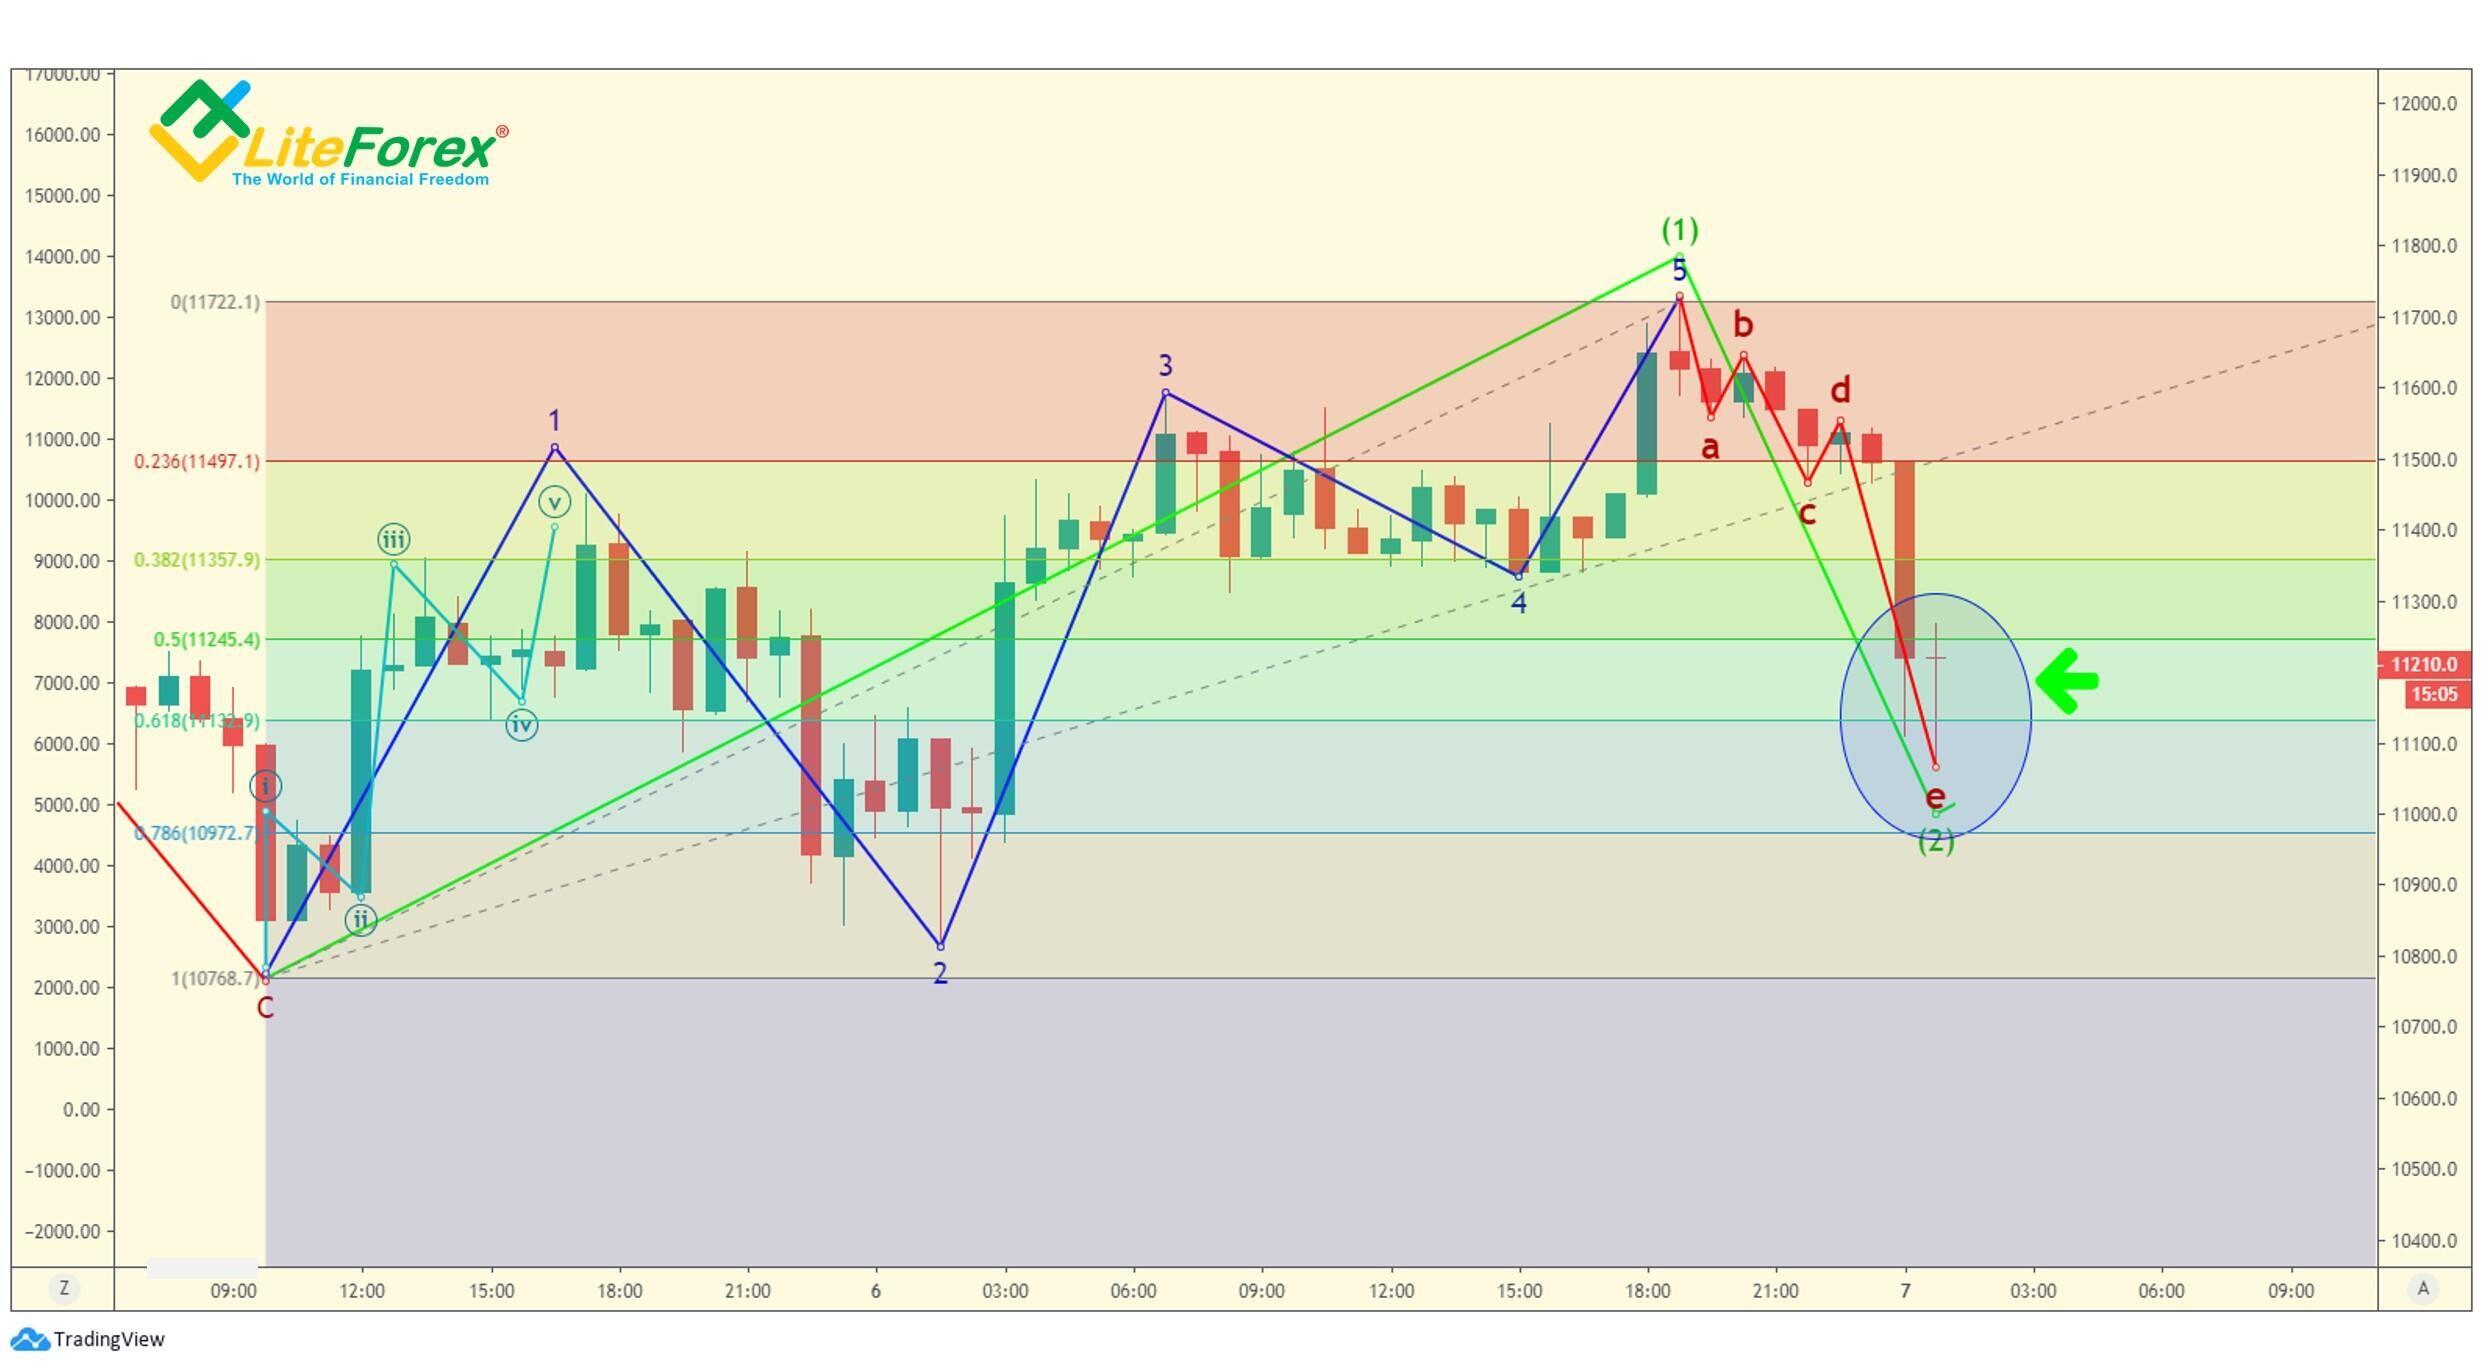
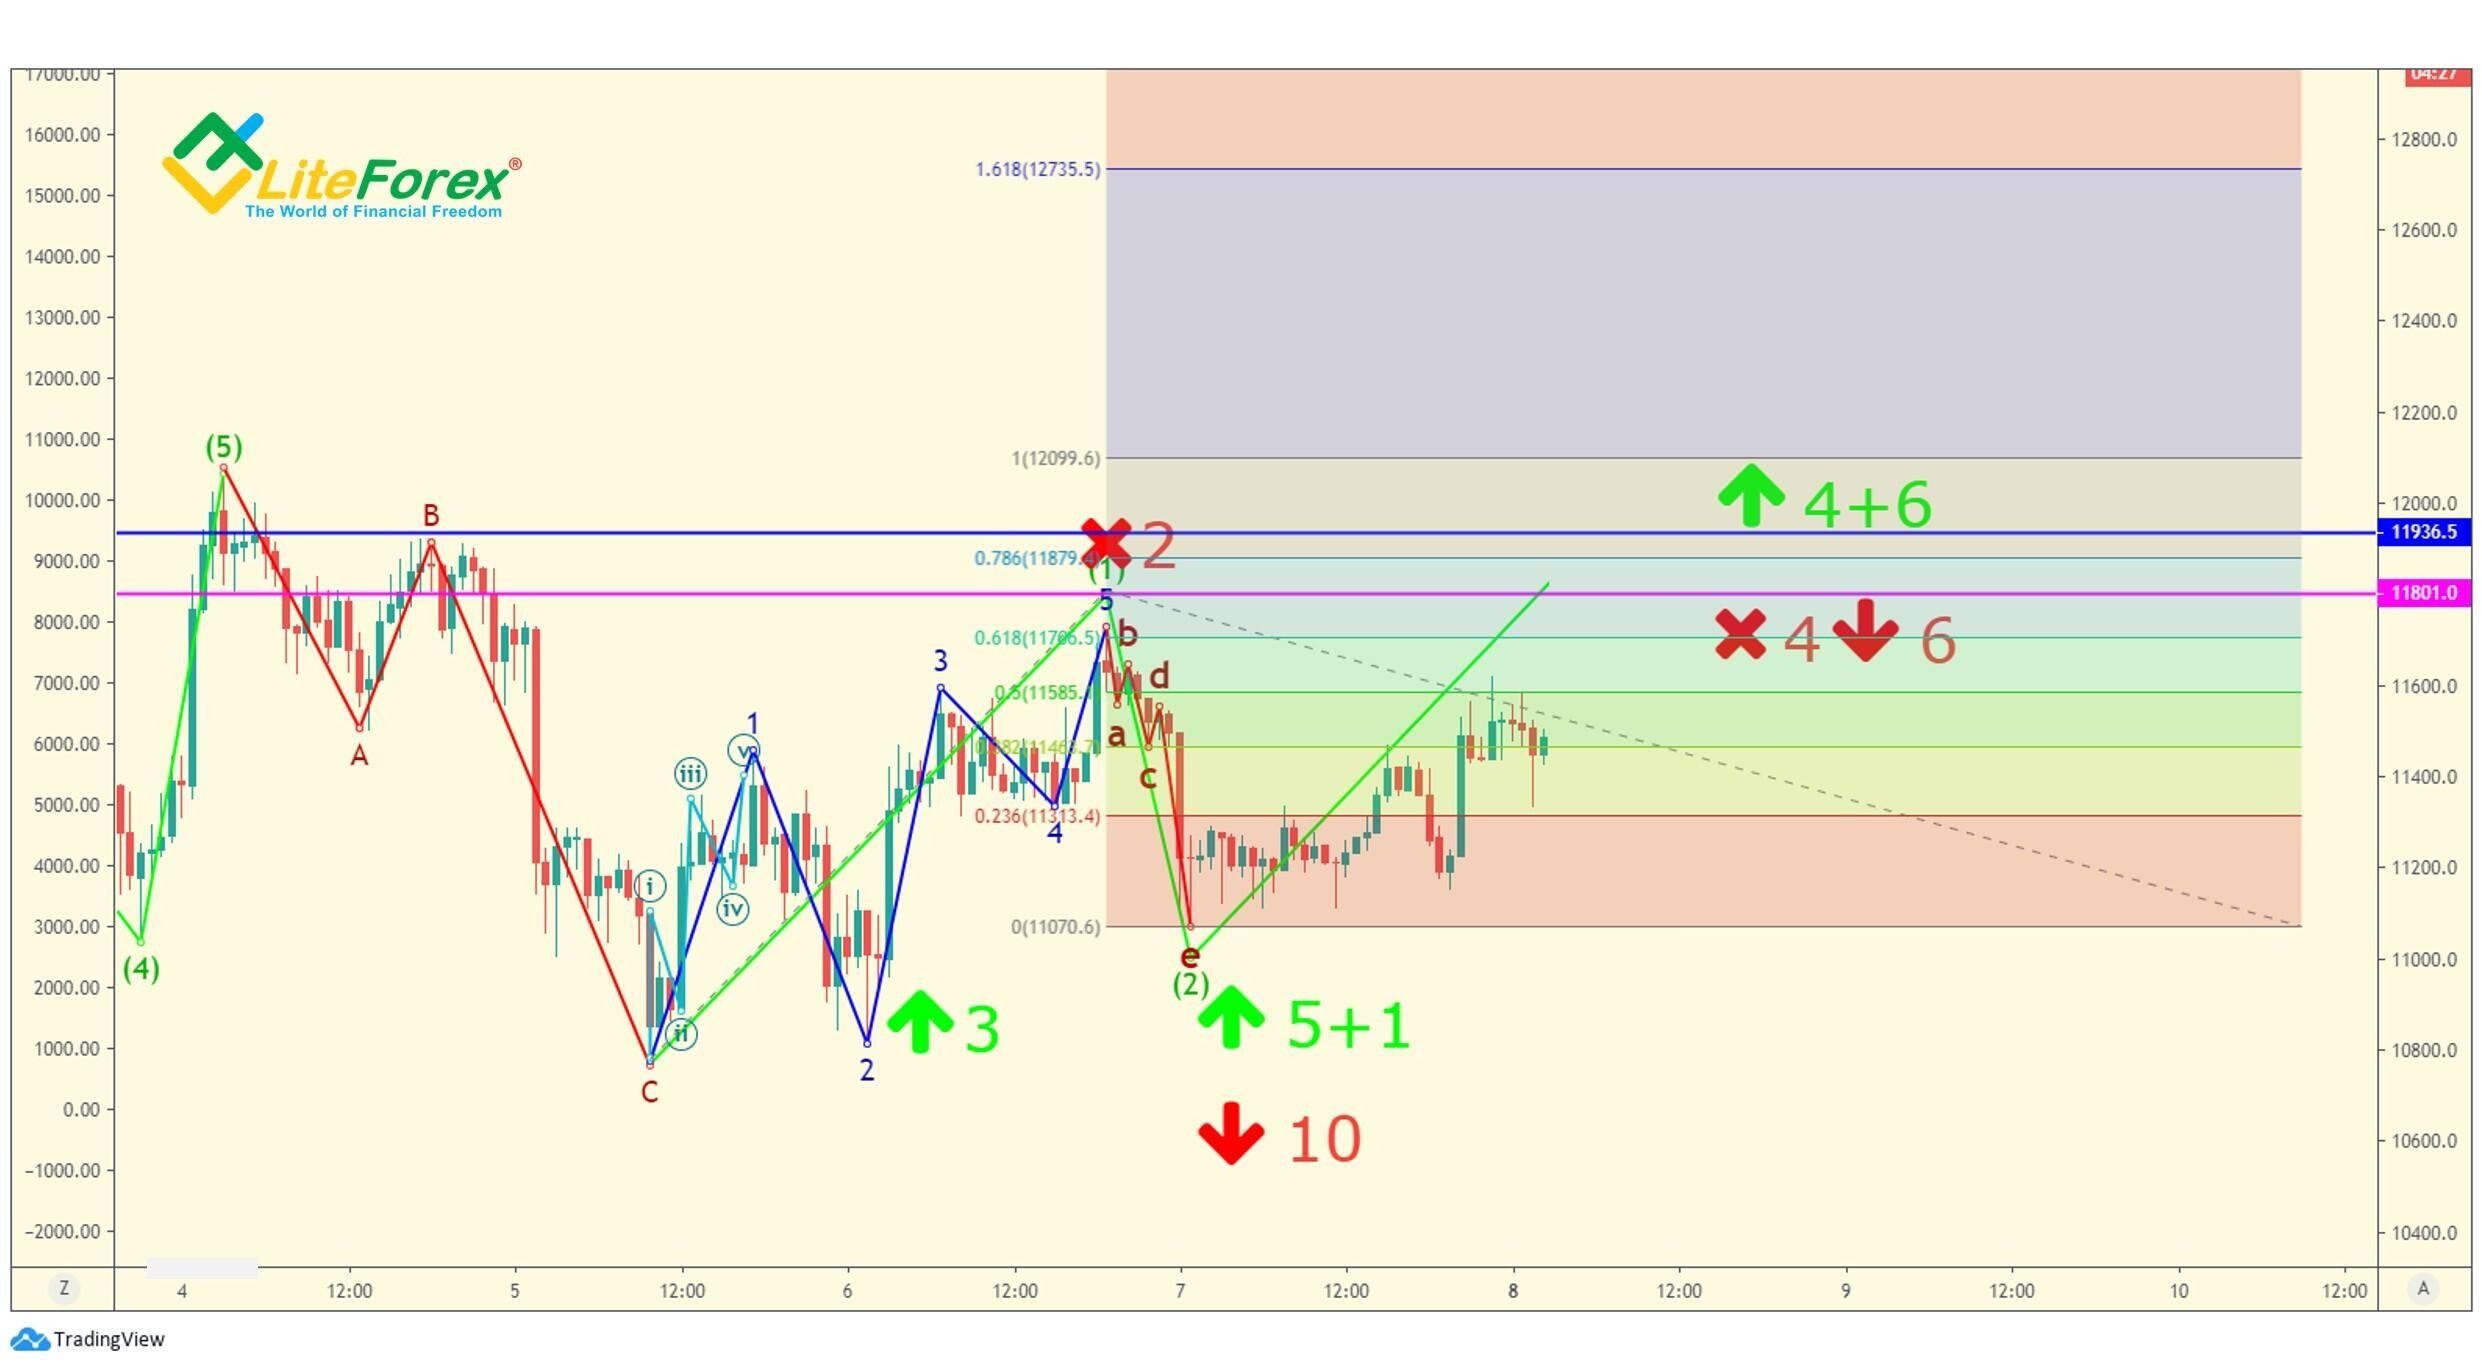
The hourly BTCUSD price chart displays a probable zero-point marked with a blue oval. Having analyzed visually the previous bars, we see that the last bearish trend looks like a correction in the form of a plain zigzag. The preceding bullish trend is a normal five-wave sequence with the extended third wave.
Next, to accurately determine the zero point, we will use the five bullets described by Williams. I will briefly remind you:
- The candlestick that makes an extreme is in the target zone.
- There is a divergence between the MFI indicator and the price (as an additional signal, it may enter the overbought/oversold zone).
- There is a fractal at the extreme point.
- There is a squat bar in the place of one of the three up or down bars (displayed by the Market Facilitation Index MFI
- There is a momentum change on the MACD indicator, the up momentum reverses down in the bullish market, and a down momentum reverses up in the bearish market.
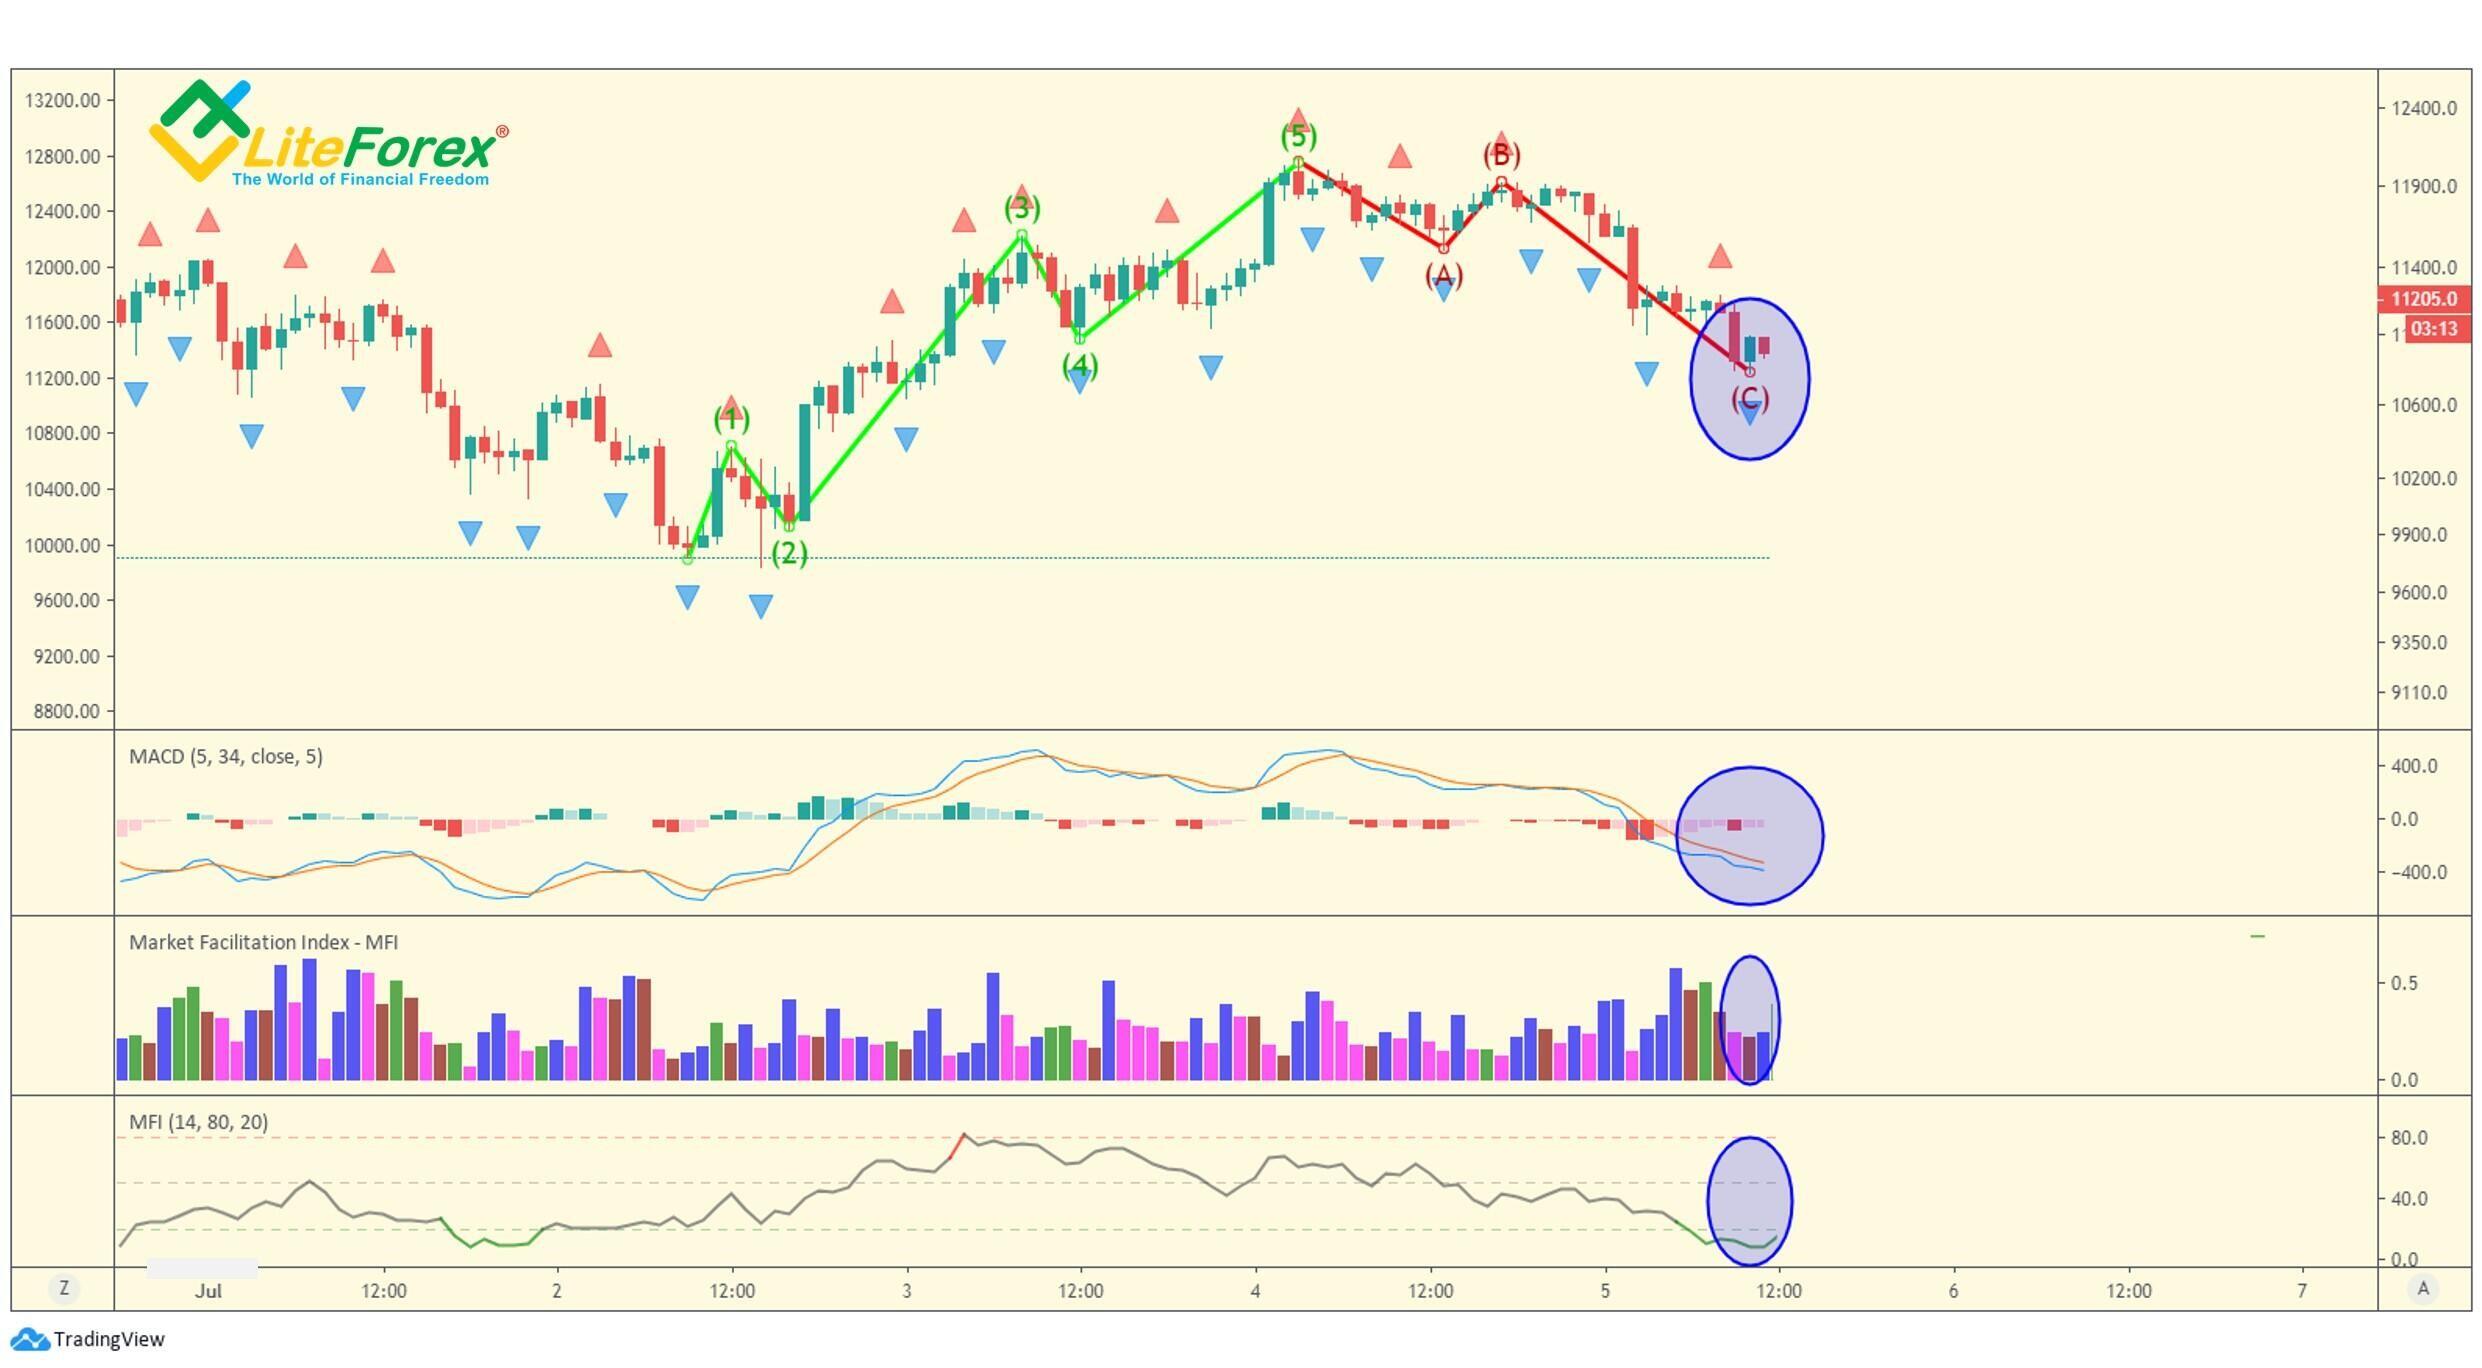
As there is a three-wave formation, not the five-wave one that shows the divergence right after the third wave and through the beginning of the fifth wave, we shall focus on the overbought or oversold zones. It will signal that the price is too low, and the bearish trend is exhausting.
The next signal is a fractal at the lowest point, marked with the blue up arrow. However, this signal is only indirect evidence that the interpretation is right because fractals emerge quite often in the chart.
One of the three bars of the assumed extreme is squatting. It corresponds to the pink bar of the Market Facilitation Index. It is followed by the withering bar (brown bar on the indicator, the second from the bottom line), which signals that the current price stops meeting expectations of most trader. It can also emerge at the Elliott waves’ peaks.
And, finally, the MAs of the MACD are meeting, and the indicator moves from the red zone to the green one, which signals that the bullish trend will soon start.
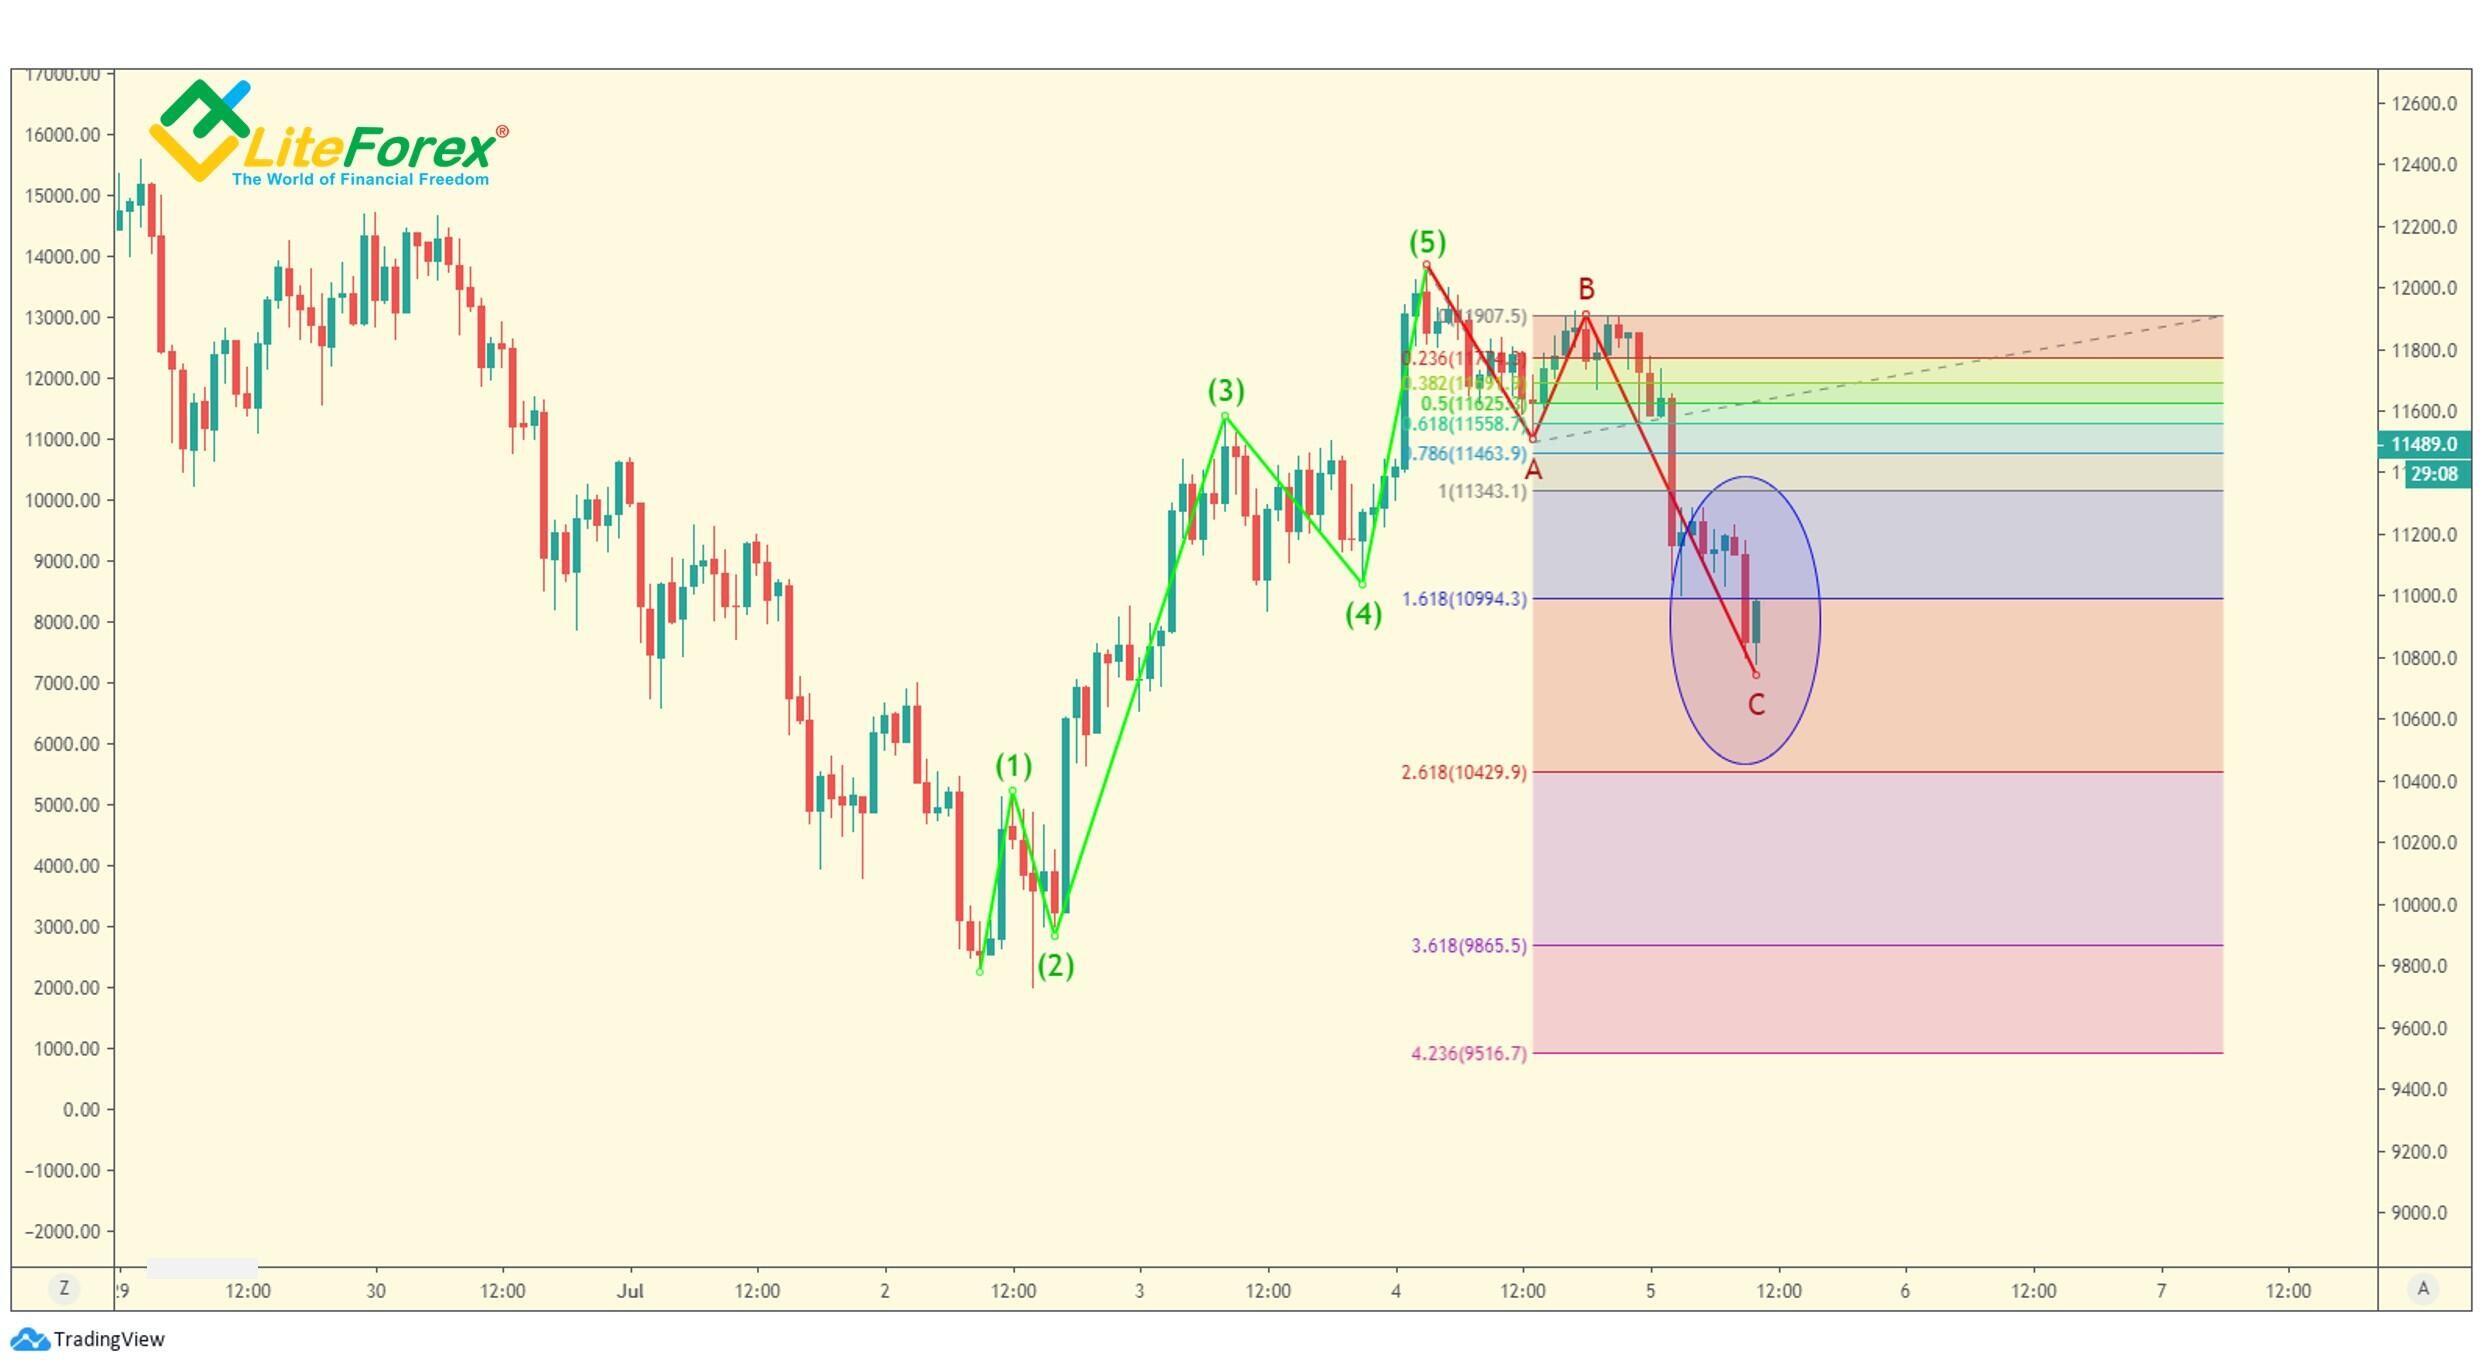
Now, let’s check if the bars are in the target zone. According to theories developed by Williams and Prechter, in a simple correction, the C wave should be 100%-161.8% of the A wave’s length. Sometimes it retraces the A wave of 61.8%. As you see from the chart, the length of the C wave is a little more than 161.8%, that may be because it is extended.
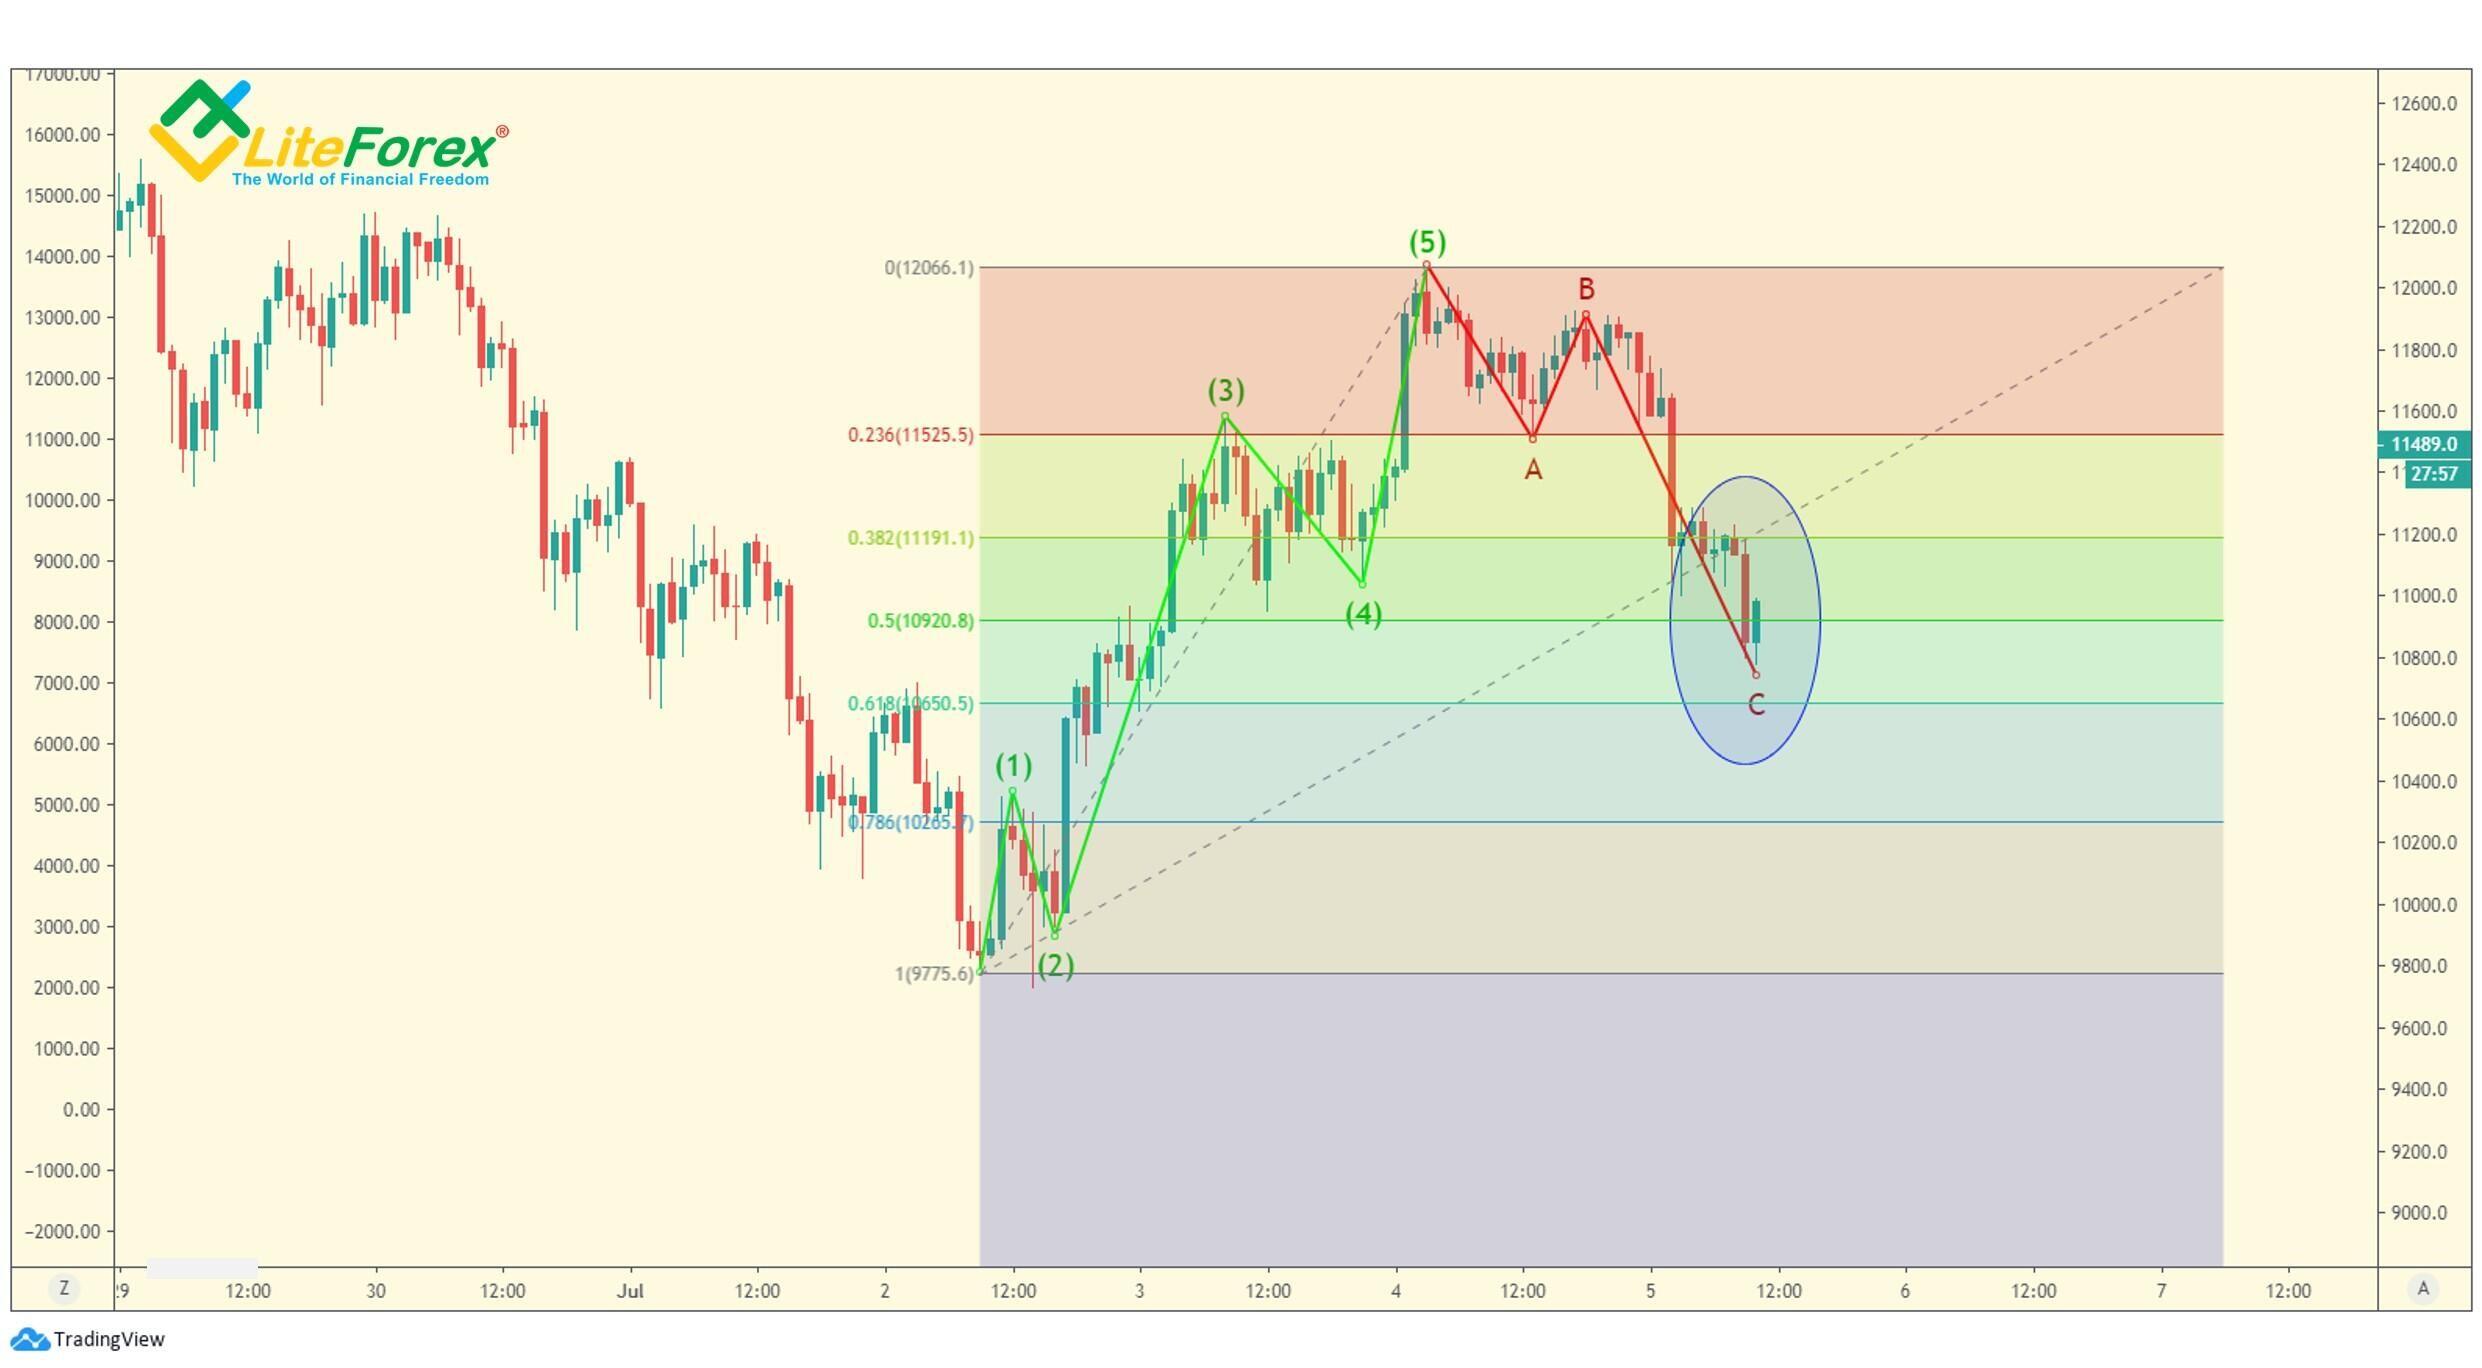
To check the accuracy of the price chart interpretation, we should calculate the relations between the corrections described by Robert Prechter. If you see a five-wave sequence as a single motive wave, the following sharp correction, a simple zigzag in our example, should be 50%-61.8% of the motive waves’ length. The presumed endpoint of the correction is between the retracement levels of 50% and 61.8%.
Therefore, we can conclude that the suggested point is the endpoint of the corrective zigzag.
Wave 1
It is rather risky to enter the market in the new trend at the first wave. It is most commonly very volatile, and it can be canceled, and the old trend may continue.
In this strategy, the first wave is used to confirm that there is a new five-wave sequence at its inception rather than the continuation of a complex correction. You can enter a trade only within a five-wave formation of a smaller degree, I will write about this a little later.
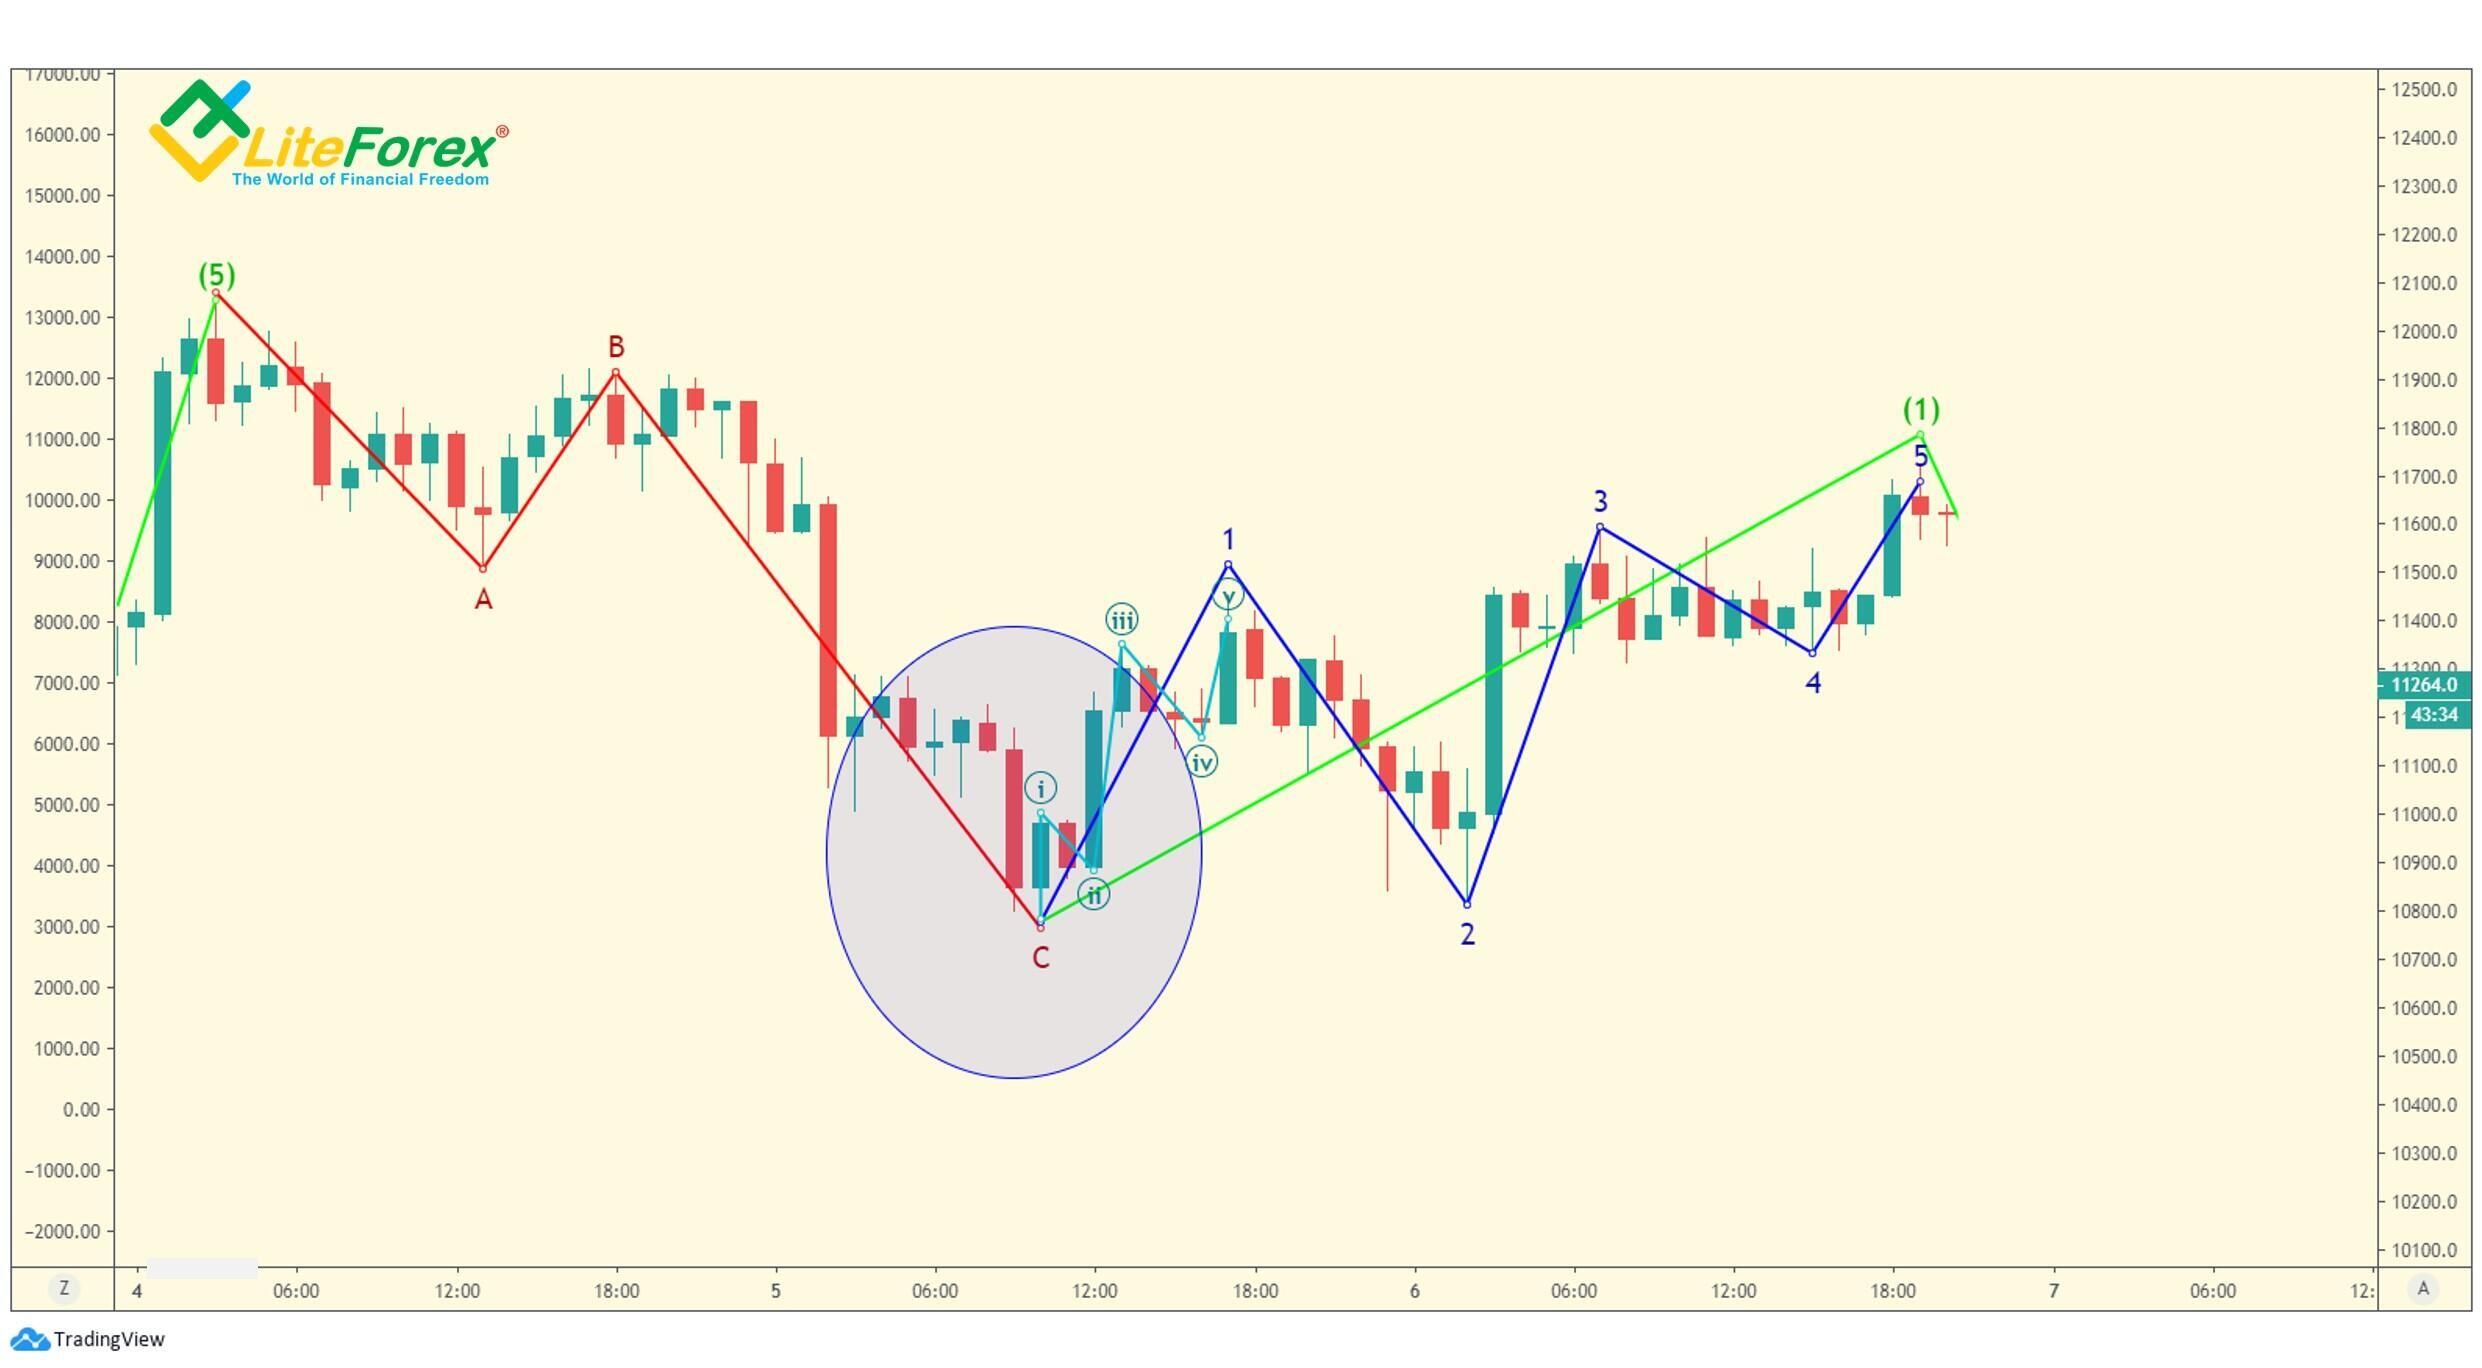
As you remember, any impulse is a five-wave sequence. We will use this feature to verify our assumptions. Wave (1), marked by the green line in the chart, can be easily divided into five waves of a smaller degree (marked by blue lines).
Besides, a sharp correction in the position of the sub-wave 2 may confuse, as you may think that the previous correction hasn’t finished yet. However, it is higher than the starting point, so it doesn’t break the principle of the impulse wave formation. There is a five-wave structure of wave 1 one degree lower, it is marked by turquoise lines. There is also a sideways correction in the positions of wave 4, following the correction in the place of wave 2. This meets the alternation principle (a sharp wave is followed by a flat). In total, this suggests that this is a normal five-wave sequence that corresponds to wave 1 one degree higher.
The next step is to identify the endpoint of wave one. We again use Williams’s five bullets. We also calculate the wave relations according to Prechter.
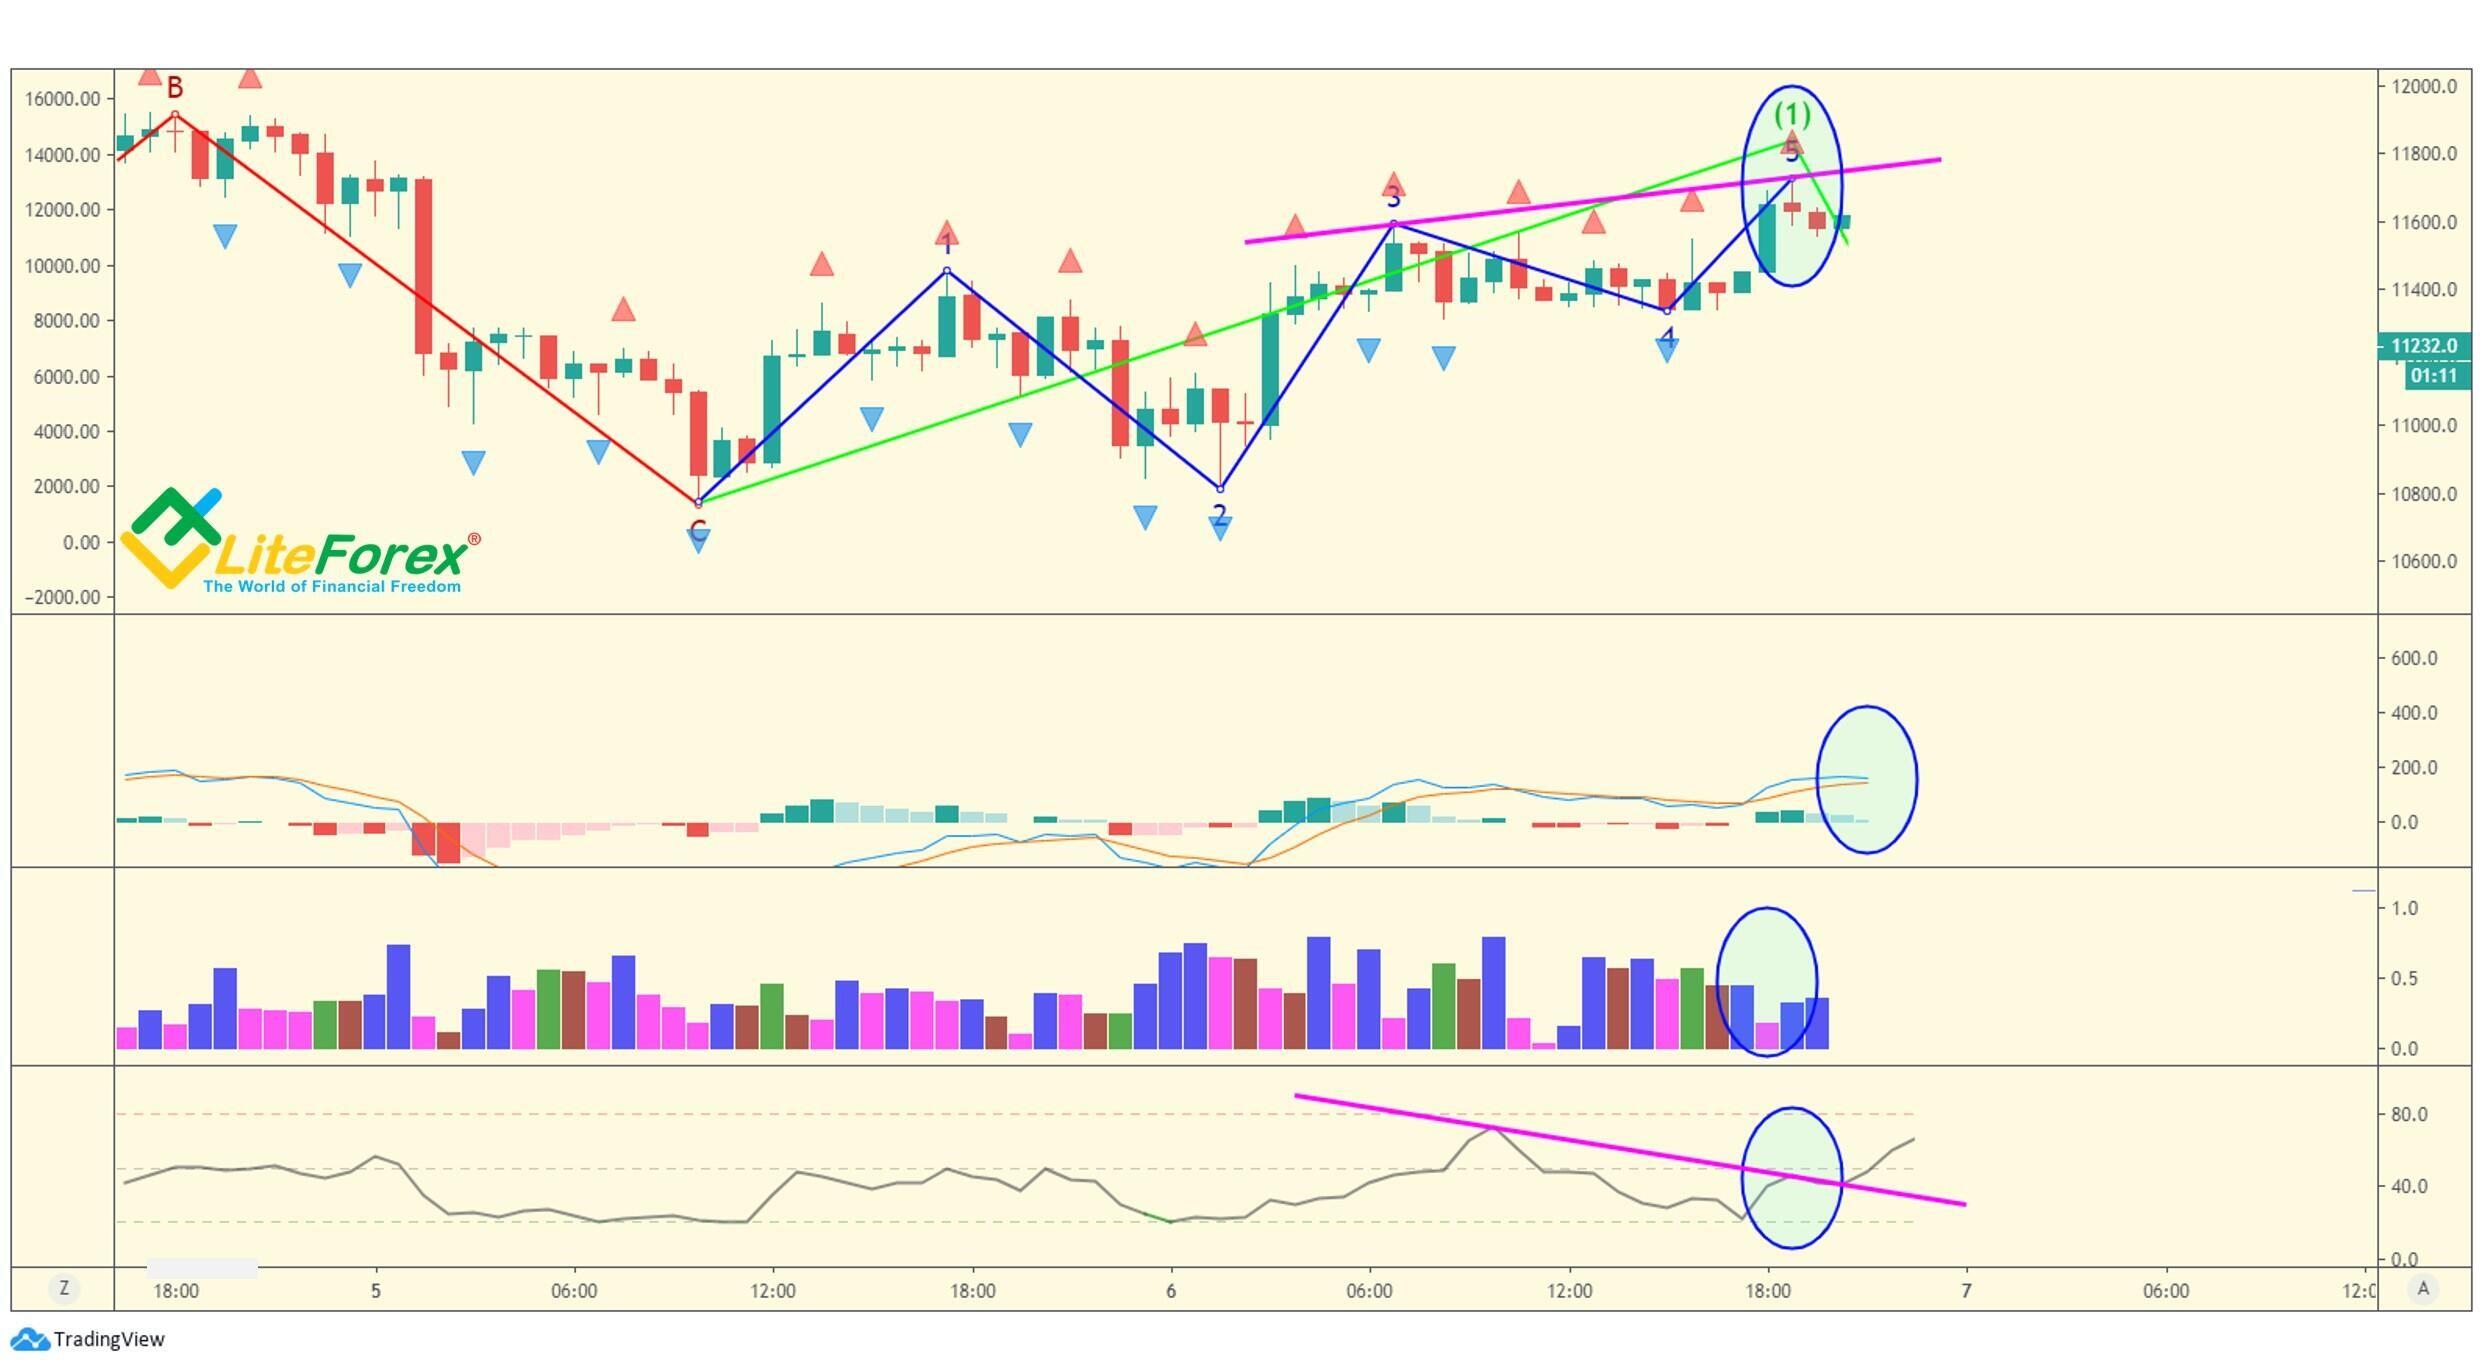
Well, there is a fractal in the chart, and the Market Facilitation Index displays a squatting bar close to the assumed extreme point. It is followed by a withering bar. The common MFI shows a divergence close to the fifth wave marked by pink lines.
The indicator is in the middle, around level 57.2. It can be explained by the too intensive step rise that can’t create the overbought condition. The MACD histogram goes from the green zone into the red one, but this signal is a little later. The MAs are also rounded, tending to cross the long-period one downside. All these signals together indicate that the bullish trend has exhausted.
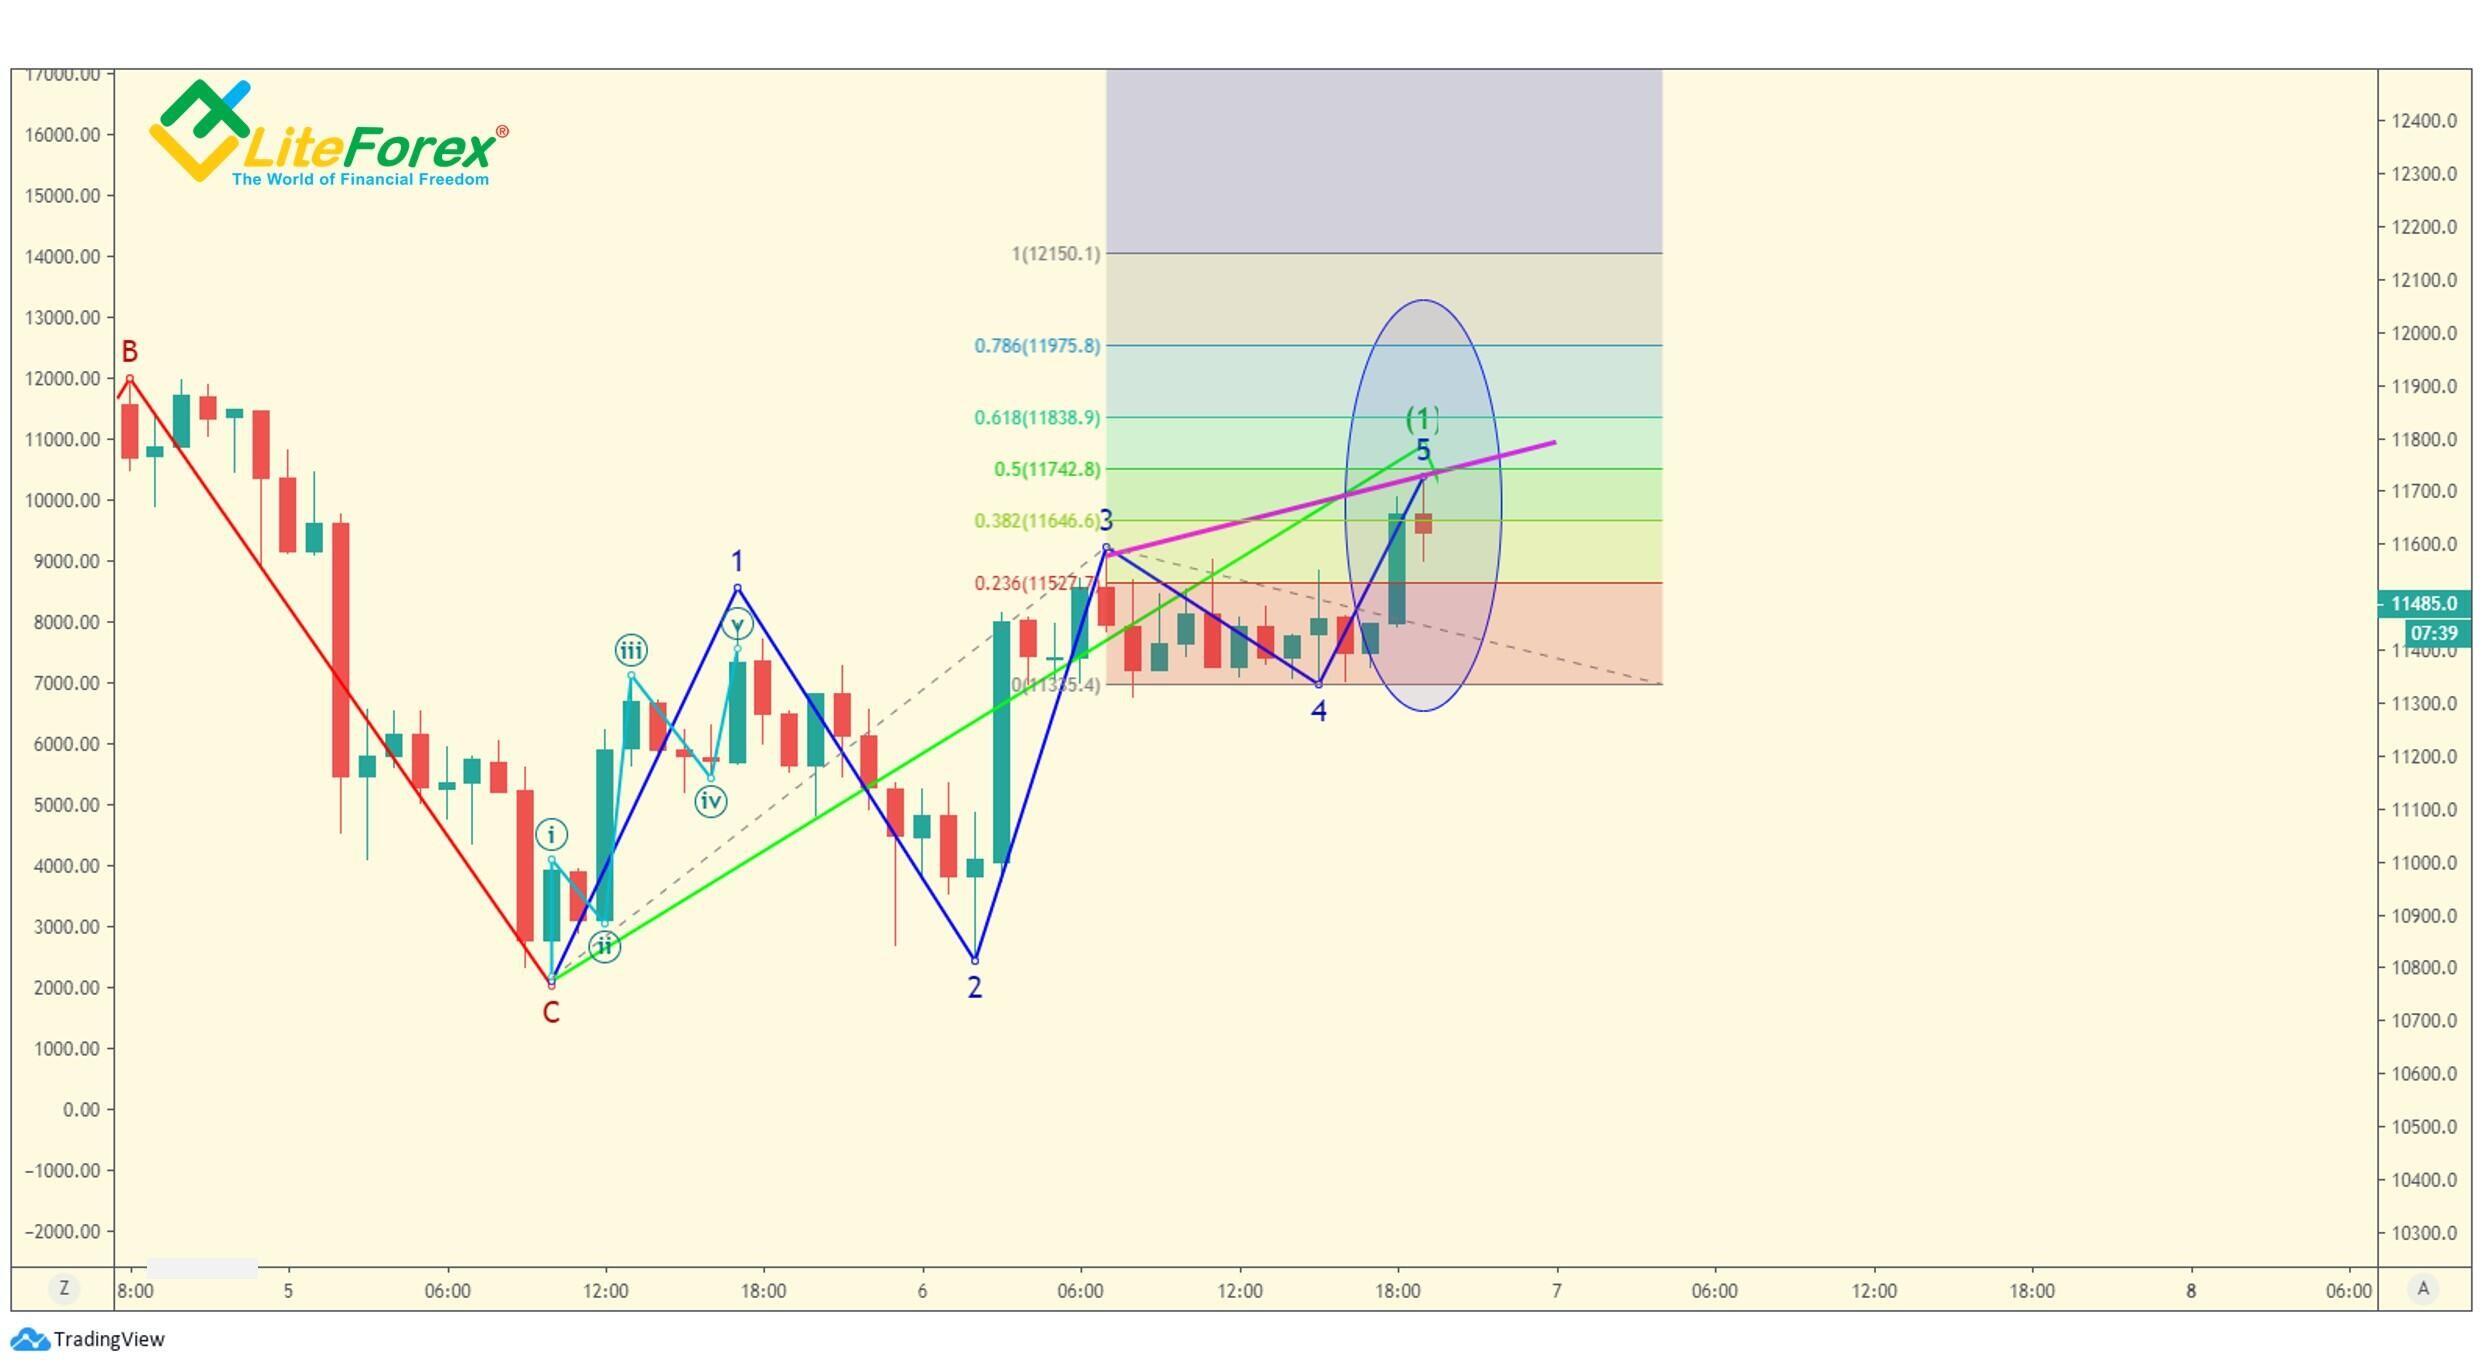
To calculate the target zone, we use a five-wave sequence of a lower degree, it is marked by blue lines in the chart. Williams thinks that the fifth wave’s length should be 61.8–100% of the total length of wave 3. However, as the structure is irregular in this case, a potential pivot point is at 50%. On rare occasions, it can be a resistance level where the trend reverses.
As an additional verification, we shall use the principle of wave relationships described by Robert Prechter. It says that that the end of wave four divides the formation according to the Golden Section. It means the distance from the start of the first wave to the termination point of wave 4 is 61.8% of the entire impulse.
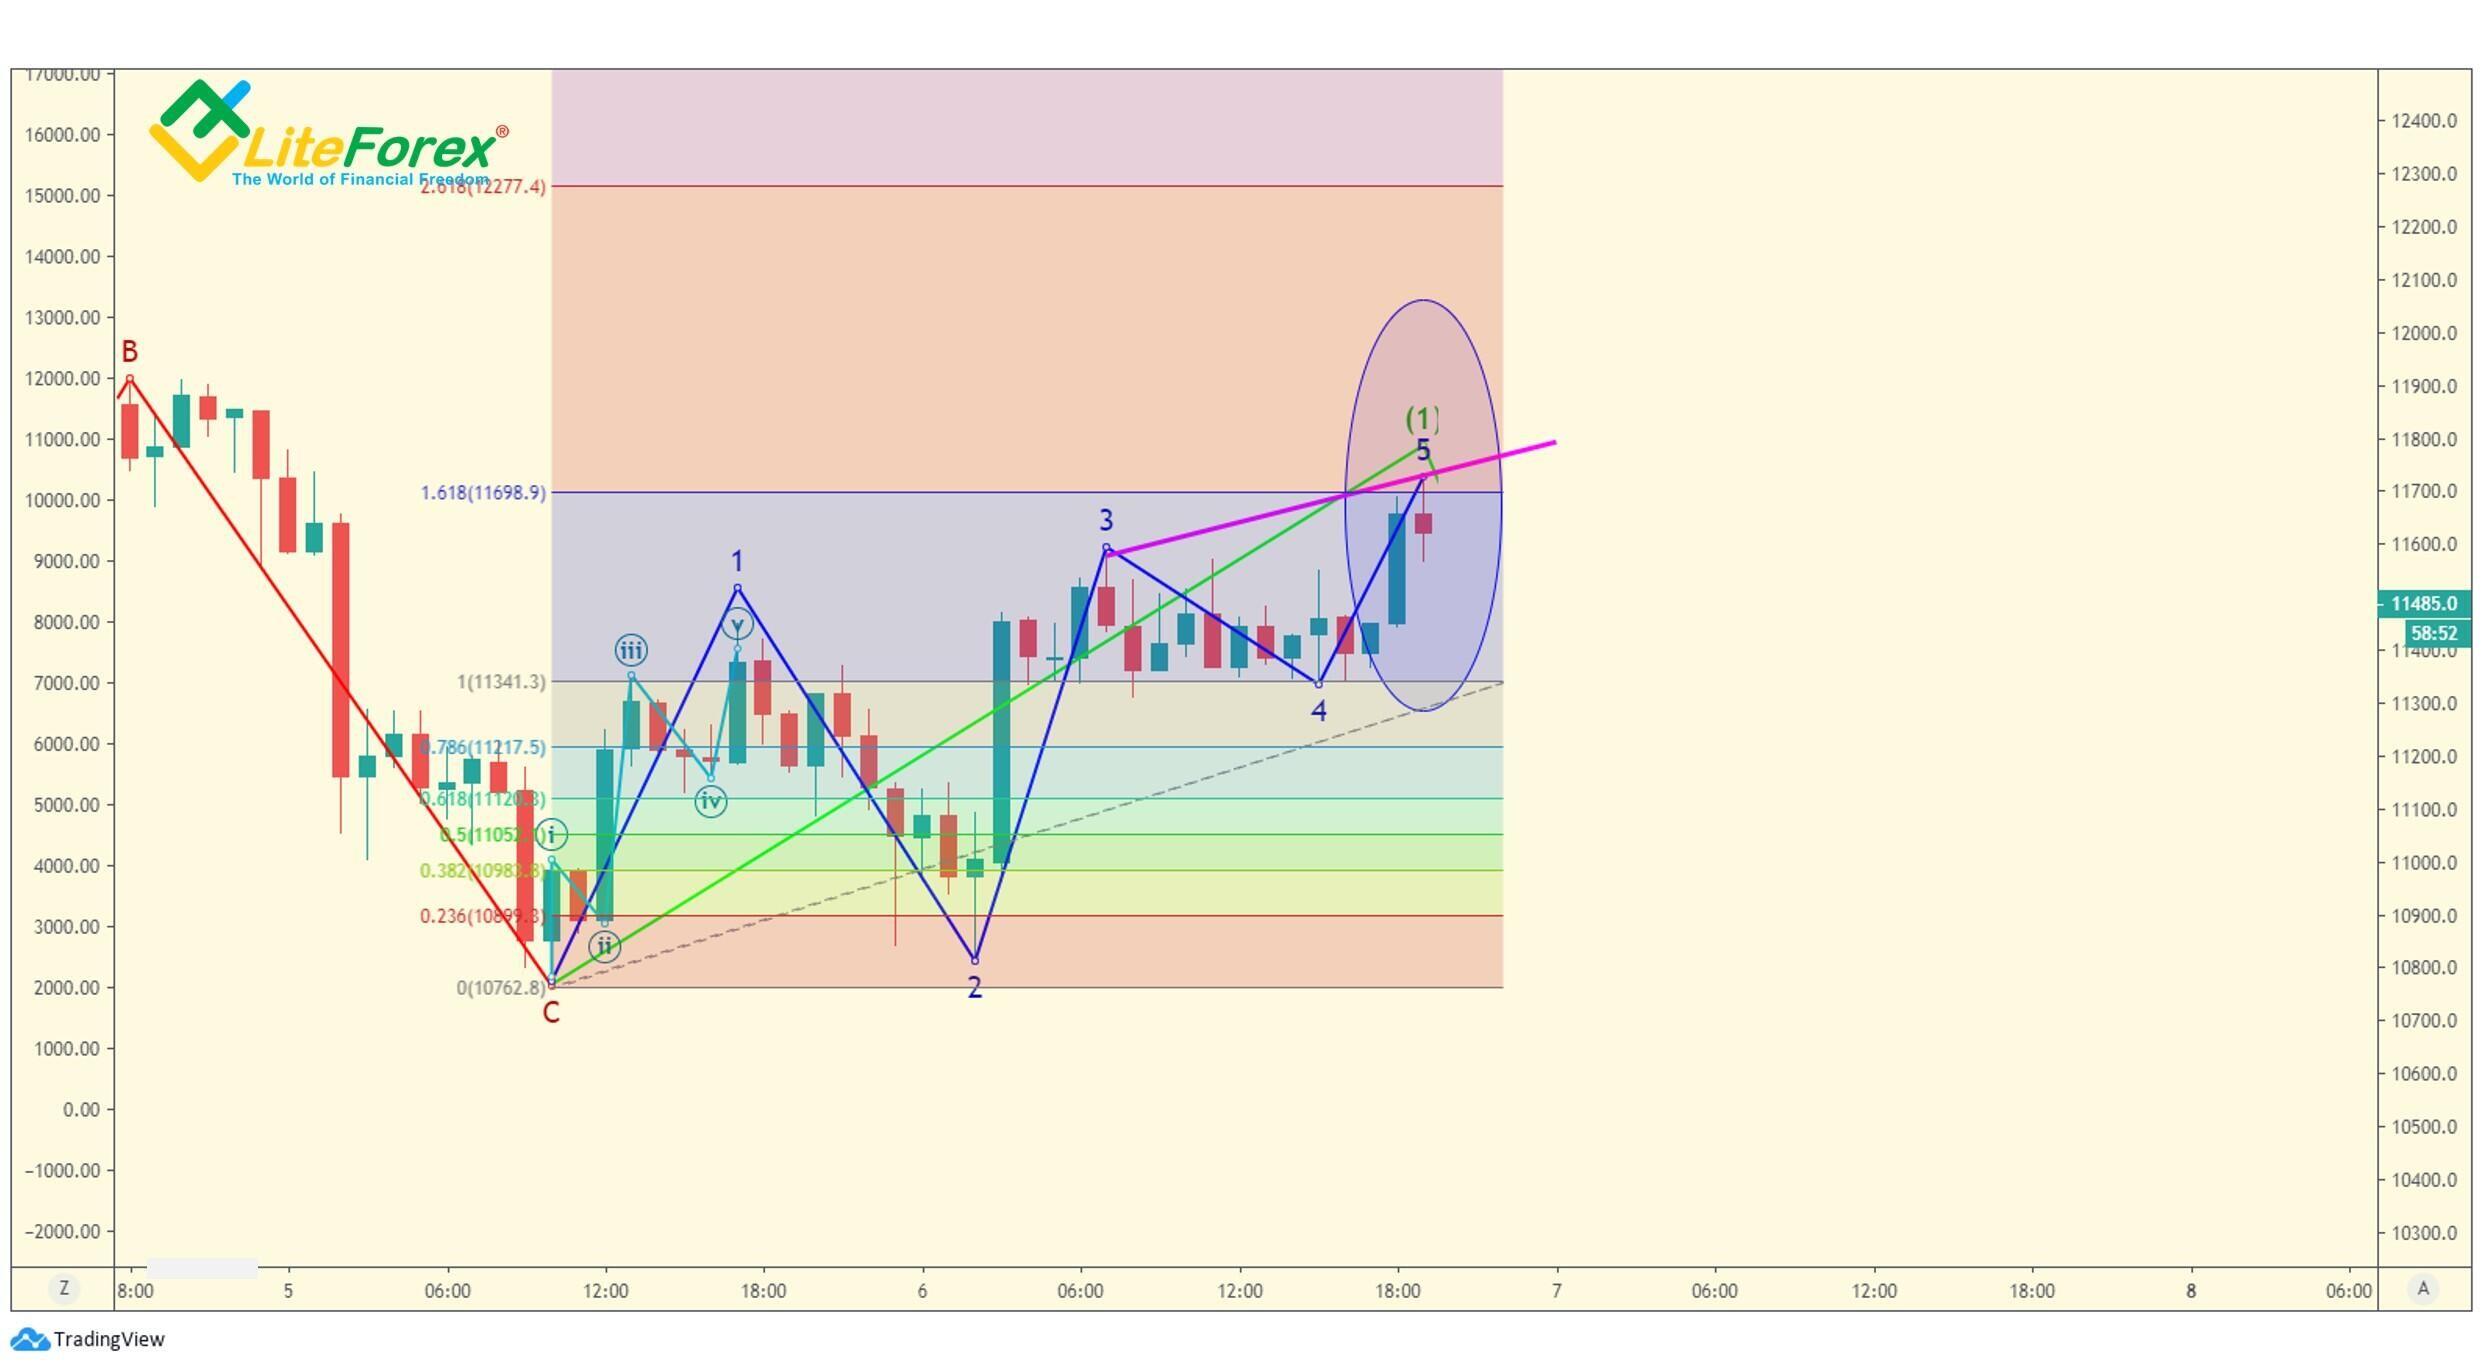
You see from the BTCUSD chart that the projected pivot point is a little higher than the point of 1.618 relations. So, it is the peak of the fifth wave and the first wave of the primary formation.
Wave 2
Wave 2 is an expected correction that is inevitable after wave one finishes. It is rarely forming on big volume, as the selling pressure usually exhausts by this time. Sharp correction most commonly emerges in the position of the second wave.
At the stage of the second wave emerging, you may enter short positions if you have the experience of margin trading, as it is the safest approach at this point, according to risk management.
This is because if the formation will be broken and the second wave will continue the previous bearish trend, you will benefit. Otherwise, if the second wave really starts a new bullish movement, you will exit based on the signals suggesting the second wave’s end; I will describe these signals later.
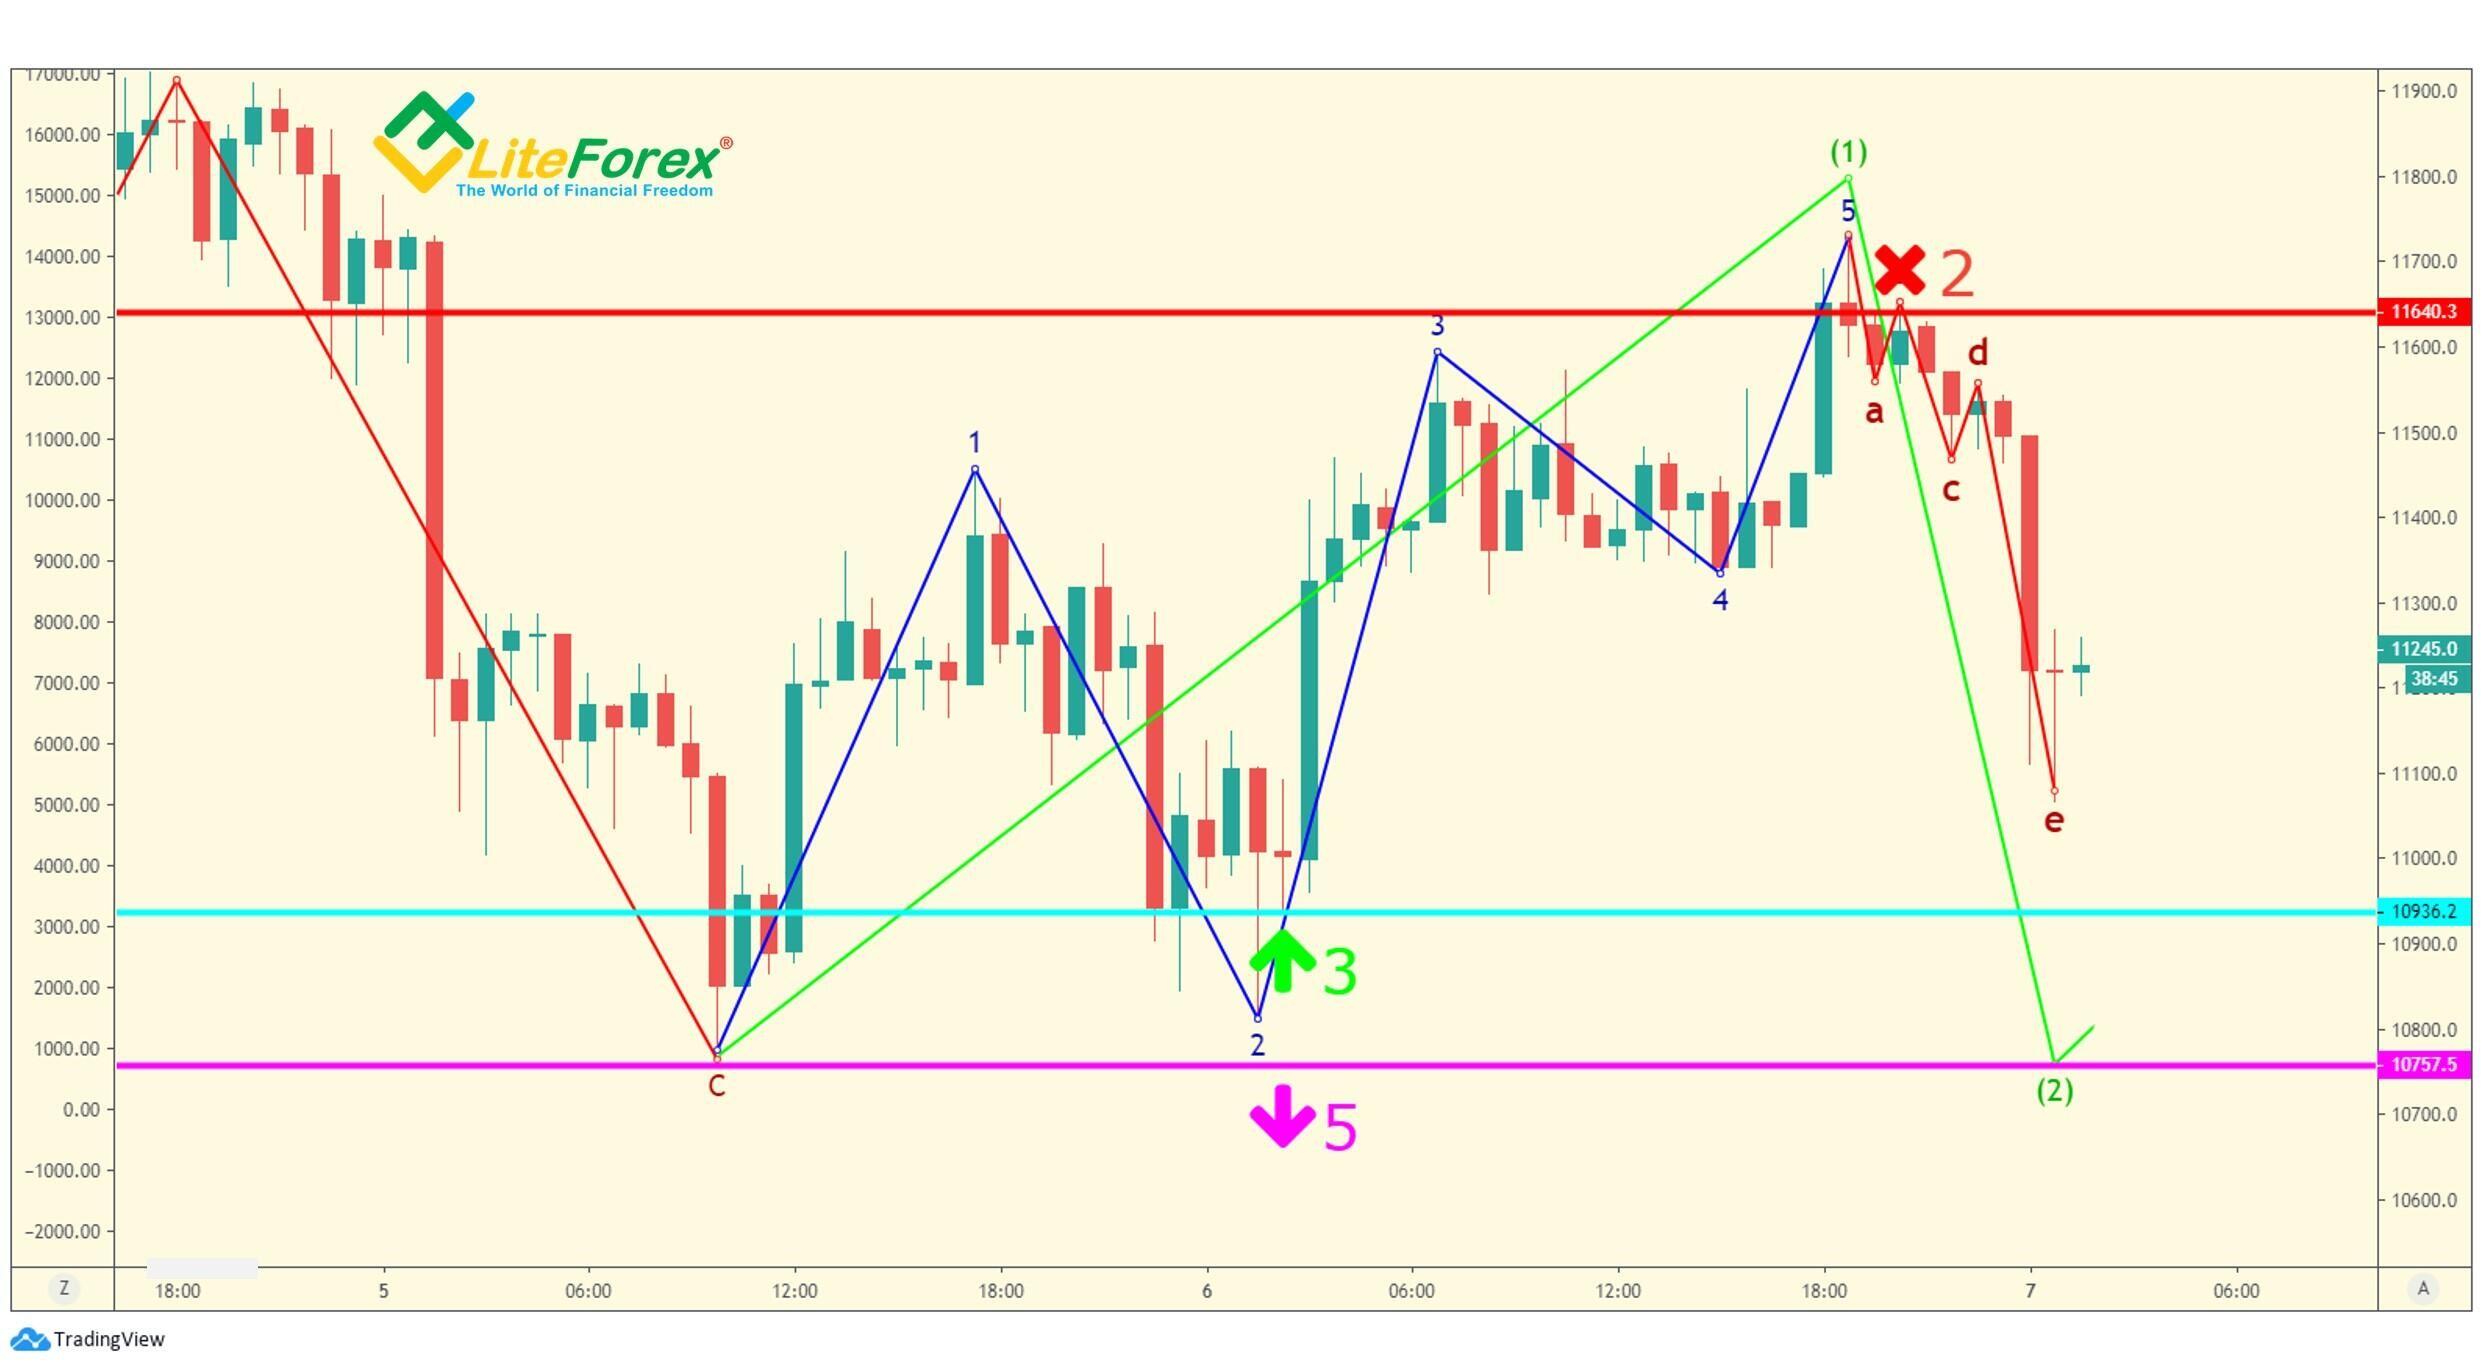
As I already noted, when the correction starts, that is right after the peak of wave (1), based on Bill Williams’s trading plan, we enter our first trade. According to the trading strategy, it is a margin sell, so we enter a short trade. If you can’t track the opened position all the time, you should set a take profit in the range of 50% - 61.8% of the first wave’s retracement. The second wave most commonly has such length in practice. If you won’t trade even safer, the target profit can be set in the range of 38,2% -50% of the first wave’s length. However, the profit will be much less in this case. A stop-loss, in case the interpretation has been wrong, will be set a little higher than the presumed peak of the first wave.
If you can, you need to switch to a shorter timeframe and define the correction type during the development of the wave. We will define the pivot point by analyzing the last corrective wave and the signals of five bullets.
The BTCUSD price chart displays the second wave that, upon closer examination, has a five-wave structure. Blue circle highlights the expected point of its end, the green arrow marks the relevant take-profit zone (50%–61.8% of the first wave’s length). As you see, the last bar has only a little exceeded the level of 0.618. Let’s look at the indicators.
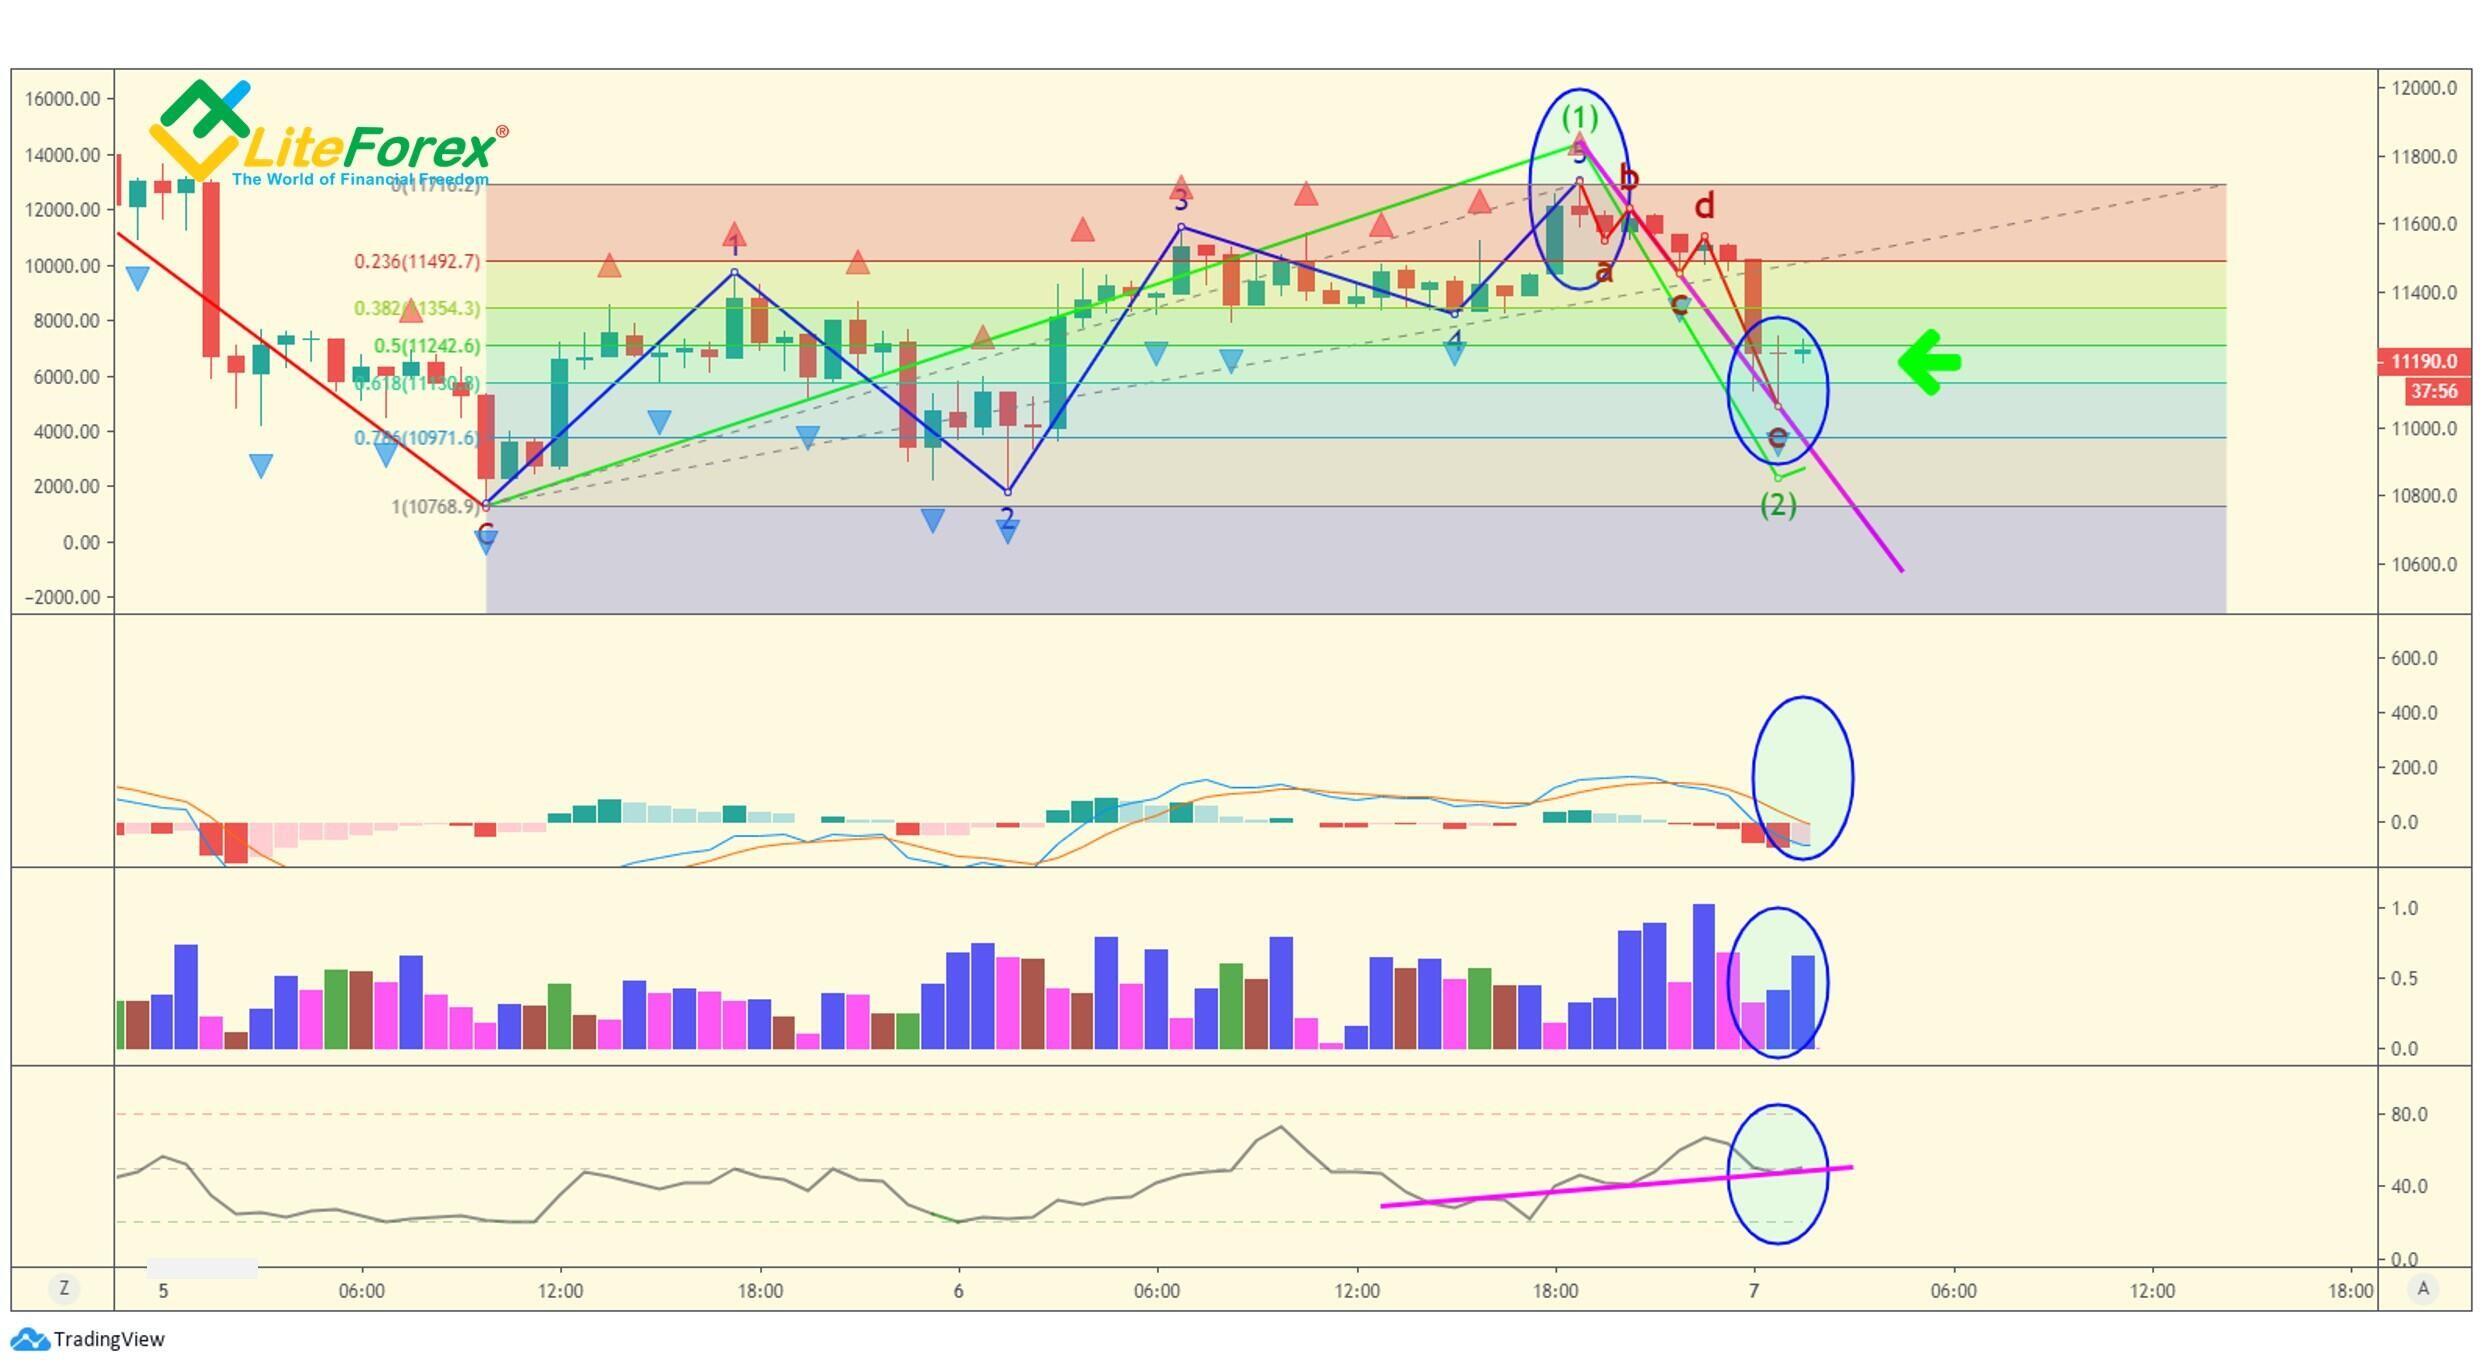
There is a down fractal at the expected endpoint of the second wave. Two of the three most recent bars on the Market Facilitation Index are squatting, the classical MFI show divergence (pink line). The MACD however, doesn’t sell any reversal signals. In rare cases, when the last bar in the target zone and the other indicators sell corresponding signals.
Williams recommends dividing the acceptable deposit into 10 conditional parts, where one part represents the volume of one trade opened. We enter another trade while the second wave is developing. By the end of the wave, according to the analysis on the above chart, we exit it taking the profit.
Wave 3
At the beginning of the third wave, we are quite sure that there is a five-wave sequence unfolding, its first and second waves correspond to the structure and relations described in the studies of Williams and Prechter. So, we can now enter three trades, which will be 30% of the deposit. Furthermore, the third wave most commonly is the most powerful and allows one to take quite a good profit, even if you enter a little later than its starting point.
The next step after we have opened the position is to protect it from excessive loss and set a target profit. I set the level of stop loss and the pivot point to enter a short position a little lower than the zero-point. Besides, Williams suggests that the volume of the biggest short trade mustn’t exceed 5 parts or 50% of your deposit.
This position is relevant only when then the third wave breaks down after the price goes below the zero level (the lowest point of the second wave). In this case, the wave is the reaction to the continuous downtrend, rather than a bullish impulse wave as we have expected. The principle of deposit management when you divide it into 10 parts allows you to be the most flexible. You can open a short and long position at the same time. This is appropriate when you receive a reversal signal, but the previous position has not yet reached the level of your take profit or stop loss.
This mobility helps you minimize potential losses yielded by losing trades, and can always follow the most relevant scenario. The only case when you should fully exit the trade is when you are lost and can’t identify the current stage of the market structure.
Trading at multiple wave degrees
Now, I will give you an example of BTCUSD trade and explain how you can start making a profit at the beginning of the first wave of the primary sequence, according to Williams’s trading system. As you remember, we have divided it into five sub-waves.
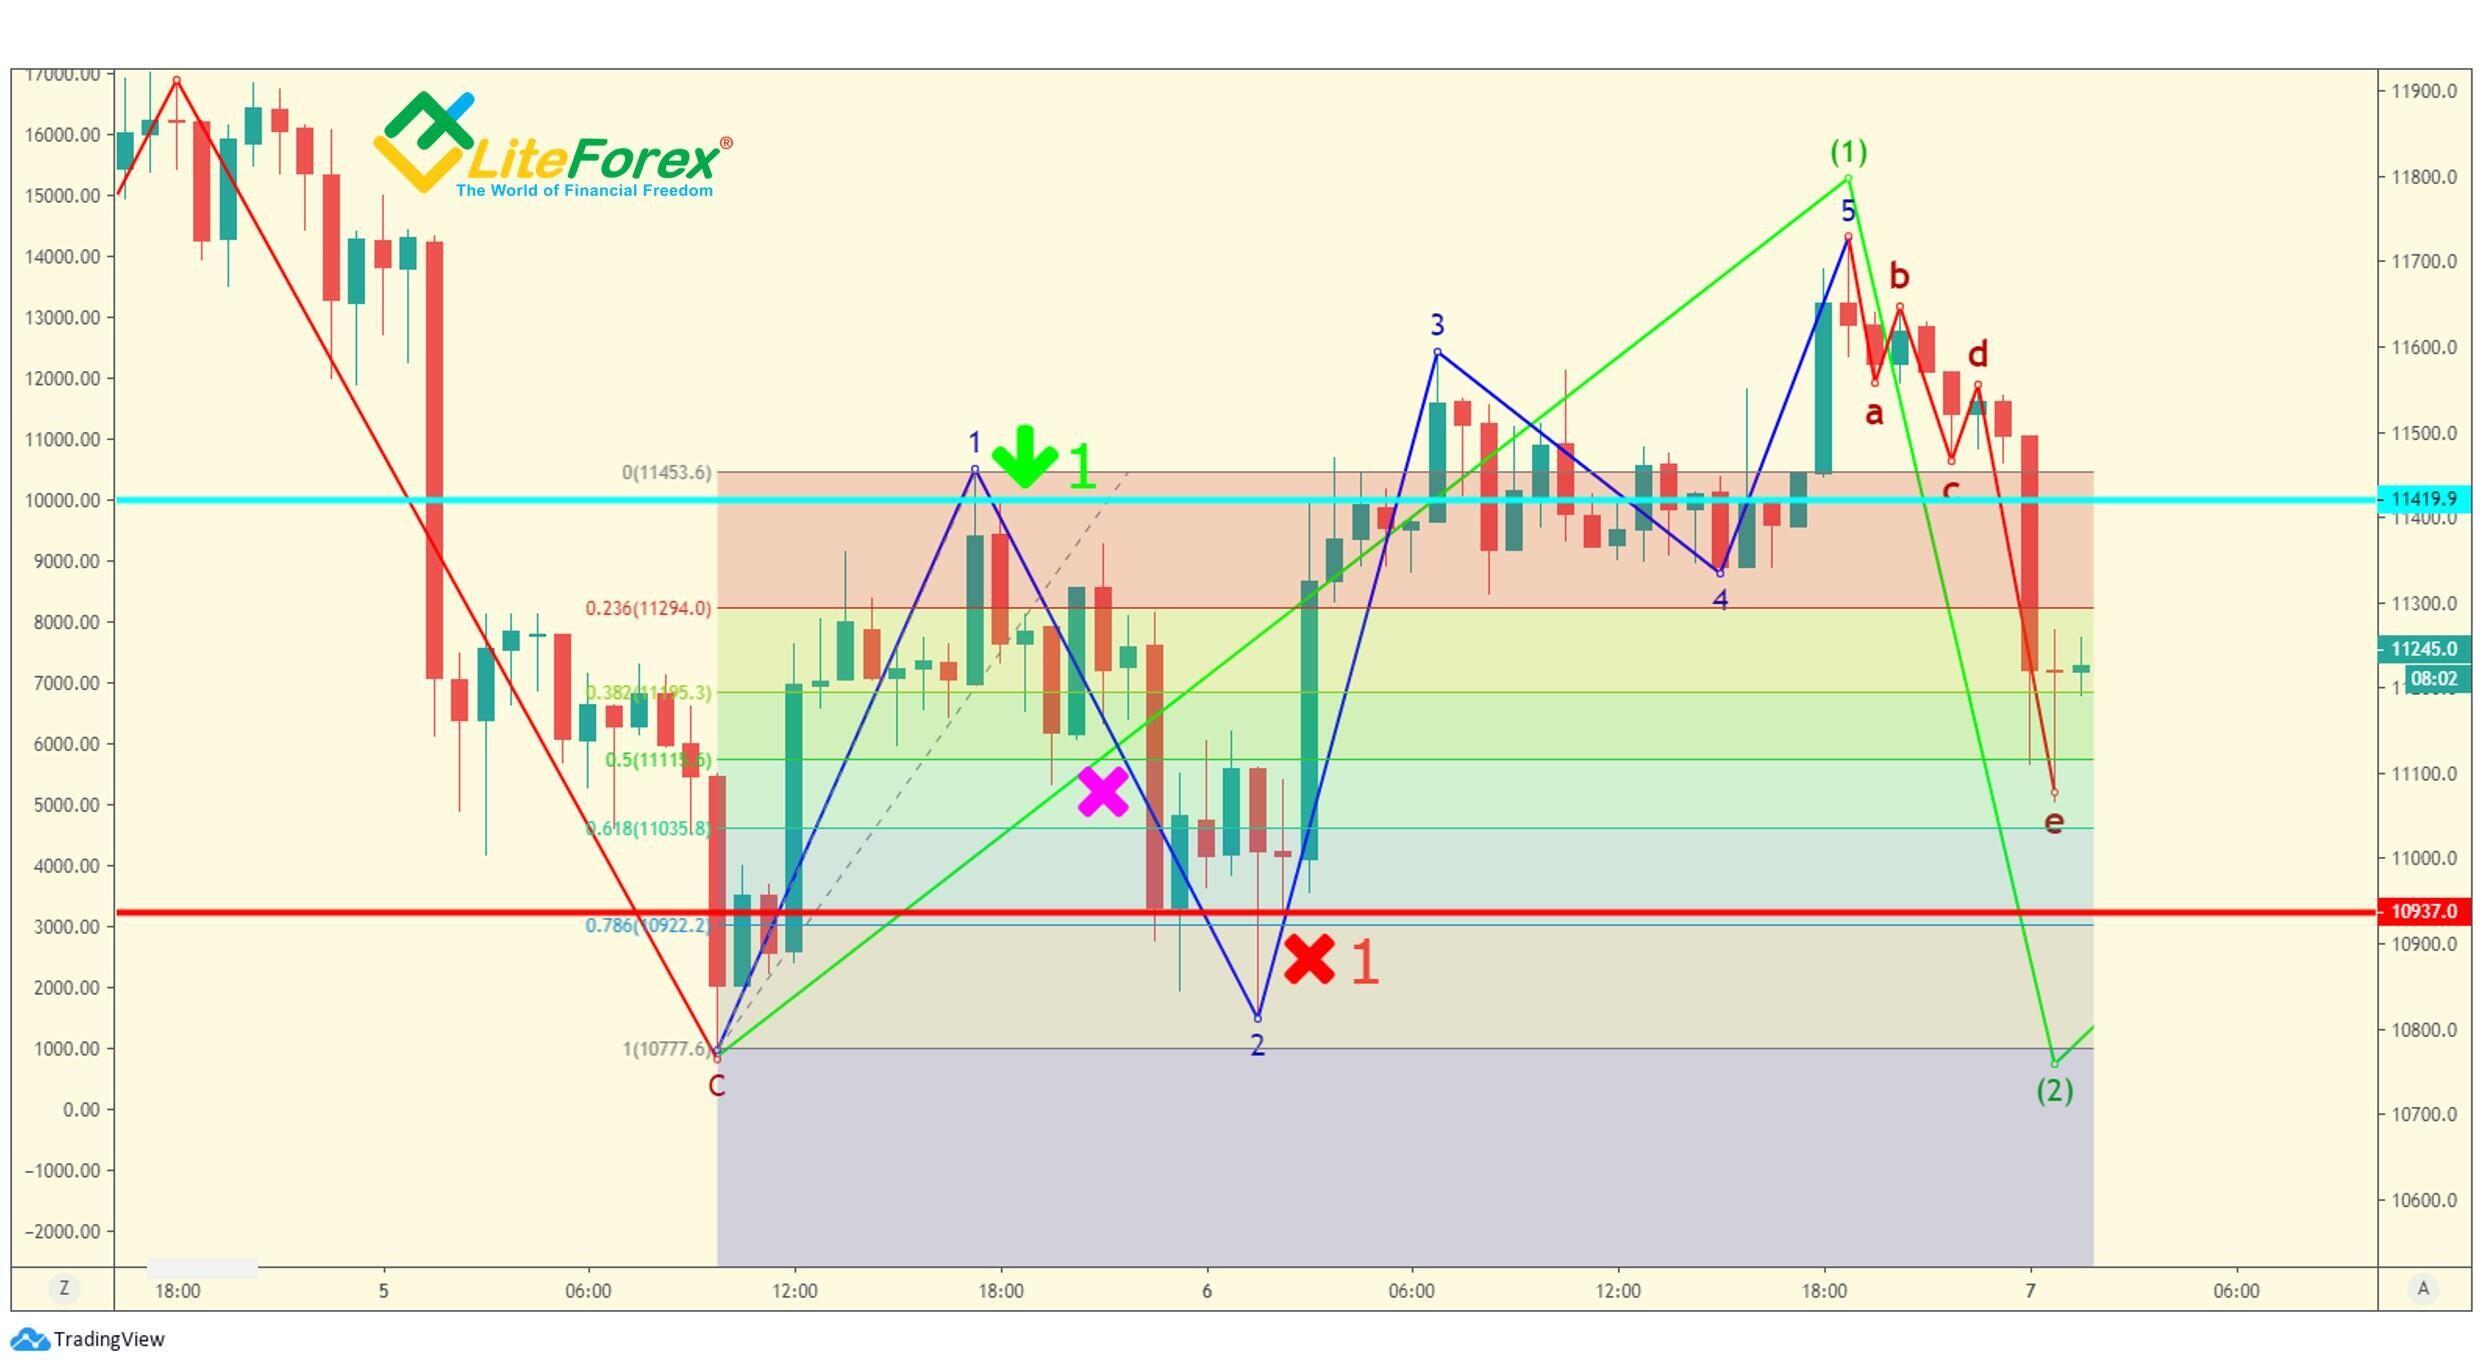
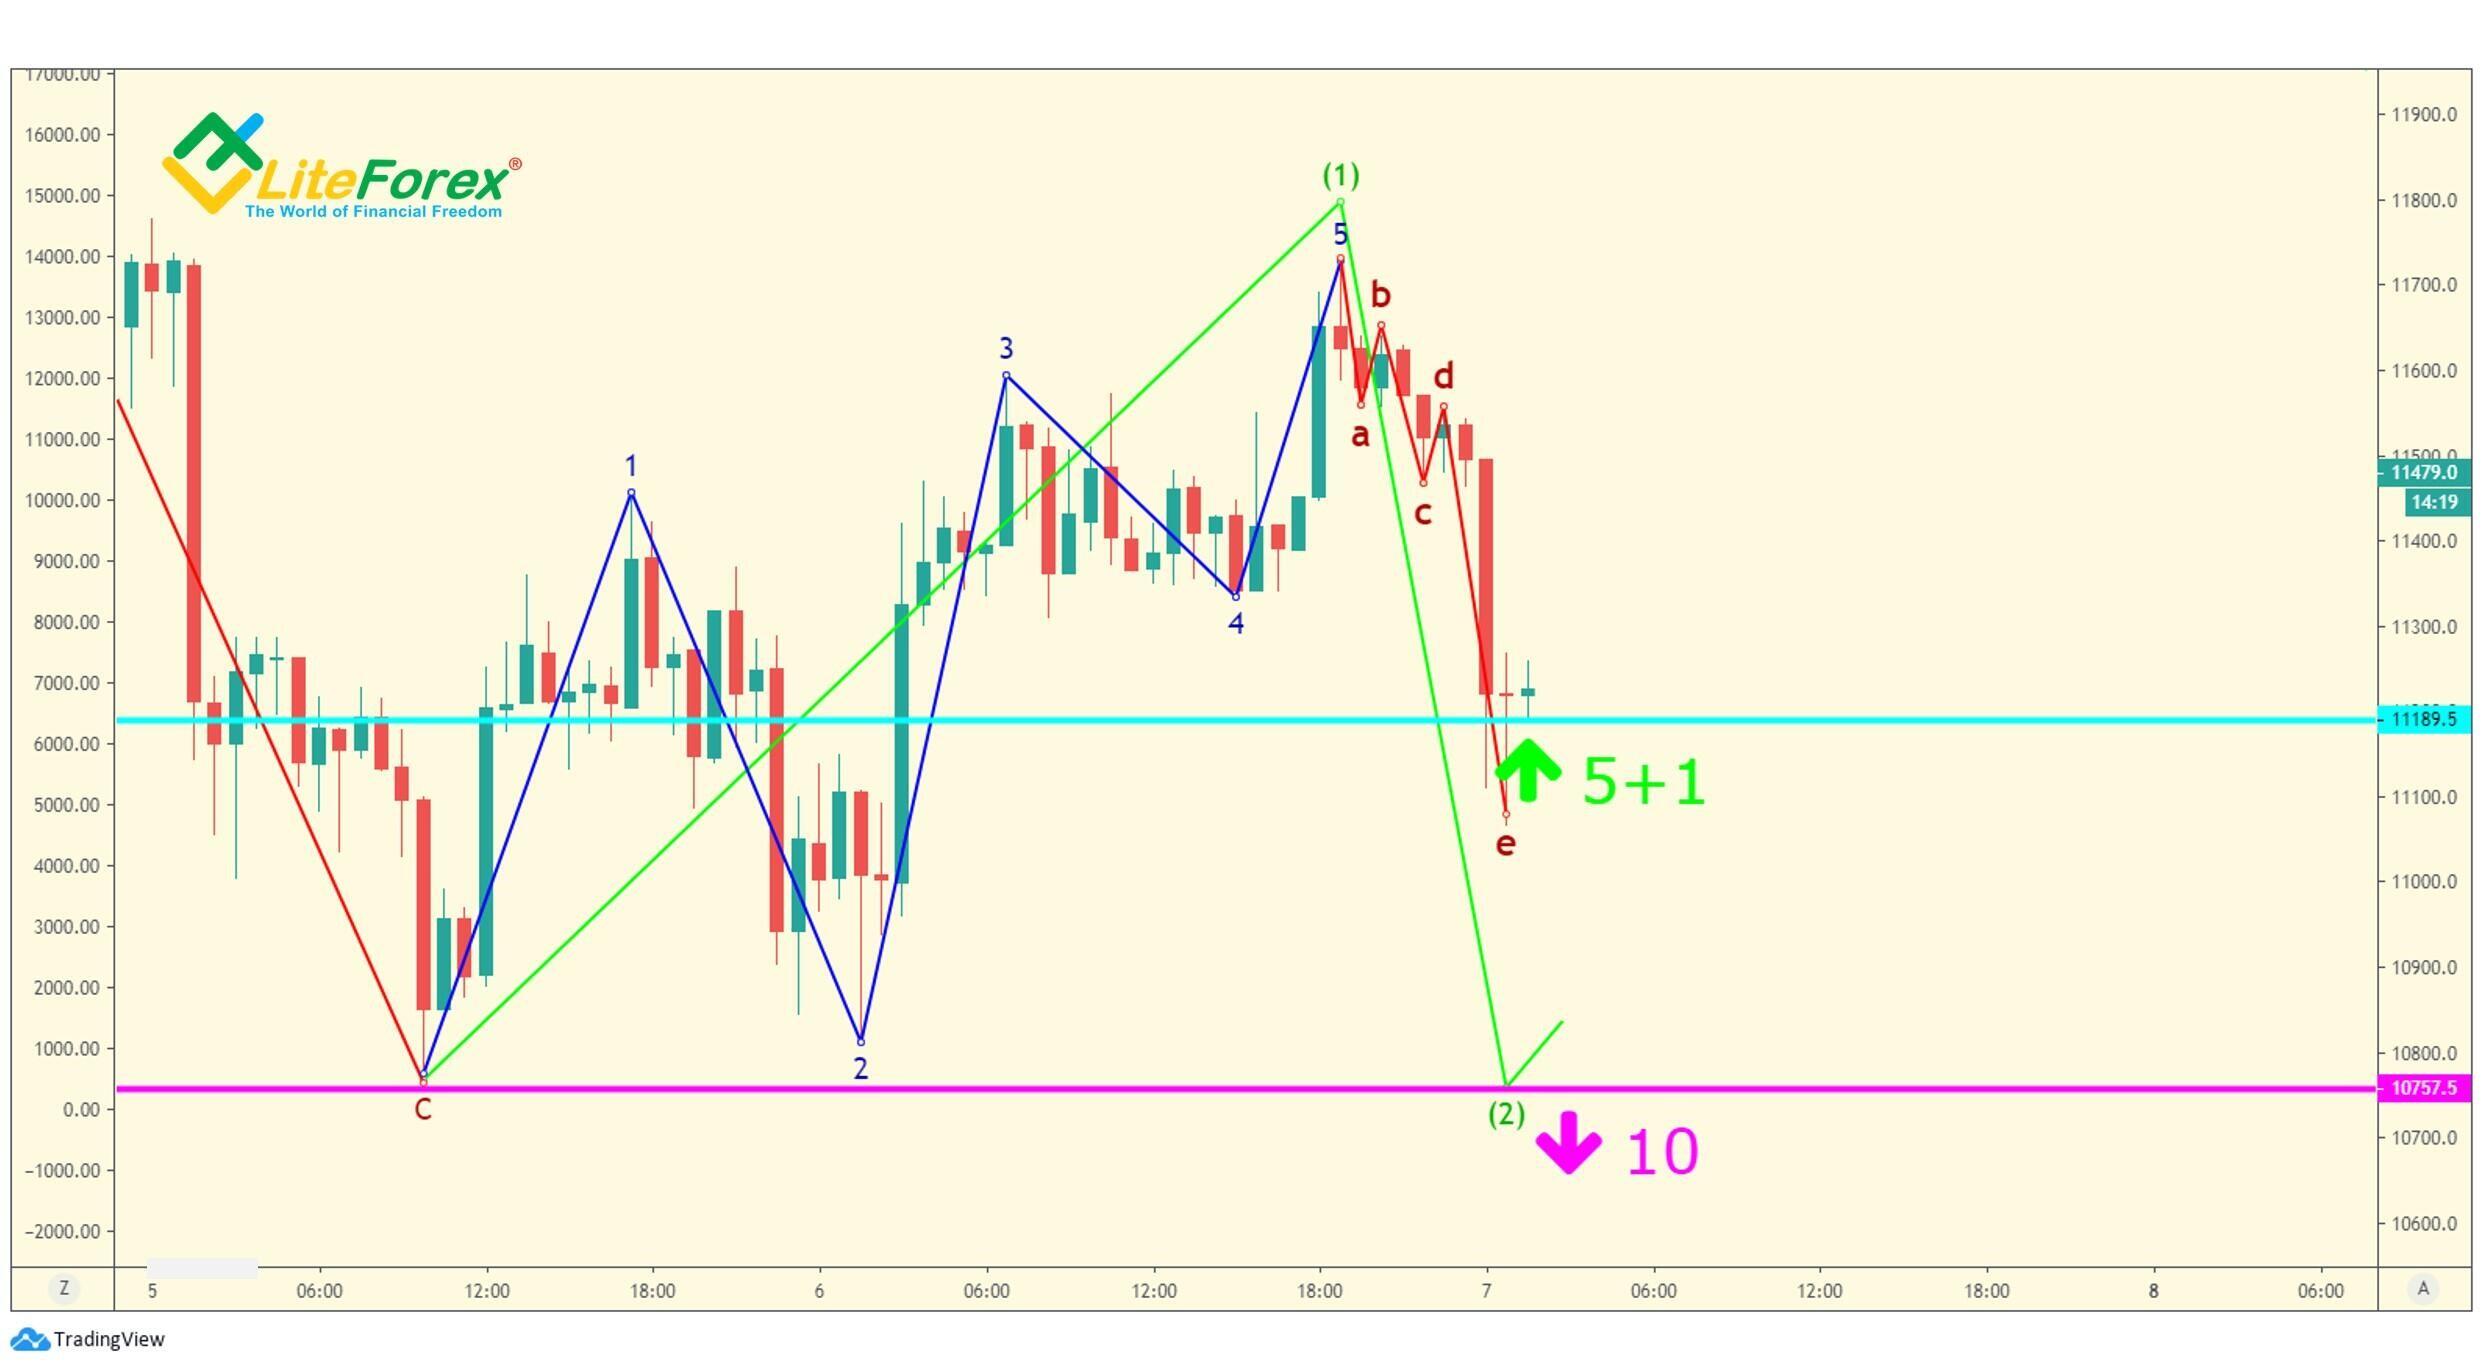
Well, we enter the first short trade at the beginning of sub-wave 2, marked with the blue line in the chart. The entry-level is marked by the blue horizontal line. It is closed automatically when the price reaches the target level of 50%–61.8% (opposite to the pink cross in the zone of 0.5-0.618), or when it reaches the target zone and there are five bullets (red horizontal line).
Next, we open three long positions at the first bar of the sub-wave 3, as I wrote above (turquoise horizontal line). To insure against possible mistakes, we set five sell stops at the purple line that is a little lower than the expected low of the second wave.
If the price goes up, as in the given example, we don’t frequently enter or exit trades at the smaller wave degree, waiting for the end of they fifth sub-wave or wave (1) of the primary level. I explained earlier how to define the trend pivot point. I will further explain the method to calculate the peak of the fifth wave, so I won’t spend much time on this.
We have three long positions opened at the beginning of the second wave of the primary sequence. We should close two of them to make a profit instantly (red horizontal line in the chart) and cancel the pending orders (buy stops). The remaining long trade is left open in case the market doesn't reverse and continues moving up, which is common for extended first waves.
Trading wave 3 of primary degree
Later, you can also open one short position at the second wave of the primary degree if you are sure that the correction has started. However, Bill Williams doesn’t mention this in his multi-level trading strategy, suggesting you open the next trade at the beginning of wave (3).
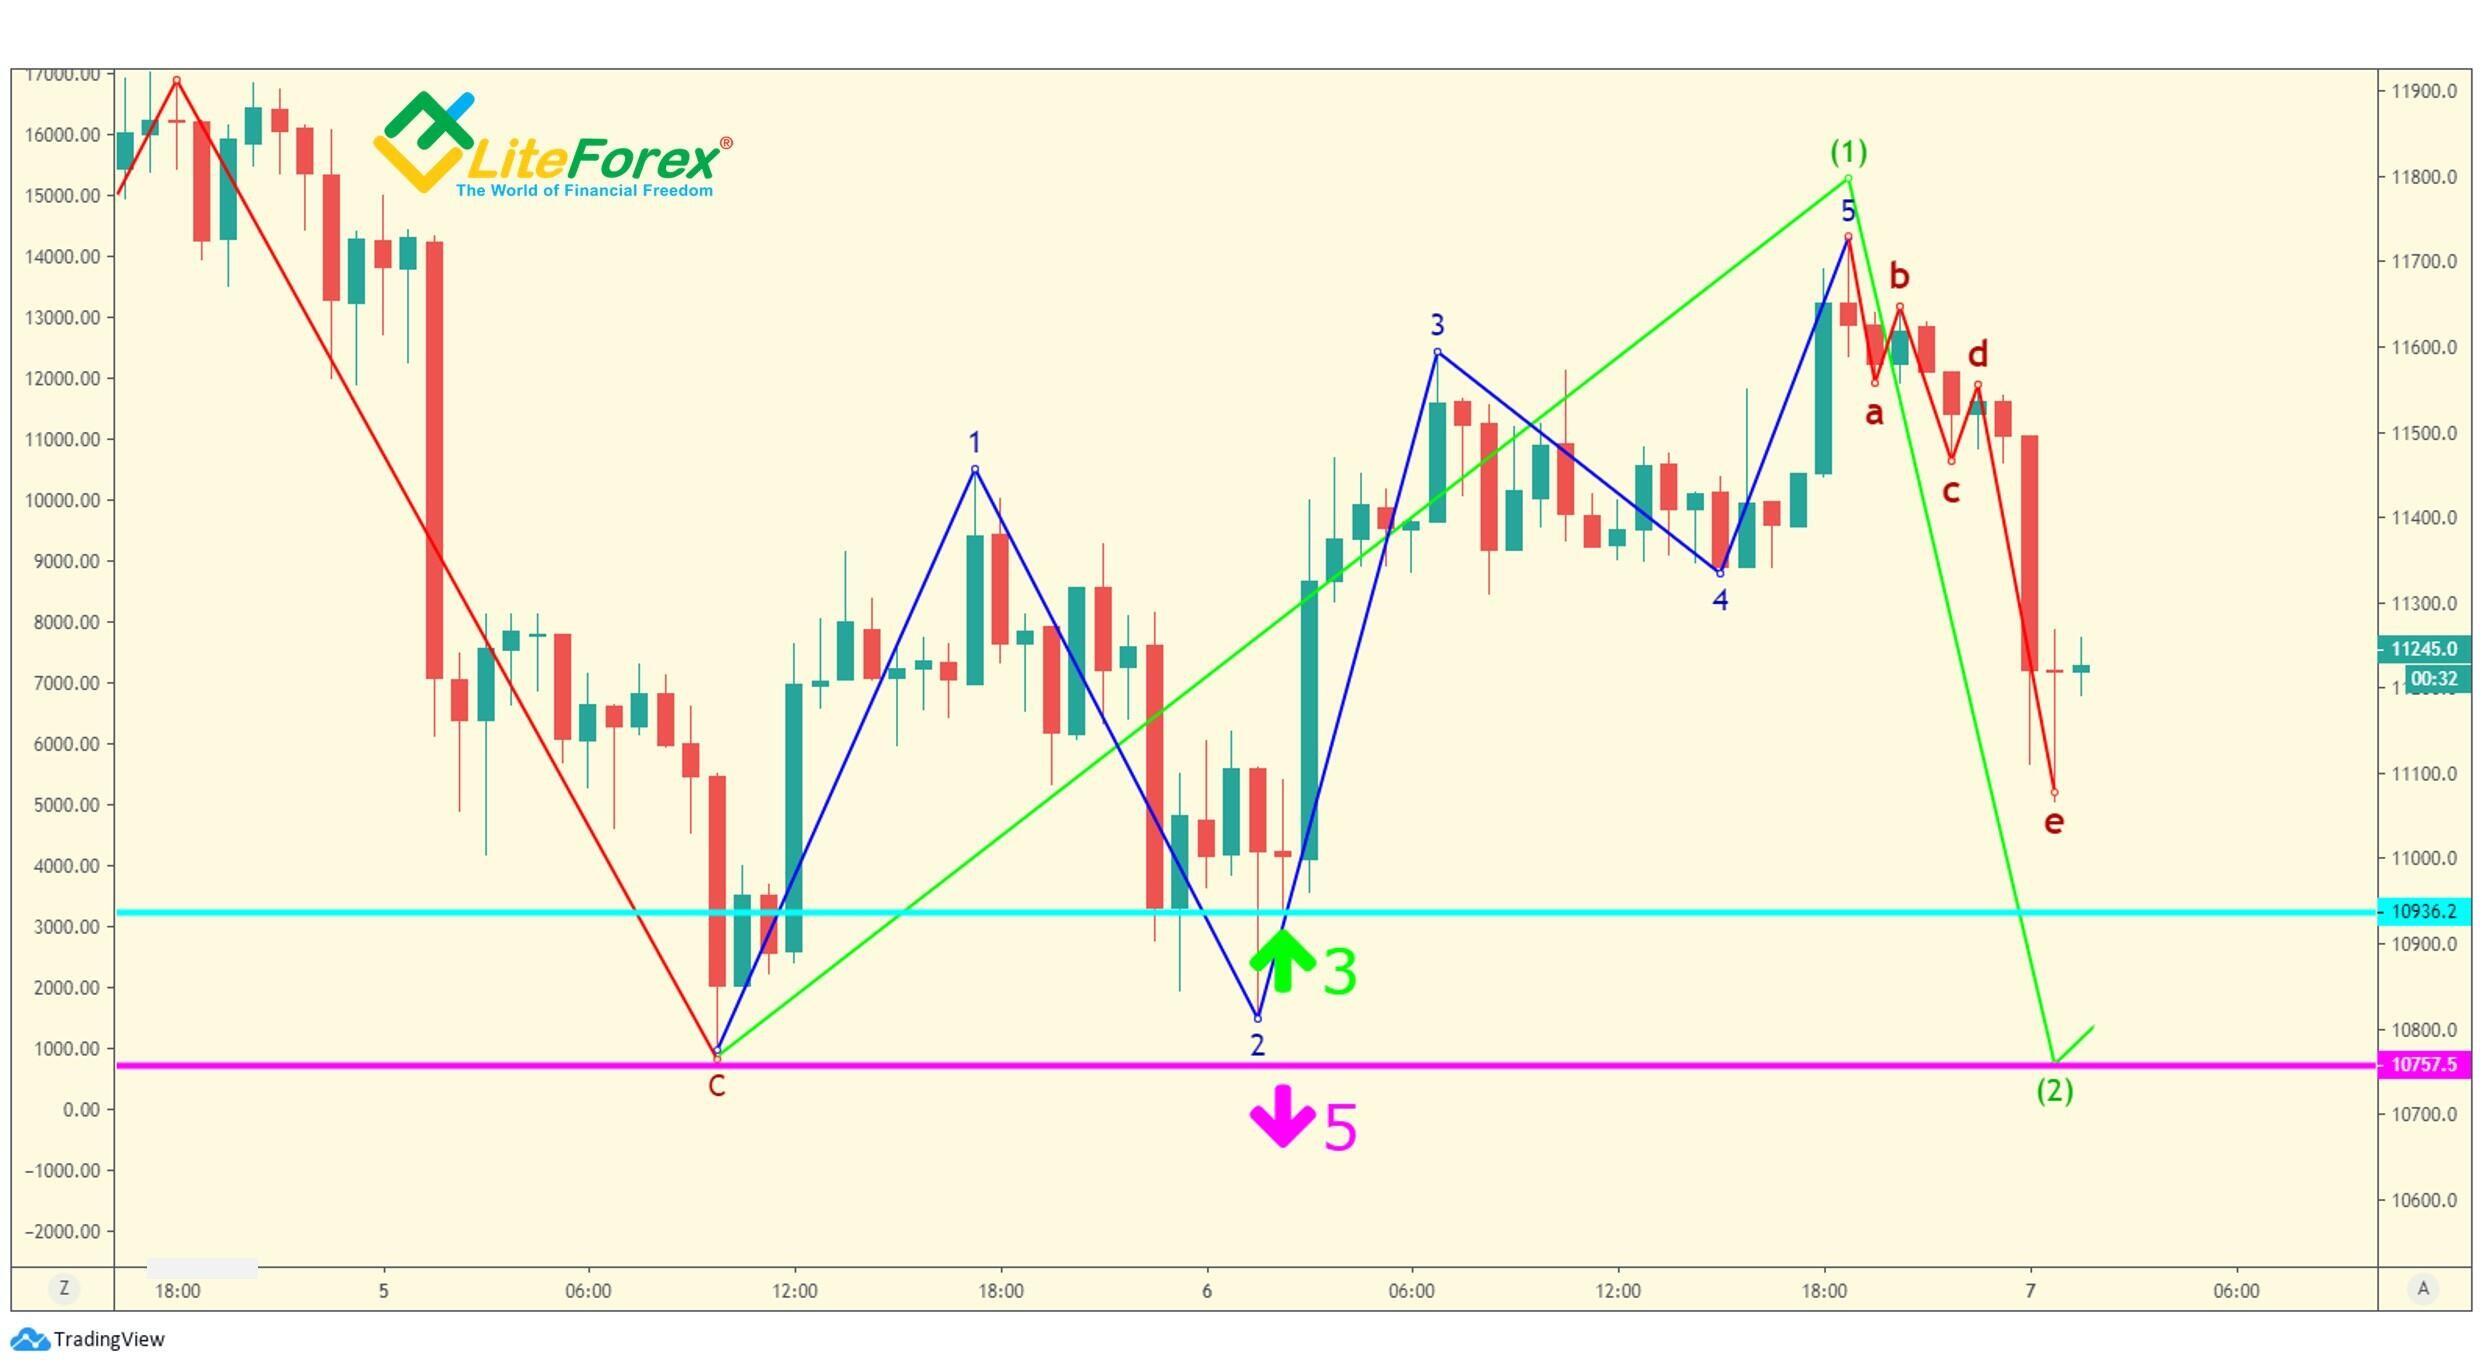
This time, we take the profit for the BTCUSD short trade at the first bar of the third wave, and we enter a trade with a volume of five conditional parts (the entry-level is marked with the blue horizontal line). If the correction doesn’t finish and there is a double bottom, you can enter one more trade, that is we can be in total opened 6 parts of the deposit or 60%. If the correction doesn’t finish, a stop loss is also set below the base of the first wave (pink horizontal line). At this moment, we open 10 positions a little lower than the zero level. Even a short down move of a few percentage points, in addition to the profit made from the recently closed position, will be more than enough to cover the losses.
The next critical point is where the third wave currently unfolding reached the length of the first wave. At this stage, there can be a few scenarios:
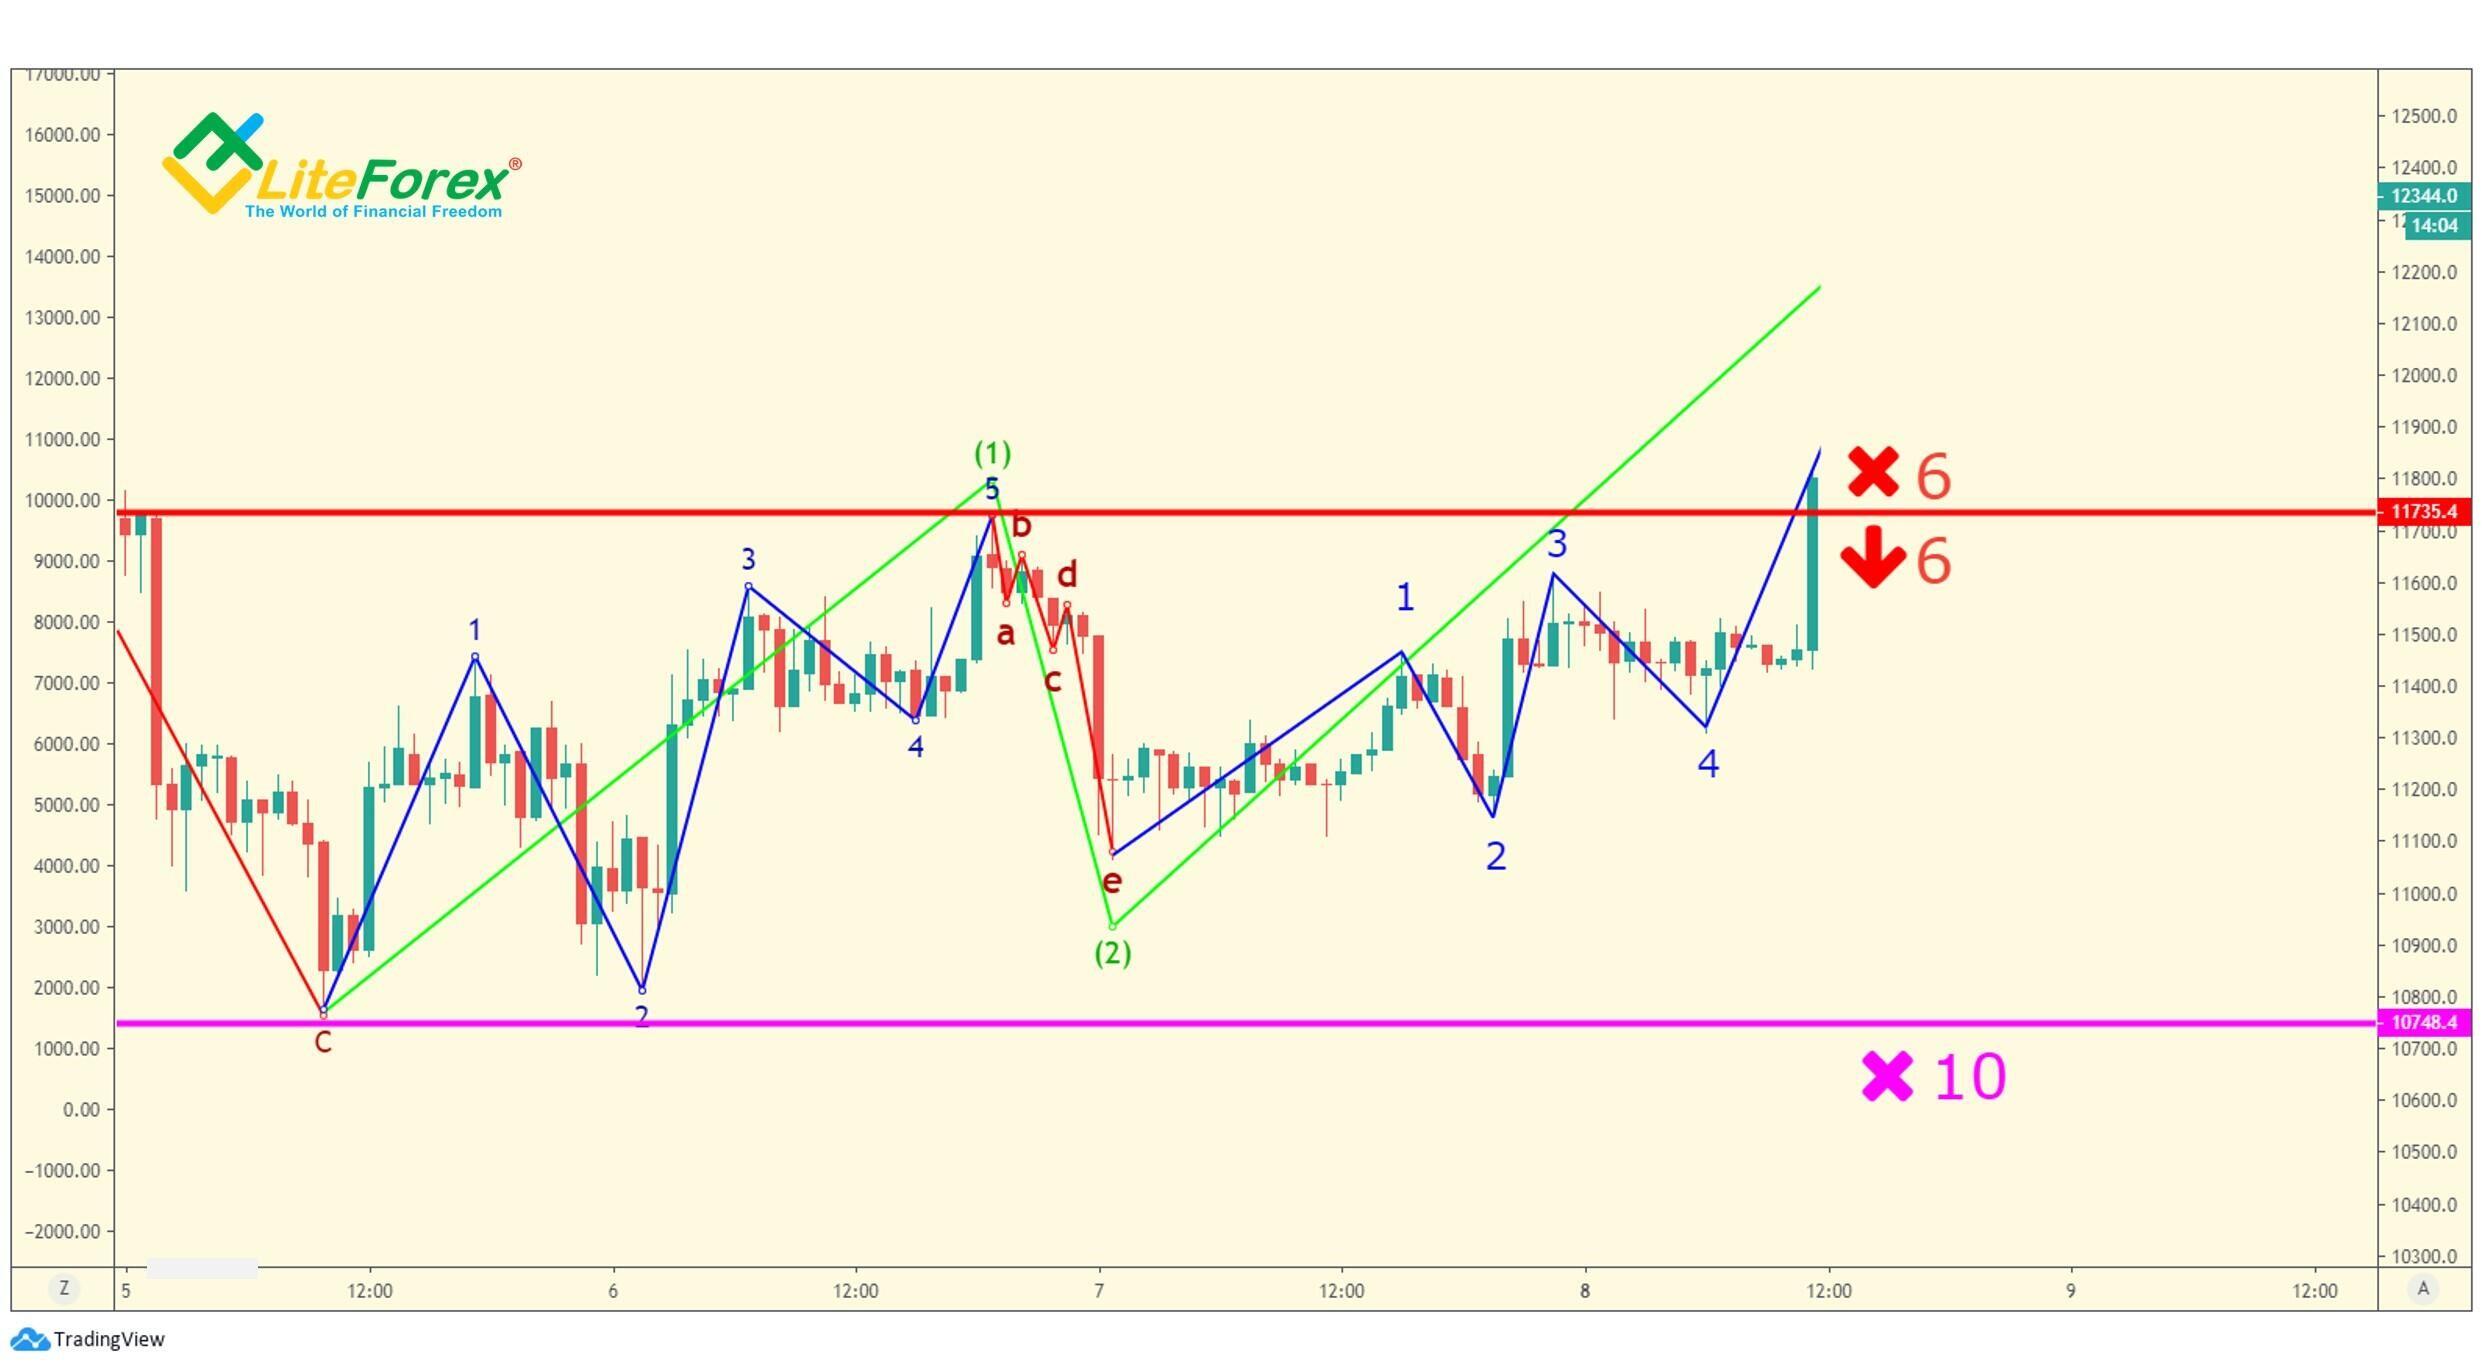
If the market stops the movement and the BTCUSD price goes back below the peak of the first wave, the best idea will be to sell the existing long orders (red horizontal line on the chart). Also, you have 10 conditional pending orders set at the stop loss level, you should cancel them. The next step is to enter a short position of six orders a little lower than the peak (below the red horizontal line), which was thought the top of wave (1). The logic is simple. We are not yet entirely sure what exactly is going on in the market, but, if the buyers are not strong enough to consolidate the price above the critical level, there can well start a correction and the pattern could be broken. Therefore, the orders should be canceled until the situation clarifies. Or, we can enter shorts if there are bearish signals (see wave relations according to Prechter and the five bullets by Bill Williams).
If the price continues rising and breaks through the level of 110% of the top of wave (1) (blue horizontal line in the chart), our assumption is likely to be correct, and there is developing the third wave. Another signal indicating the third wave that Robert Prechter noticed is high volume. The volume is especially acute at the moment of the breakout of the key levels. If the level is broken on the rising volume, this is a strong confirming signal and vice versa.
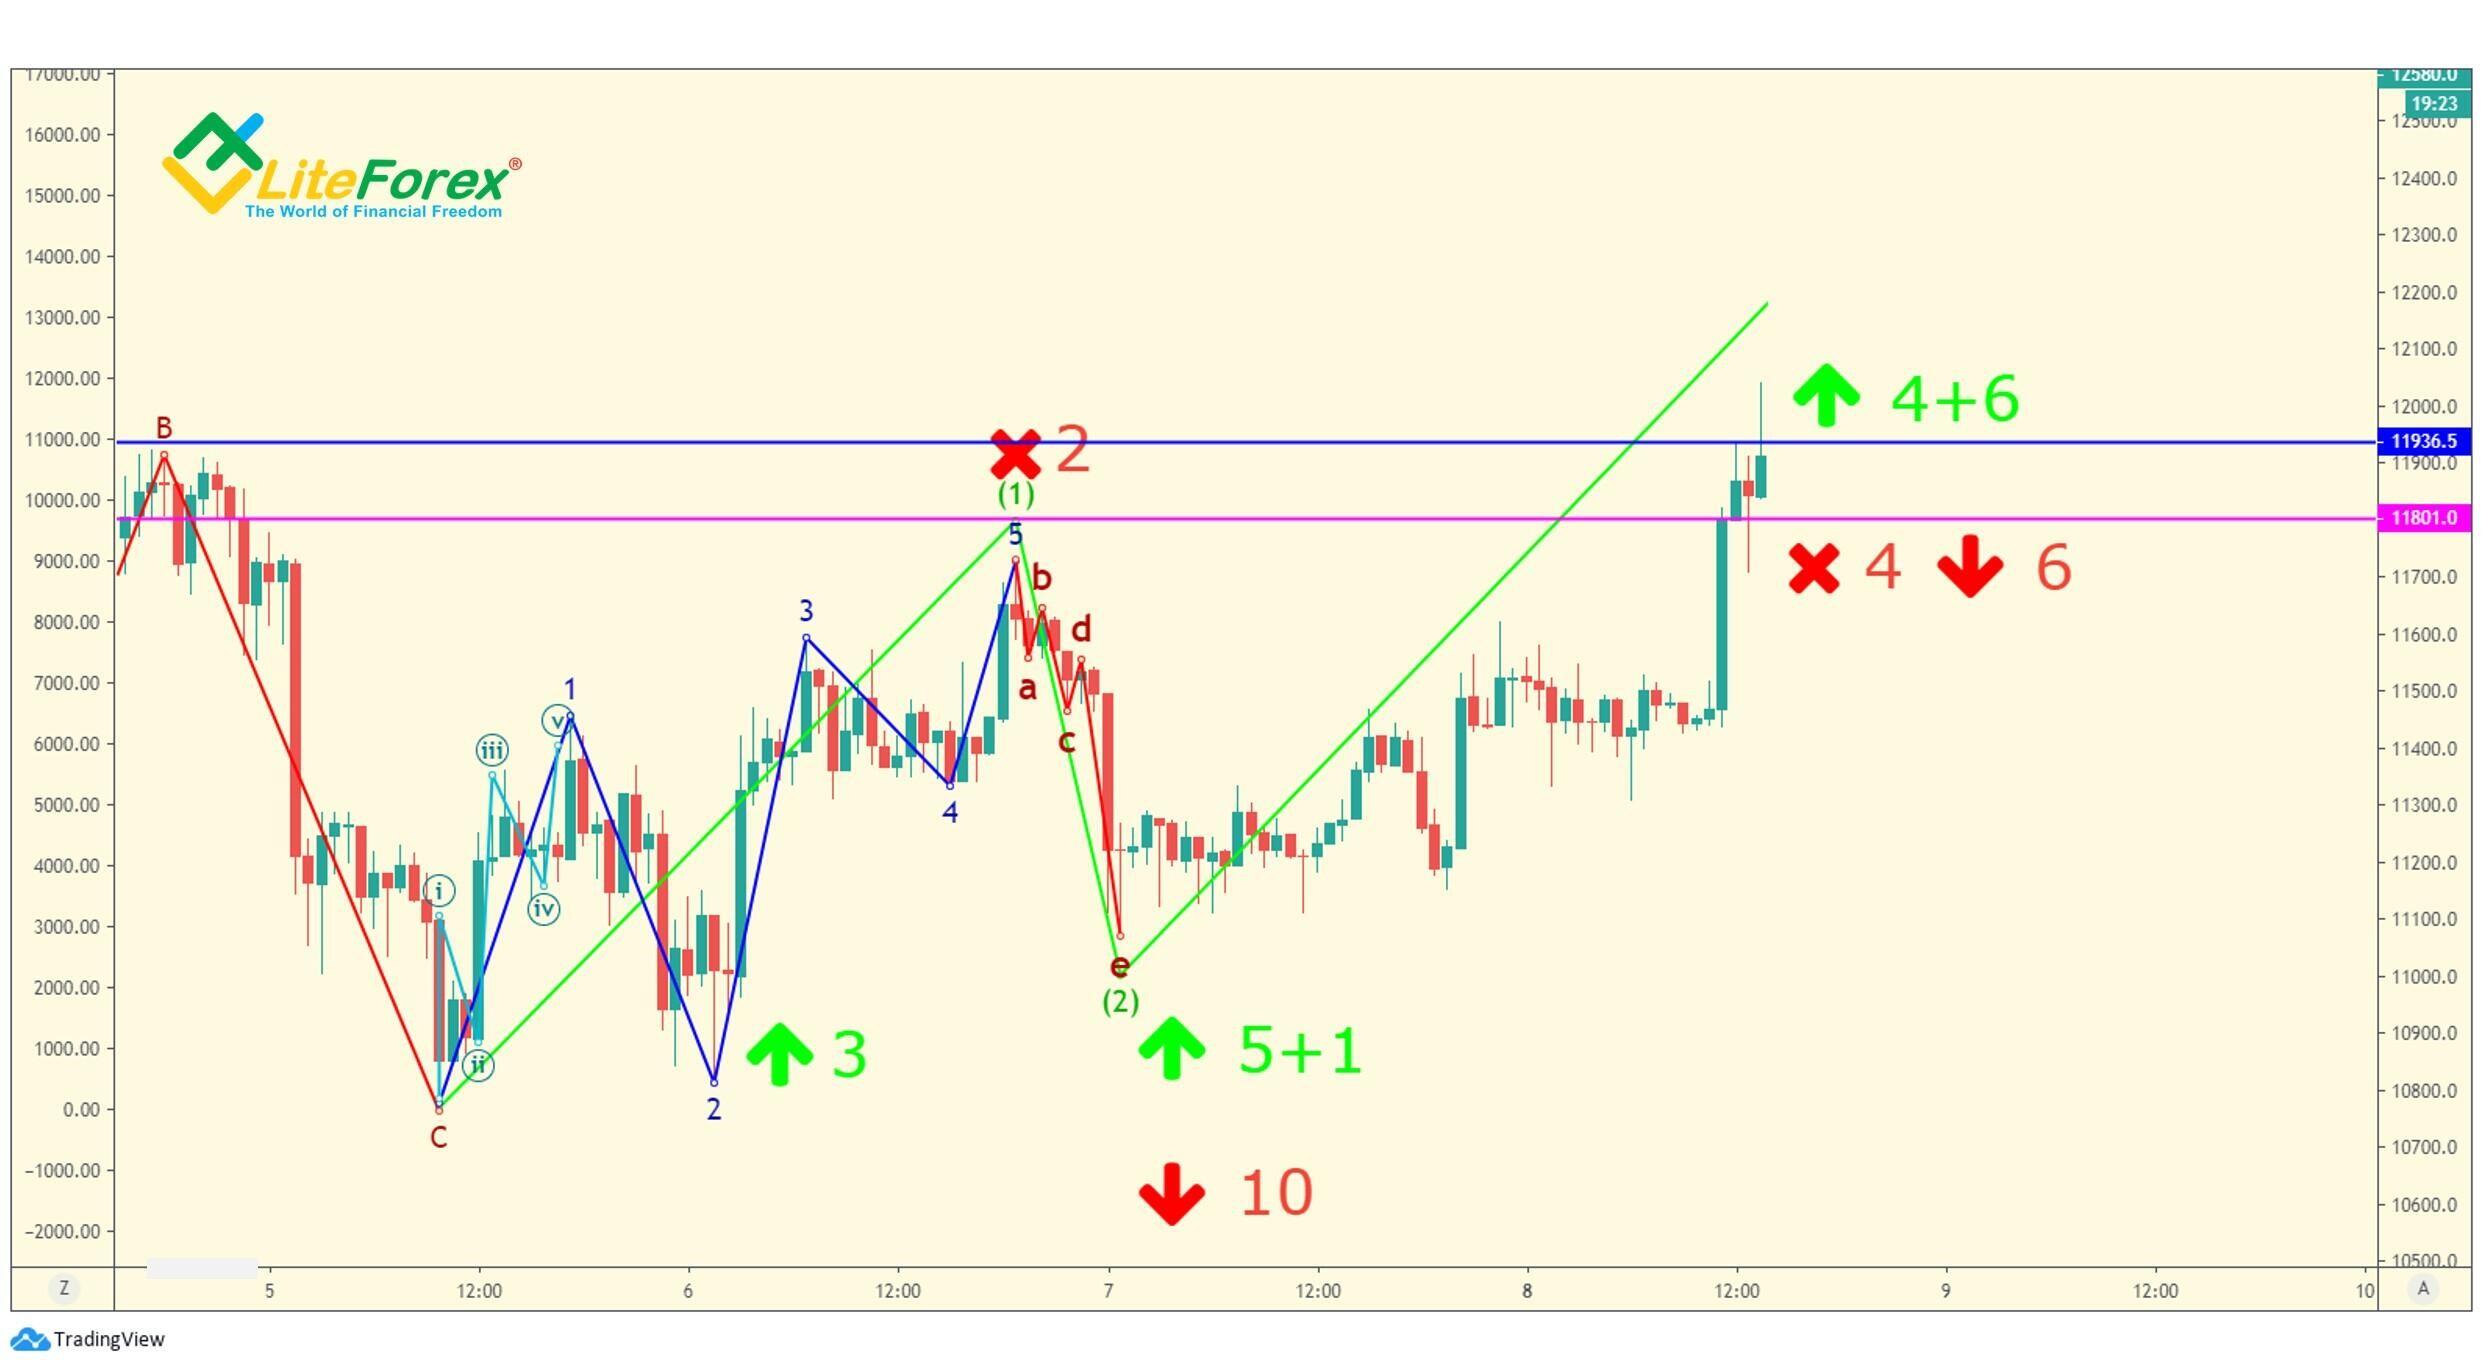
If the signals suggest the uptrend continuation, we shall add up to the position at the level of the blue line, bringing their total amount to ten parts. One should enter the biggest trade at this point, as the second half of third waves usually features the most intensive up move, while the risk is the lowest. To be on the safe side, we should set the level of partial profit-taking for the long trade below the peak of the first wave, there will be closed 4 parts. If the price goes below the top of the third sub-wave in wave (1), we close the remaining 6 parts and open the shorts of the same size with the target at the base of the failed third wave.
If the third wave is developing according to the plan, after putting ten orders, our next target is to find out the endpoint of the third wave, and so, the level for taking a profit. It is better to make the initial forecast based on the Prechter’s guidelines to wave relations and the wave alternation. Most commonly, the third wave is 100% -161.8% of the first wave’s length. Besides, you must remember, if the first wave wasn’t extended, the third wave is likely to be extended. As you remember from the previous materials, an extended third wave tends to reach 161.8% of the first wave and sometimes runs further.
The range of 100%-161.8% of wave (1) is marked by the blue area in the chart.
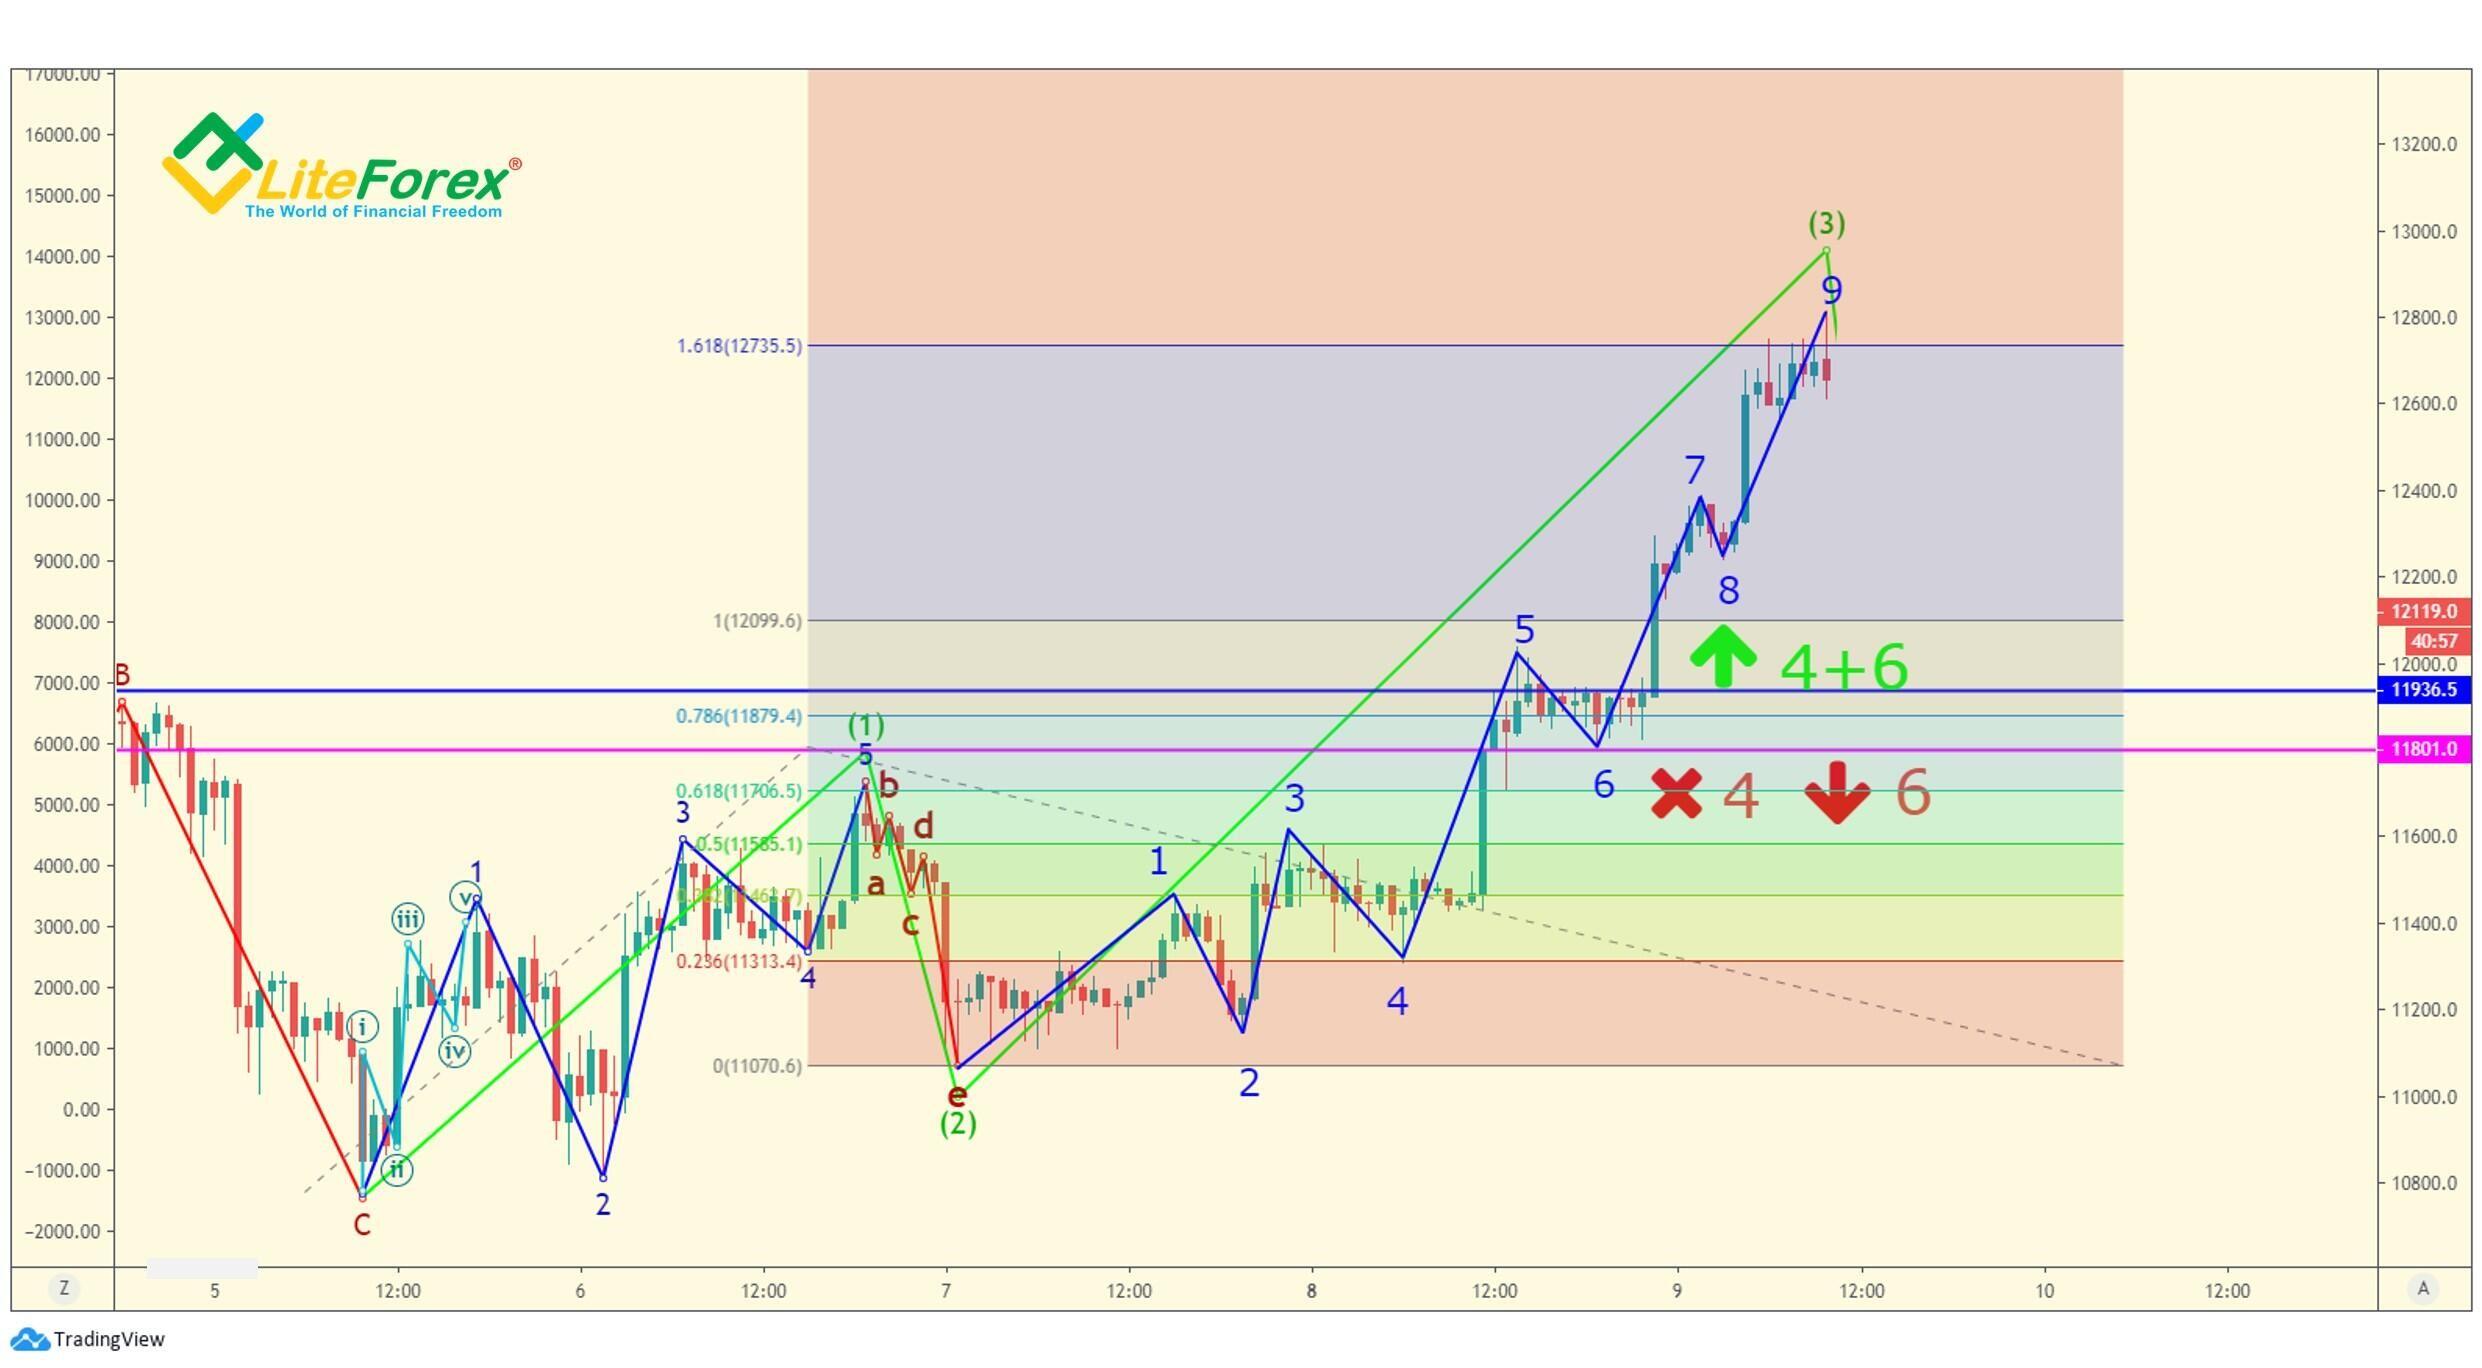
You should track the structure of the third wave while it is unfolding. In our case, the alternation principle works, and the third wave has an extension (wave (3) is much longer than wave (1)), it is easily divided into nine waves of a smaller degree, and the likely extension meets the alternation principle), the pattern is marked with blue lines in the chart. Besides, the end of the fifth wave is the critical point where the position should be closed.
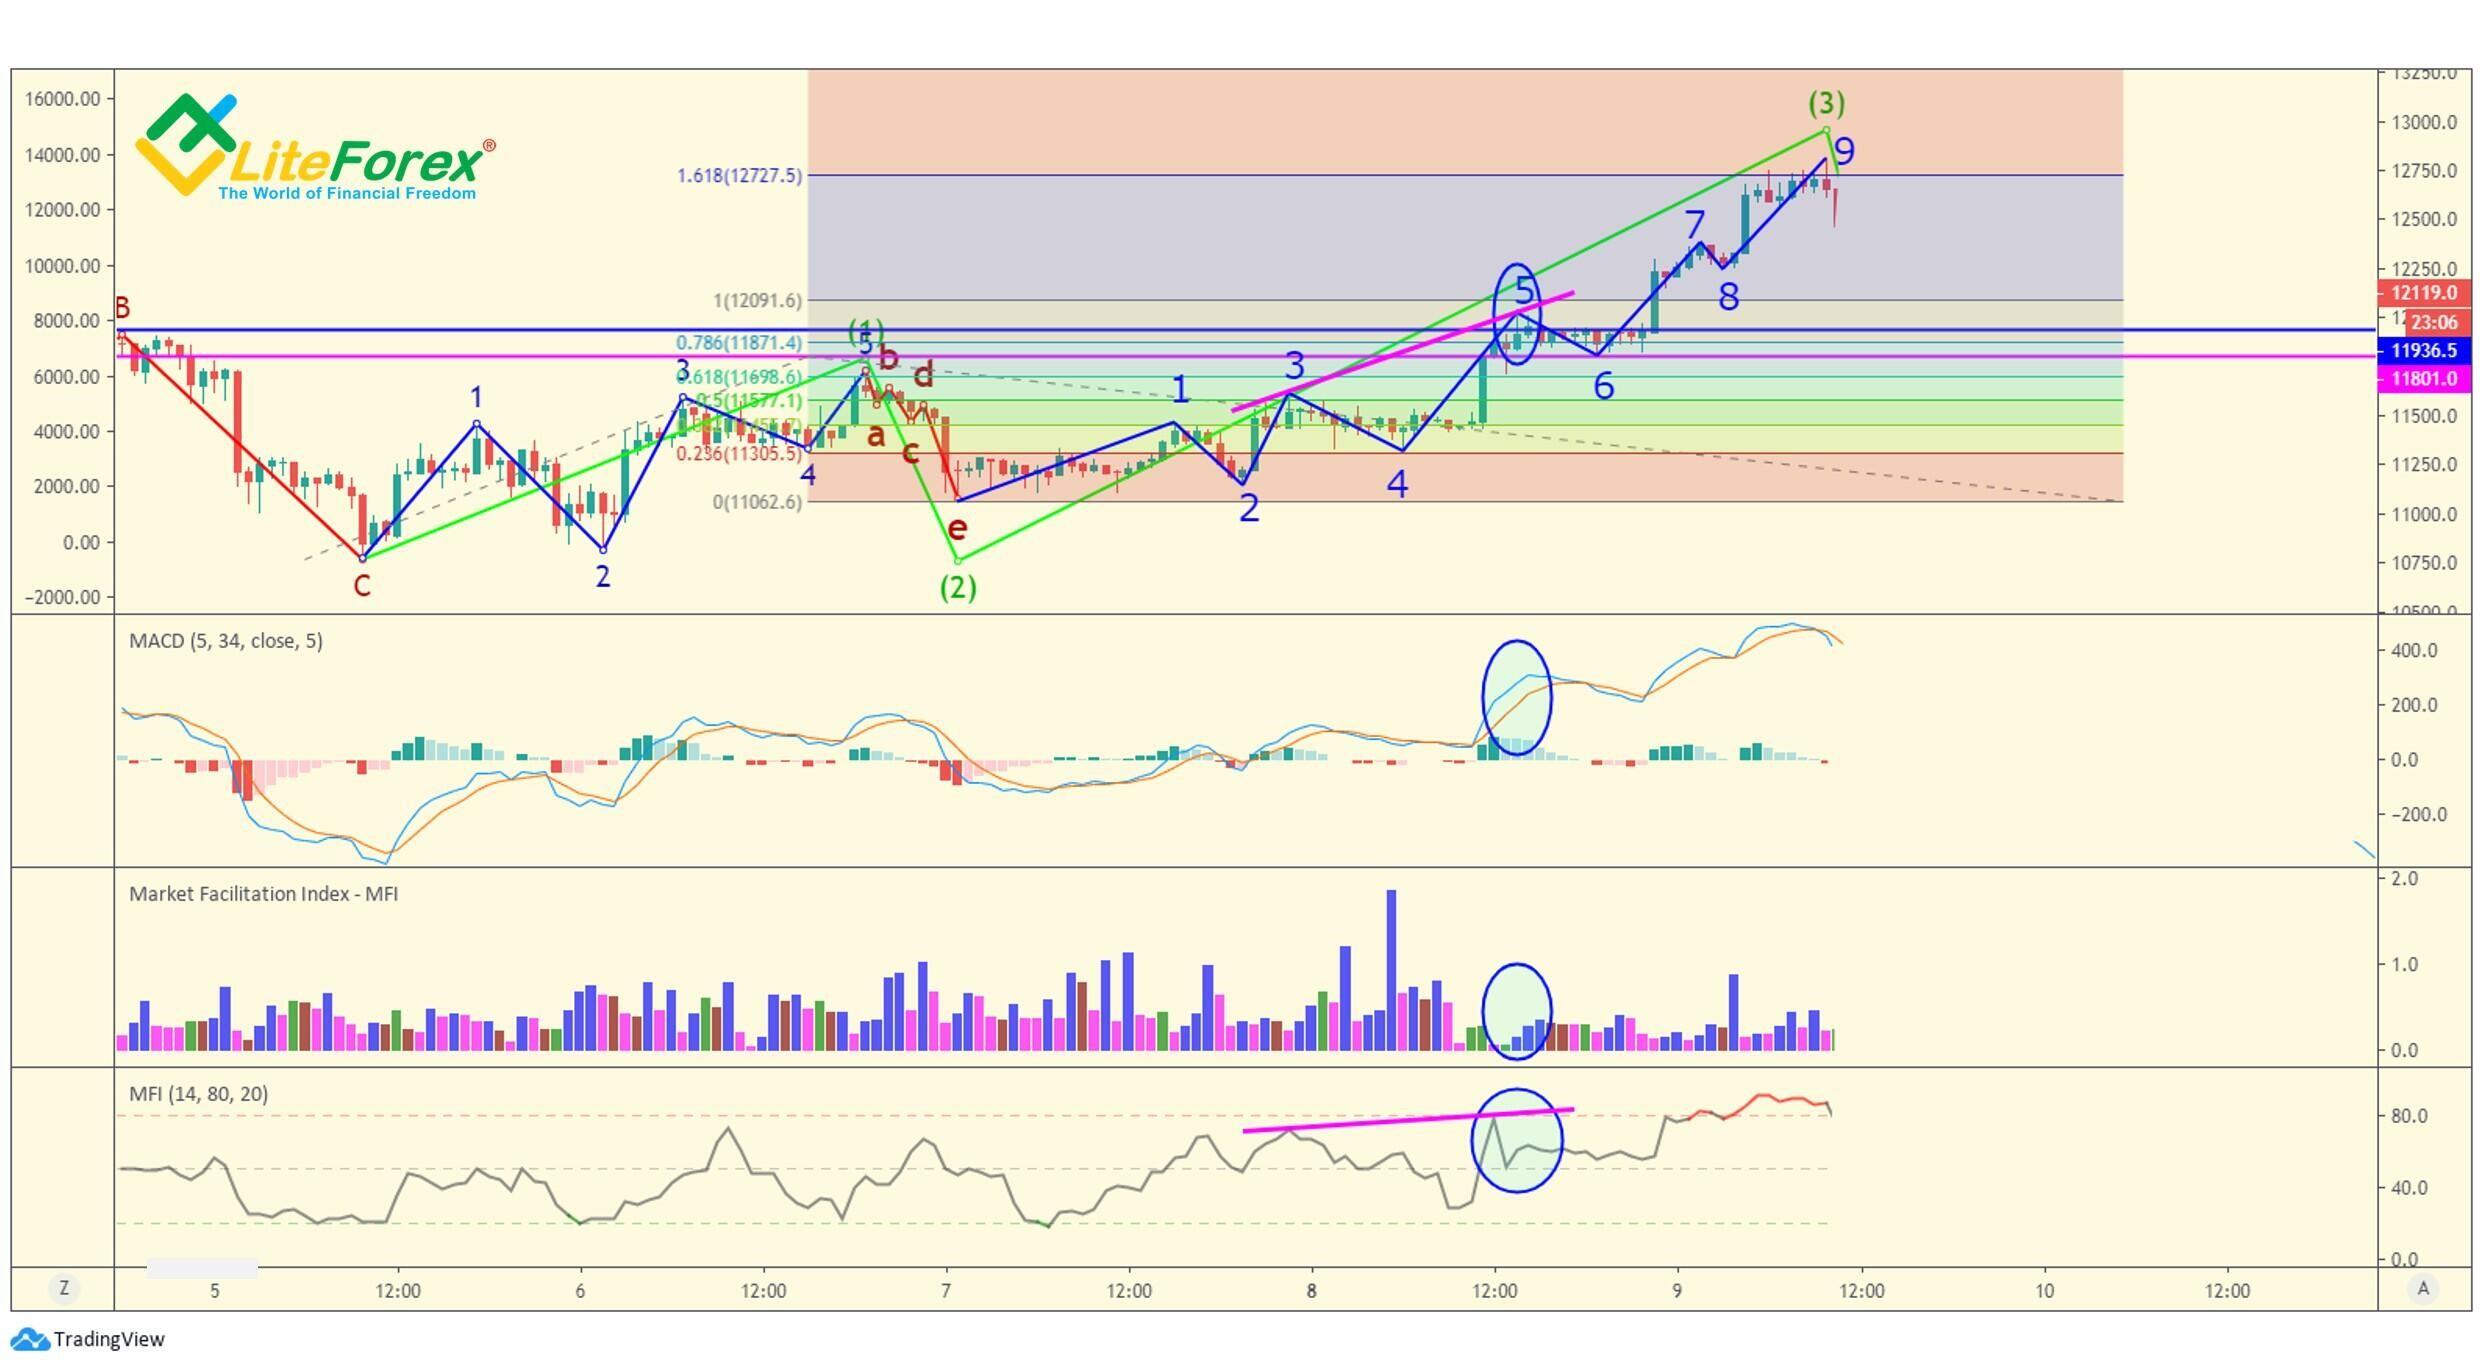
In our case, there are multiple reasons to continue trading. First, 100% of the first wave hasn’t reached by the end of the fifth sub-wave. As the first wave of the primary wave formation is not extended, the third wave should be at least equal to its length; it is usually longer.
Similar signals are delivered by indicators. MACD indicates the uptrend continuation, on the Market Facilitation Index chart, the squitting bar is followed by the green bar, and a few false bars after the green one suggest the situation is not clear. The classical MFI doesn’t signal the expected strong divergence (the divergence between the pink lines in the chart is minimal) that is most commonly present in the second phase of the trend development.
All of this suggests the third wave of the primary trend is not going to finish. An indirect signal of the trend continuation is a sluggish correction at the six sub-wave, that means the bulls are rather strong.
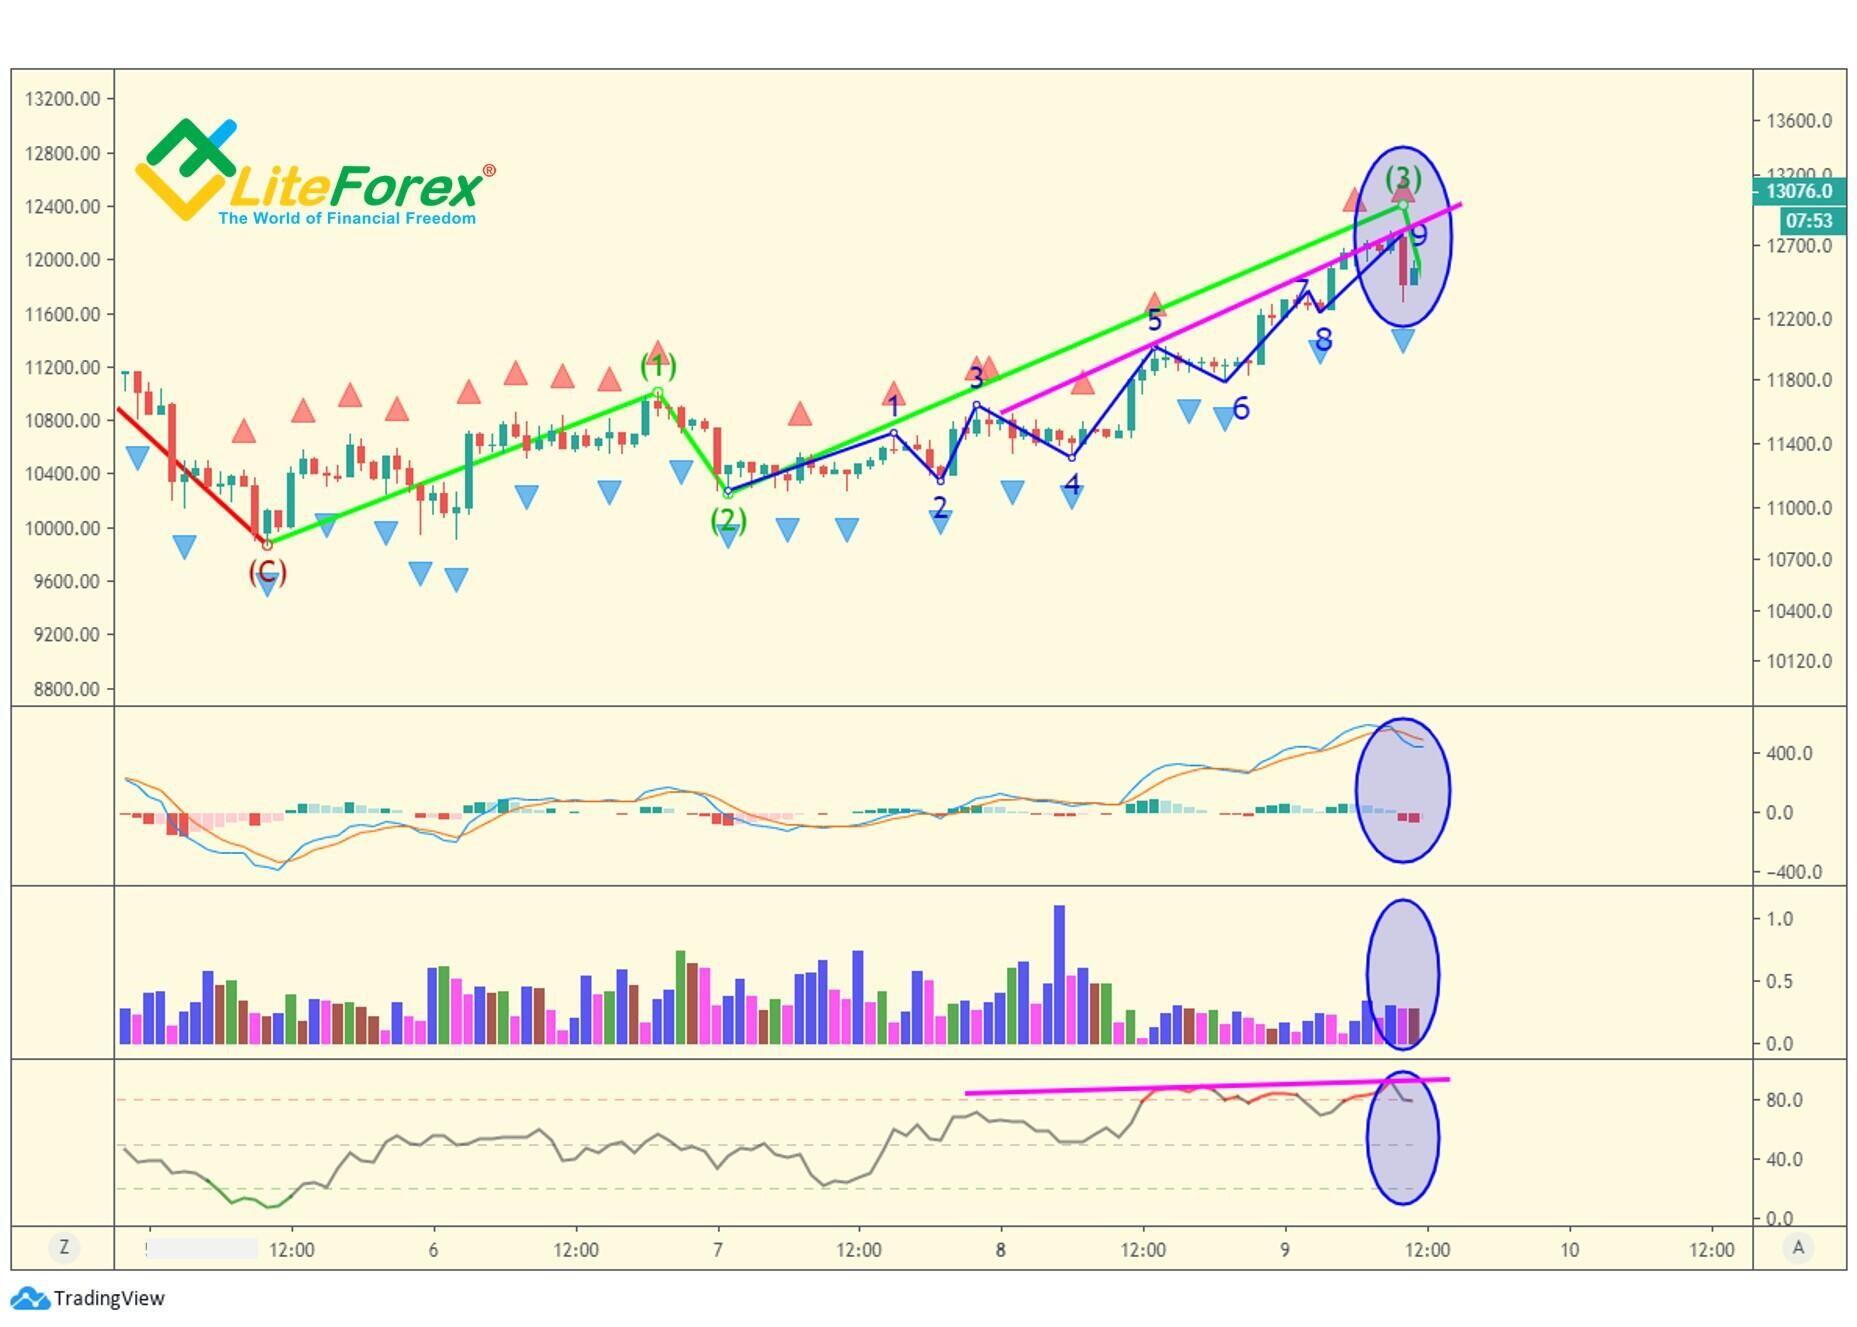
At the point of the expected end of the ninth sub-wave or the third wave of the primary degree, there are opposite signals. At this point, the price crosses the level of 1.618, and so, it is in the target zone even if the third wave is extended.
MACD indicates the price shift from the green bullish zone to the red zone and the MAs are crossing at the same time. At the expected top, there is a fractal and a squatting bar that is preceded by another squatting bar. And, finally, the classical DFI signal a stronger divergence, and its line is in the overbought area. This is a stronger signal that the ongoing trend is about to end.
When the third wave reaches level 1.618, and the five bullets appear, Williams recommends exiting seven orders out of 10 entered ones. In this case, the reasons for this decision are similar to the first wave. We take most of the potential profit and close seven BTCUSD positions, leaving three orders in the market in case the third wave is extended.
Here, I am finishing describing the first part of the new cryptocurrency trading strategy. Next item, I will deal with trading in the final phase of the five-wave pattern. I will also explain how to apply channeling in this trading system to more accurately identify the peaks of the fifth waves.
I wish you good luck and good profits!
P.S. Did you like my article? Share it in social networks: it will be the best "thank you" :)
Useful links:
- I recommend trying to trade with a reliable broker here. The system allows you to trade by yourself or copy successful traders from all across the globe.
- Use my promo code BLOG to get a 50% deposit bonus on the LiteFinance platform. Simply enter this code in the appropriate field when funding your trading account.
- Telegram chat for traders: https://t.me/litefinancebrokerchat. We are sharing the signals and trading experience.
- Telegram channel with high-quality analytics, Forex reviews, training articles, and other useful things for traders https://t.me/litefinance
Price chart of BTCUSD in real time mode
The content of this article reflects the author’s opinion and does not necessarily reflect the official position of LiteFinance broker. The material published on this page is provided for informational purposes only and should not be considered as the provision of investment advice for the purposes of Directive 2014/65/EU.
According to copyright law, this article is considered intellectual property, which includes a prohibition on copying and distributing it without consent.