The strategies of cryptocurrency trading via broker and application of all kinds of analysis to cryptocurrencies
Strategies for cryptocurrency trading in Forex: fundamental analysis, support and resistance levels, patterns, cryptocurrency correlations
LiteFinance will enlist 9 new cryptocurrency pairs to trade against the U. S. dollar, the euro, the Bitcoin and the Bitcoin Cash. We decided to take a small focus on trading strategies according to fundamental analysis, technical analysis, and describe the peculiarities of trading cryptocurrencies against the fiat money, and in relation to each other. From this article you will learn: what news the cryptocurrencies are the most responsive to, what the leading start-ups’ prospects are, how to trade according to patterns and resistance levels; you will also learn, how one can make profits from cryptocurrency price correlations
Cryptocurrency became the most profitable asset in 2017 and can well remain the leader in 2018. The advantage of cryptocurrency is its high volatility, allowing making profits up to 30-50% over 1-2 days, provided the scenario is positive. However, the high volatility involves high risk as well. If one, trading currency pairs, can lose a half of the position in a day only when using financial leverage, then in cryptocurrency trading, money can be lost without the leverage. But those, who wish to make money on sharp currency price swings, are not discouraged. As long as the market is moving in waves, there is always a chance to win back the former loss.
All the cryptocurrency trading supporters has received a pleasant surprise from LiteFinance. In addition to the usual pairs of USD/BTC and USD/ETH, there will be available such cryptocurrencies as Bitcoin Cash, Dashcoin, Ethereum, Ethereum Classic, LiteCoin, Monero, Ripple и ZCash. Moreover, to reduce the risk, traders will be able to insure the deposit, investing into correlated cryptocurrency pairs. For example, ВТС/ВСН and ВТС/ETH. These pairs volatility is a few times lower than that of the cryptocurrencies against fiat money. Read on, how one can make profits from these cryptocurrencies.
Cryptocurrency trading strategies
Forex has several advantages over cryptocurrency exchanges:
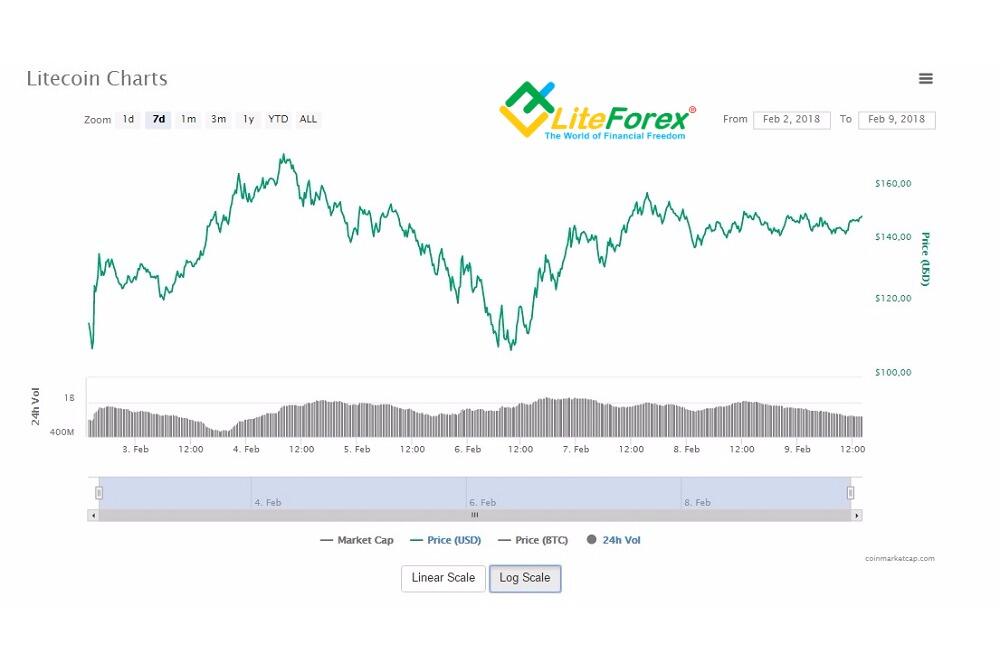
one can open short positions there. High volatility means that coins have long periods of rising and falling down. So, in case of a wrong forecast for the price direction, one simply needs to open a position in the opposite direction. As for the losing one, it should be either closed at a loss, or be held until the quotes reverse. Wave-like quotes moving is clearly seen in the daily chart of LTC/USD (Litecoin vs US Dollar). Apart from often intraday zigzags, the weekly wave is clearly visible;
the positions are opened and closed at the speed of a few milliseconds. It may take hours, to buy and sell cryptocurrencies through wallets;
safe deposit protection. Accounts on the broker services are never hacked. First, there is no point (CFD are traded), second, it is supervised by the regulator (nobody controls cryptocurrency exchanges)
Like in foreign exchange trading, fundamental and technical analyses can be applied to the cryptocurrency market as well. Cryptocurrency is a very young instrument, associated with a very high speculative component. So, both strategies have their own advantages and drawbacks. Let’s study the basics of trading, based on technical and fundamental analyses.
1. Trading based on fundamental analysis
The cryptocurrencies presented belong to three types of projects. Payment systems (ВТС, LTC, XRP); decentralized networks, used as a base to create applications (ETH); anonymizers, highly anonymous payment systems (XMR, DSH, ZEC). Consequently, the rates will be influenced by the corresponding news.
For example:
- ETH/USD (Ethereum vs US Dollar). This pair will be first affected by Vitalik Buterin’s statements about the performance of the fork in process, including the transition from PoW algorithm to PoS . There is still little information provided. Anyway, Ethereum is thought to be one of the best coins in the long run due to the potential interest of new projects, based on its platform;
- XMR/USD (Monero vs US Dollar). The cryptocurrency faces a strong opposition of the legislation. The coin, used in the market of gaming and other online services, is completely anonymous. This obstacle became one of the reason, why the project was excluded from Coin Market Cap TOP-10. However, in late January, there was information about a future possible XMR and LTC merger.
Besides, the cryptocurrency market will be influenced by general news: cryptocurrency exchanges’ bankruptcy, restrictions of cryptocurrency trading by the authorities in China and South Korea, where the turnover is the largest, recognition by legislation and large corporations.
2. Trading based on technical analysis
2.1. Trading based on support and resistance levels
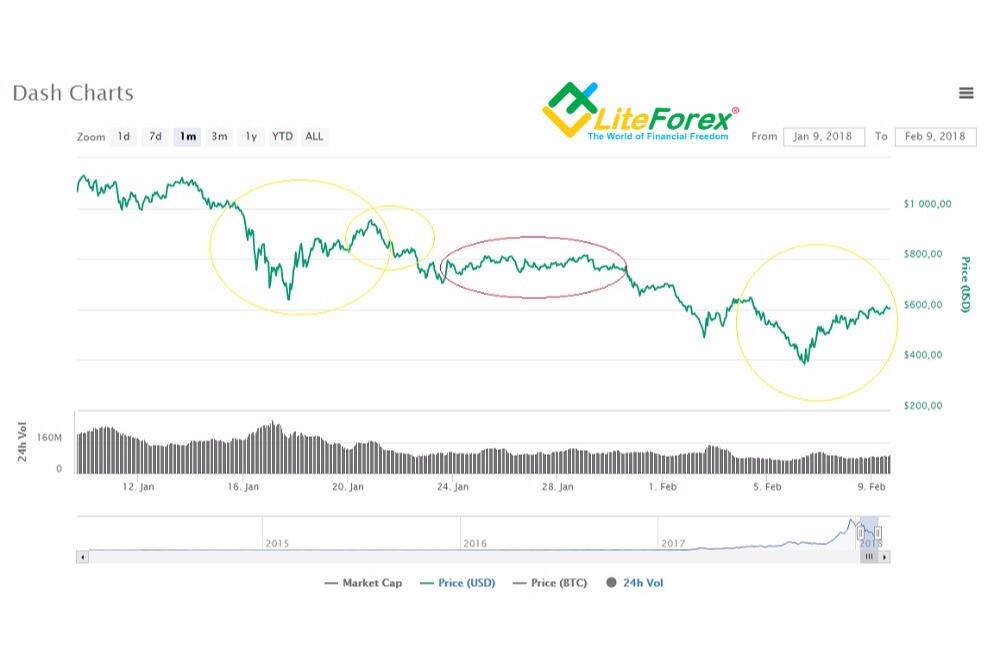
Graphical analysis proves to be quite effective in cryptocurrency trading. It is mostly about psychological levels, expressed in round numbers. For example, for BTC, they are 6000, 7000, and so on. Coins mostly depend on the levels with round values. It is easier for buyers to indicate a sell target at the level with a round number, where the trend reverses downwards. There is DSH/USD (DASH vs US Dollar) monthly chart below.
Although, the levels are not exactly touched, they are visible. The specific parts of the corridor are marked with a yellow circle. The first part is quite wide, bordered by the levels of $600 and $1000. The second one, already indicating the flat start, is market with the red circle, it is near the level of 800 USD. In the third zone, one can see, how the price rebounded from the level of 400 USD and, approaching the level of 600 USD, almost stopped.
Rules to arrange the support and resistance levels:
the level, arranged according to two points, is not accurate. Ideally, one needs at least three points. The price may not reach the level, or break it through a little, that won’t affect the general picture;
ideally, one should combine the levels, identified in short and long timeframes and compare, how much they coincide;
there are some useful indicators for MT4, which paint the levels automatically. For example, PowerDynamiteAreas, ATR Levels.
Conclusion: levels are quite clear in long timeframes, because most traders don’t usually hold the coins for long, making profits from the local surges. This psychological factor should be considered when developing a strategy. Some traders try to develop strategies based on Fibonacci levels, but, for cryptocurrencies, this technique doesn’t prove to be efficient, again, for the psychological reasons.
2.2. Trading based on chart patterns
Traders’ psychology is also expressed in cryptocurrency charts in the form of patterns – figures that indicate a potential trend reversal or a flat trading start. There are the examples of the most common patterns for cryptocurrency:
Pin bar. A candlestick with a very small body, compared to the previous ones, long shadow (tail) in the trend direction and a short (or no) opposite shadow. The pattern indicates that the price was progressing in the current timeframe, but, by the end of it, it returned back to almost where it had started. For a long position, this indicates that bulls have stopped and the trend is likely to reverse. The candlestick shadow (tail) is to be at least two times longer than the shadow of the previous one.
Three white soldiers (three advancing white soldiers). This pattern consists of three consecutive long-bodied candlesticks (ascending or descending), each of them exceeds the previous one. The pattern indicates the trend to have a distinct direction. They are usually followed by a slight correction, including 3-4 small candlesticks. One can open a position on the next candle in the major direction.
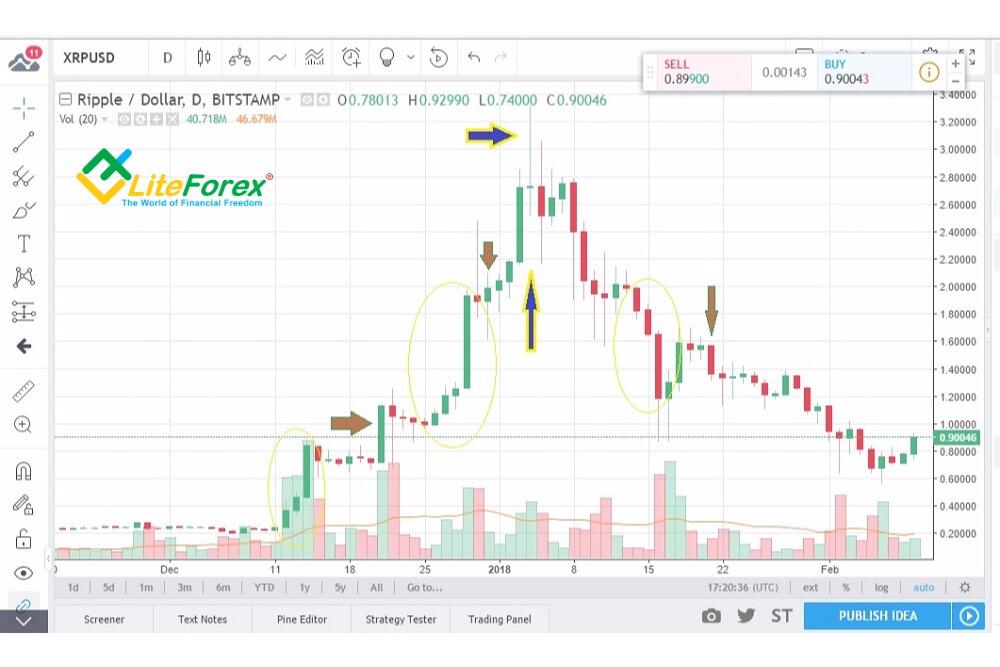
In the picture below, there is an example of a pin bar on XRP/USD pair, marked with the blue arrow. The second pattern is outlined with yellow ovals, and good entry points are marked with brown arrows.
Other, more rare and less accurate, but still useful patterns include the following ones:
double bottom (double top). Its a double price rebound from the support or resistance level. The first reversal may be only the correction before the level breakout. But, if a double bottom (top) is formed, followed by a rebound, the trend is likely to reverse;
head and shoulders. It is a reversal pattern that often occurs after a strong trend. It consists of three consecutive highs, the highest of which (head) is in the middle. The left shoulder features a peak and a slight correction. The head is followed by the right shoulder formation, which means, the trend is getting weaker. After that, one can safely open a short position. The example of this model is in the picture below. The right shoulder is not very distinct, though, the price slides down finally. It is a vivid example, why the pattern is complicated;
- triangles, flags, pennants are consolidation patterns, usually followed by the pattern borders breakout.
Another interesting tool of technical analysis is fractals. Those, who wish to study the pattern in more details, can read this article, written by a professional trader. Experience has shown that graphical analysis in cryptocurrency market works like in foreign exchange currency pairs. One should only identify the patterns in time and combine them with fundamental analysis and the support and resistance levels.
If we speak about technical indicators, then, in the cryptocurrency charts, quite accurate signals are provided by stochastic, MACD, RSI, Momentum, ZigZag, moving averages. The best period to analyze is 4 hours and longer, as it smoothens the volatility.
3. Trading correlated cryptocurrency pairs
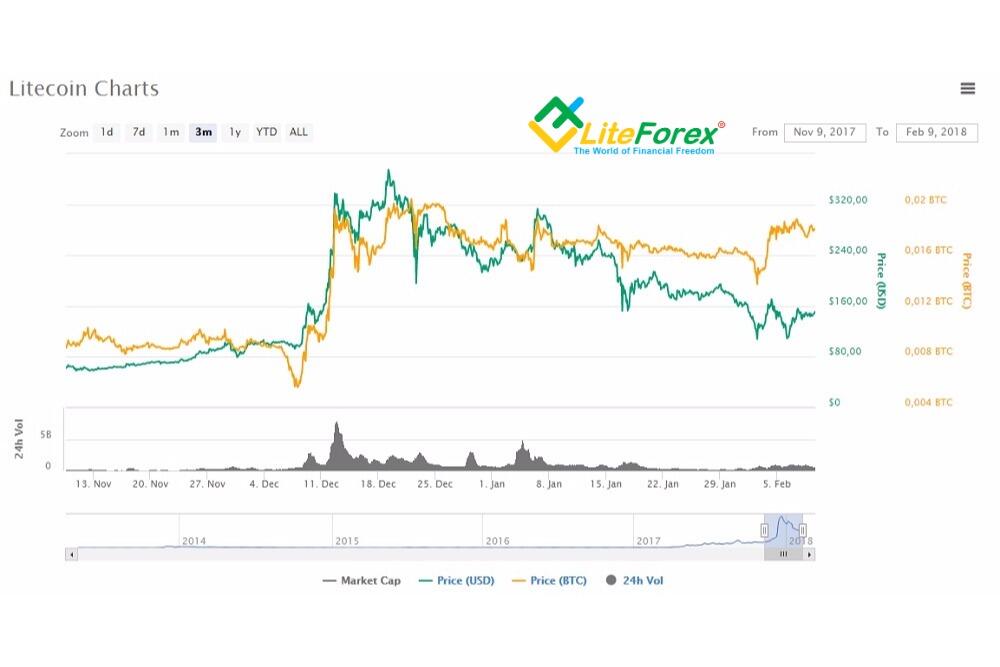
In comparison to U.S. dollar-related currency pairs, correlated pairs are less volatile. The strengths of the currency in the pair, experience proves, is determined by the market enthusiasm and its trust in the project. A vivid example is strong swings in the recent month. At the time of rapid growth, the “dinosaurs”, ВТС and ЕТН were increasing slower. However, at a time of decline, they drew down less. It is clearly seen on the example of XRP/BTC (Ripple vs Bitcoin) pair: the green line is the price in U.S. dollars, the yellow one – in BTC.
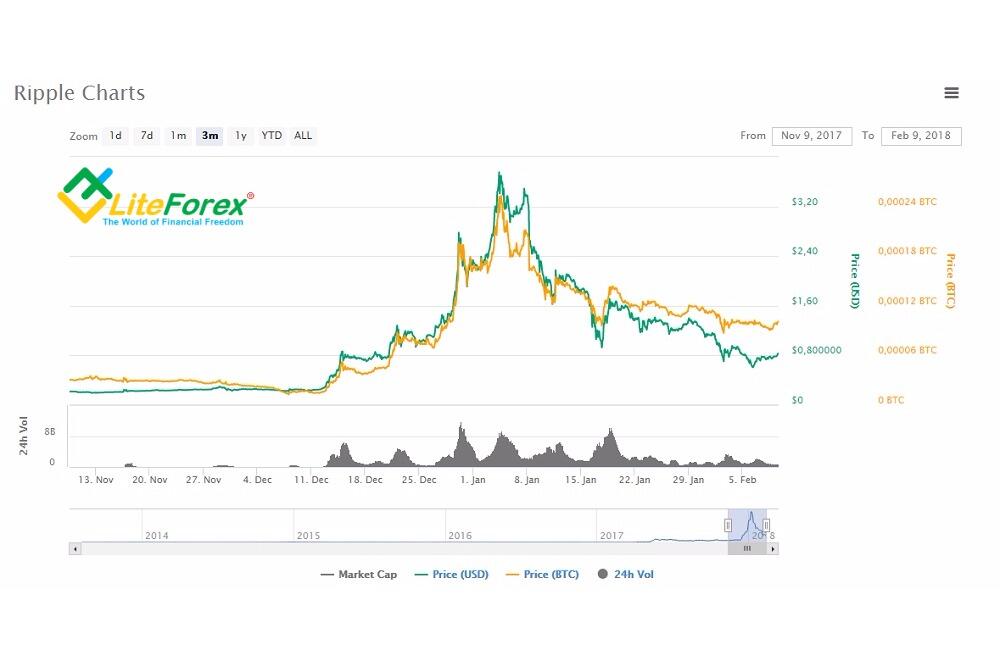
When the whole cryptocurrency market was growing, Ripple price was increasing against both currencies, that is, Bitcoin against dollar was growing slower than Ripple. But at the time of the drawdown, the green line fell down below the yellow one. That means, Bitcoin was dropping in price slower than Ripple. That is proved by bitcoin share in the capitalization. On the 13th-14th of January, it was about 32%-32.5% in the total market cap of $750 billion. Now BTC proportion is about 35% in the total capitalization of $400 billion. The charts of the other cryptocurrencies look similar. LTC/BTC (Litecoin vs Bitcoin) pair was declining with same rate, which is indicated by a relatively flat yellow line, compared to the descending green one.
Even greater, against BTC, was the drawdown of DSH/BTC (DASH vs Bitcoin) and ZEC/BTC (ZCash vs Bitcoin) pairs.
Conclusion. At a time of the rapid market growth, it is reasonable to bet on BTC drawdown against younger projects, but when the market is falling down, it is sensible to redirect the capital to BTC. Bitcoin is a too old payment system with lots of problems of scalability and transaction speed. At a time of general rise, investors prefer trusting in young Bitcoin counterparts (that explains the decline in Bitcoin proportion in total capitalization from 60% in late 2017 down to 35% in late February, 2018). But at a time of panic, BTC is far more trusted due to its status in the world economic community.
Technical analysis can be applied to these pairs as well. And finally, some tips on Forex cryptocurrency trading:
don’t use financial leverage, or use it very carefully. Remember, positions can be closed by stop-out due to volatility;
trade intraday - save up on swaps;
limit the application of trading advisors, you’d better trade manually. The market is mostly ruled by psychological and fundamental factors
The average daily volatility of the cryptocurrency pairs, offered by LiteFinance is 0.5%-6%. Compared to foreign exchange currency pairs, it is quite a decent return. So, open a demo account, test the new instrument and attentively follow the news. We wish you successful trading!
P.S. Did you like my article? Share it in social networks: it will be the best "thank you" :)
Useful links:
- I recommend trying to trade with a reliable broker here. The system allows you to trade by yourself or copy successful traders from all across the globe.
- Use my promo code BLOG to get a 50% deposit bonus on the LiteFinance platform. Simply enter this code in the appropriate field when funding your trading account.
- Telegram chat for traders: https://t.me/litefinancebrokerchat. We are sharing the signals and trading experience.
- Telegram channel with high-quality analytics, Forex reviews, training articles, and other useful things for traders https://t.me/litefinance
The content of this article reflects the author’s opinion and does not necessarily reflect the official position of LiteFinance broker. The material published on this page is provided for informational purposes only and should not be considered as the provision of investment advice for the purposes of Directive 2014/65/EU.
According to copyright law, this article is considered intellectual property, which includes a prohibition on copying and distributing it without consent.