Types of corrections. Five bullets. Trading plan
Types of corrections. Five bullets. Trading plan
Dear friends!
In the previous article, I wrote about Elliott Waves, described the wave structure and the ways to identify the starting and the ending points of each motive wave in the Elliott Wave pattern.
Today, I will explain different types of corrections in Forex, their differences, the rules of wave constructing that will reduce the chance of an error. And, finally, I will write how you can use the Elliott wave formation of the trend to take the maximum profit.
Types of corrections
As I already wrote in the previous article, corrections are normally classified as simple or complex. Let us see how they differ from each other.
Simple correction
Simple correction refers to zigzag corrections that consist of three elements A, B, and C. The first wave, the A wave usually contains five smaller waves. So, already at the beginning of the correction, you can count how many waves there are within the A wave. Therefore, if five waves can be identified in wave a, expect a tradable zigzag pattern to materialize.
The next wave, the B wave usually contains three smaller waves. It is Once the five waves of wave A are finished, the B wave correction normally will not retrace more than 62% of the A wave’s length. Very rarely, it may correct to 75% of the length of wave A.
And the final wave, wave C, similar to wave 3 in an impulse pattern, is very often the longest (100%-162% of wave A length), giving an excellent opportunity to gain. It consists of five smaller waves.
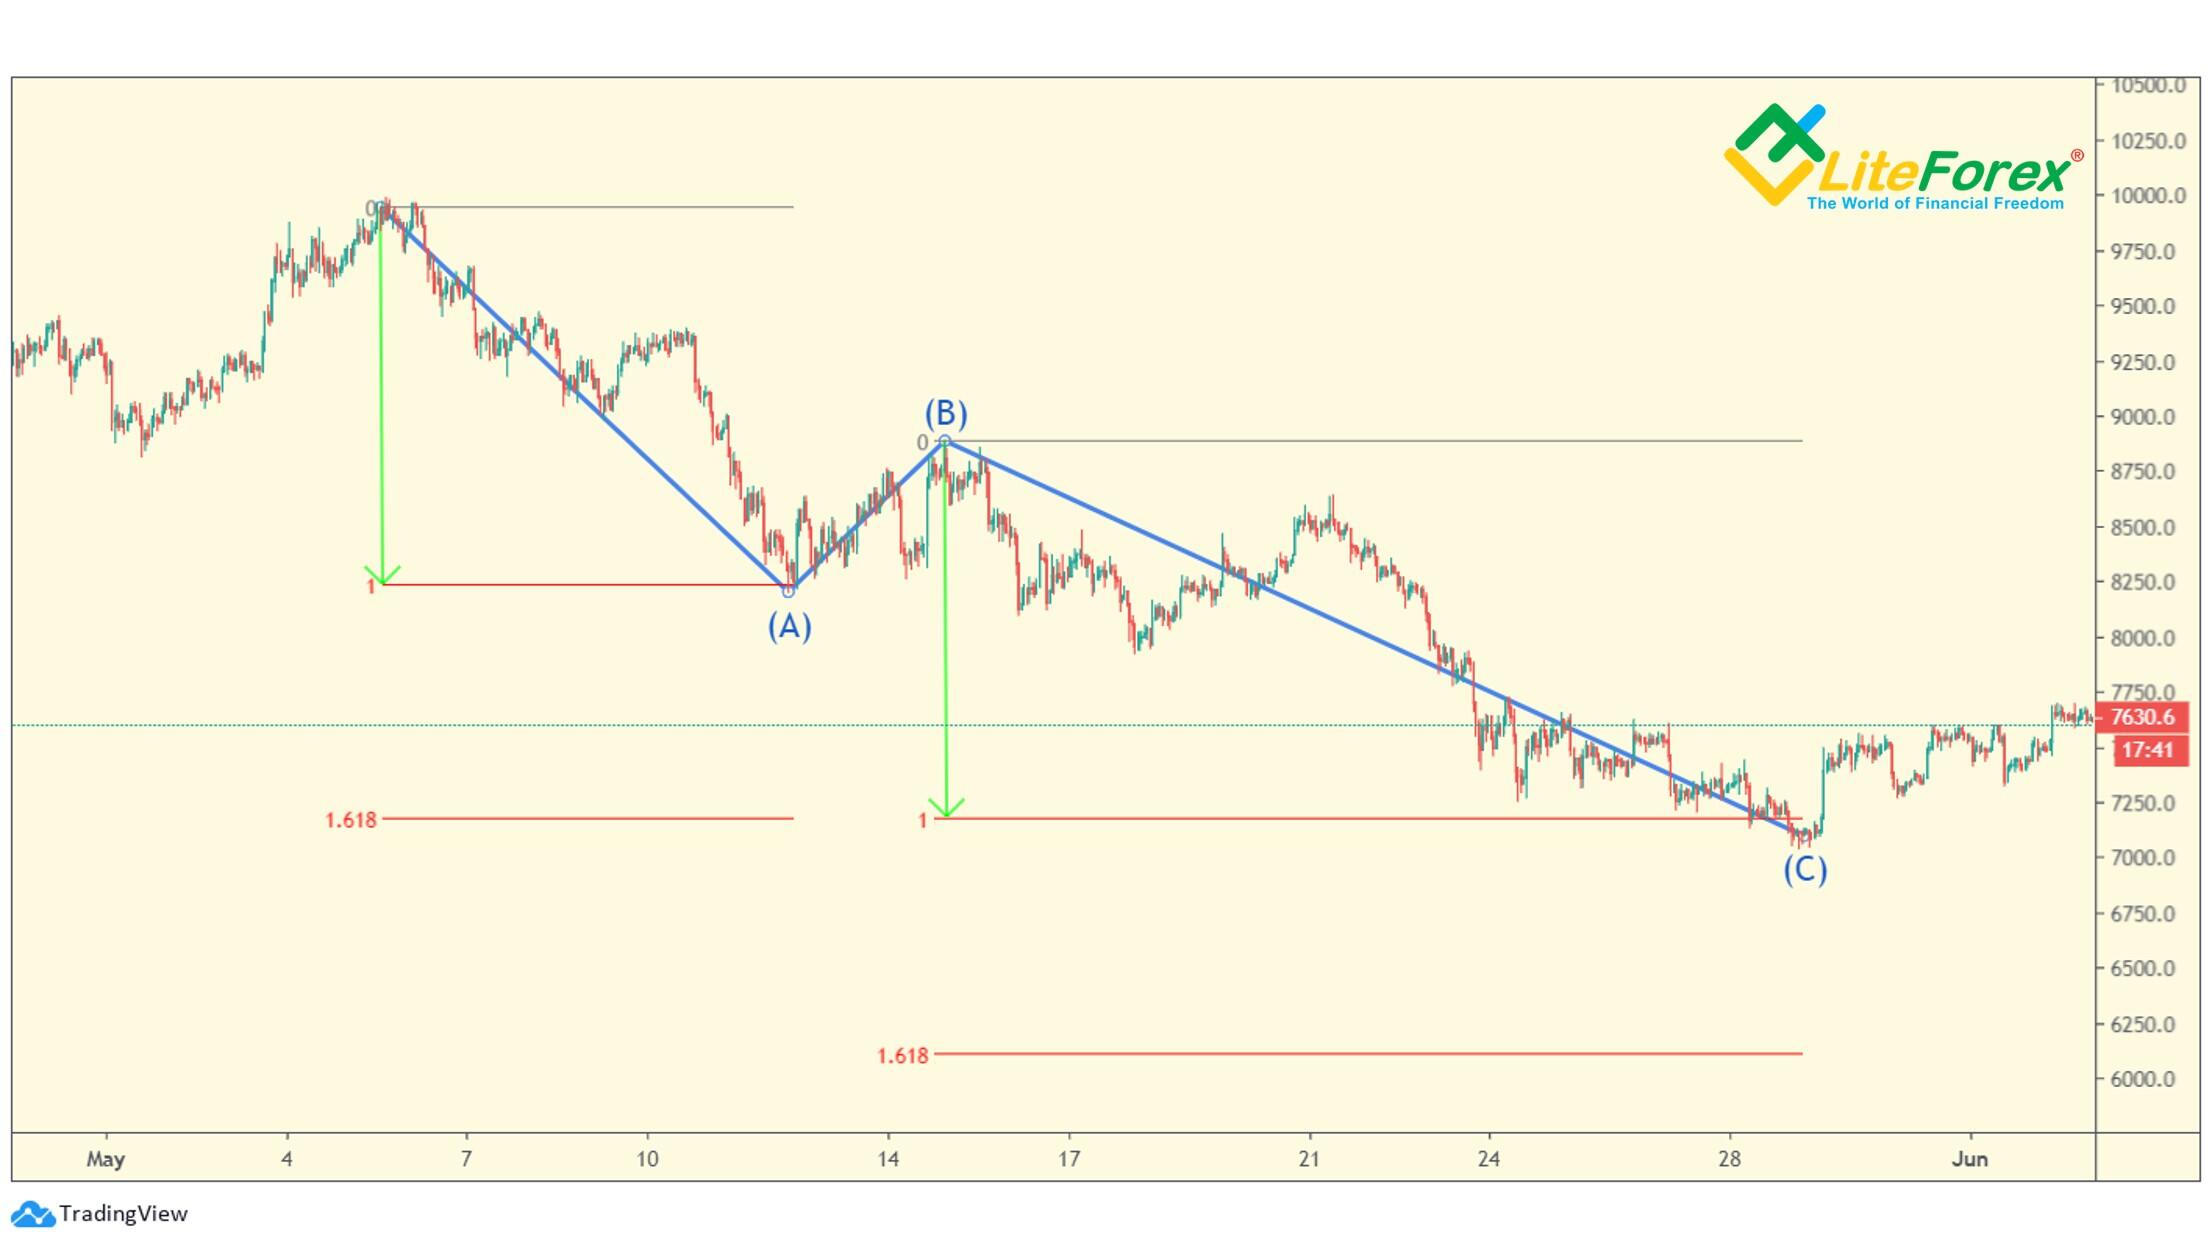
The above chart displays the structure of a simple corrective wave pattern.
Complex corrections
Bill Williams defines three types of complex corrections:
- flat correction
- irregular correction
- triangle correction
Flat correction
A flat correction consists of three waves with the structure of 3-3-5. In a flat correction, each wave is almost identical/equal.
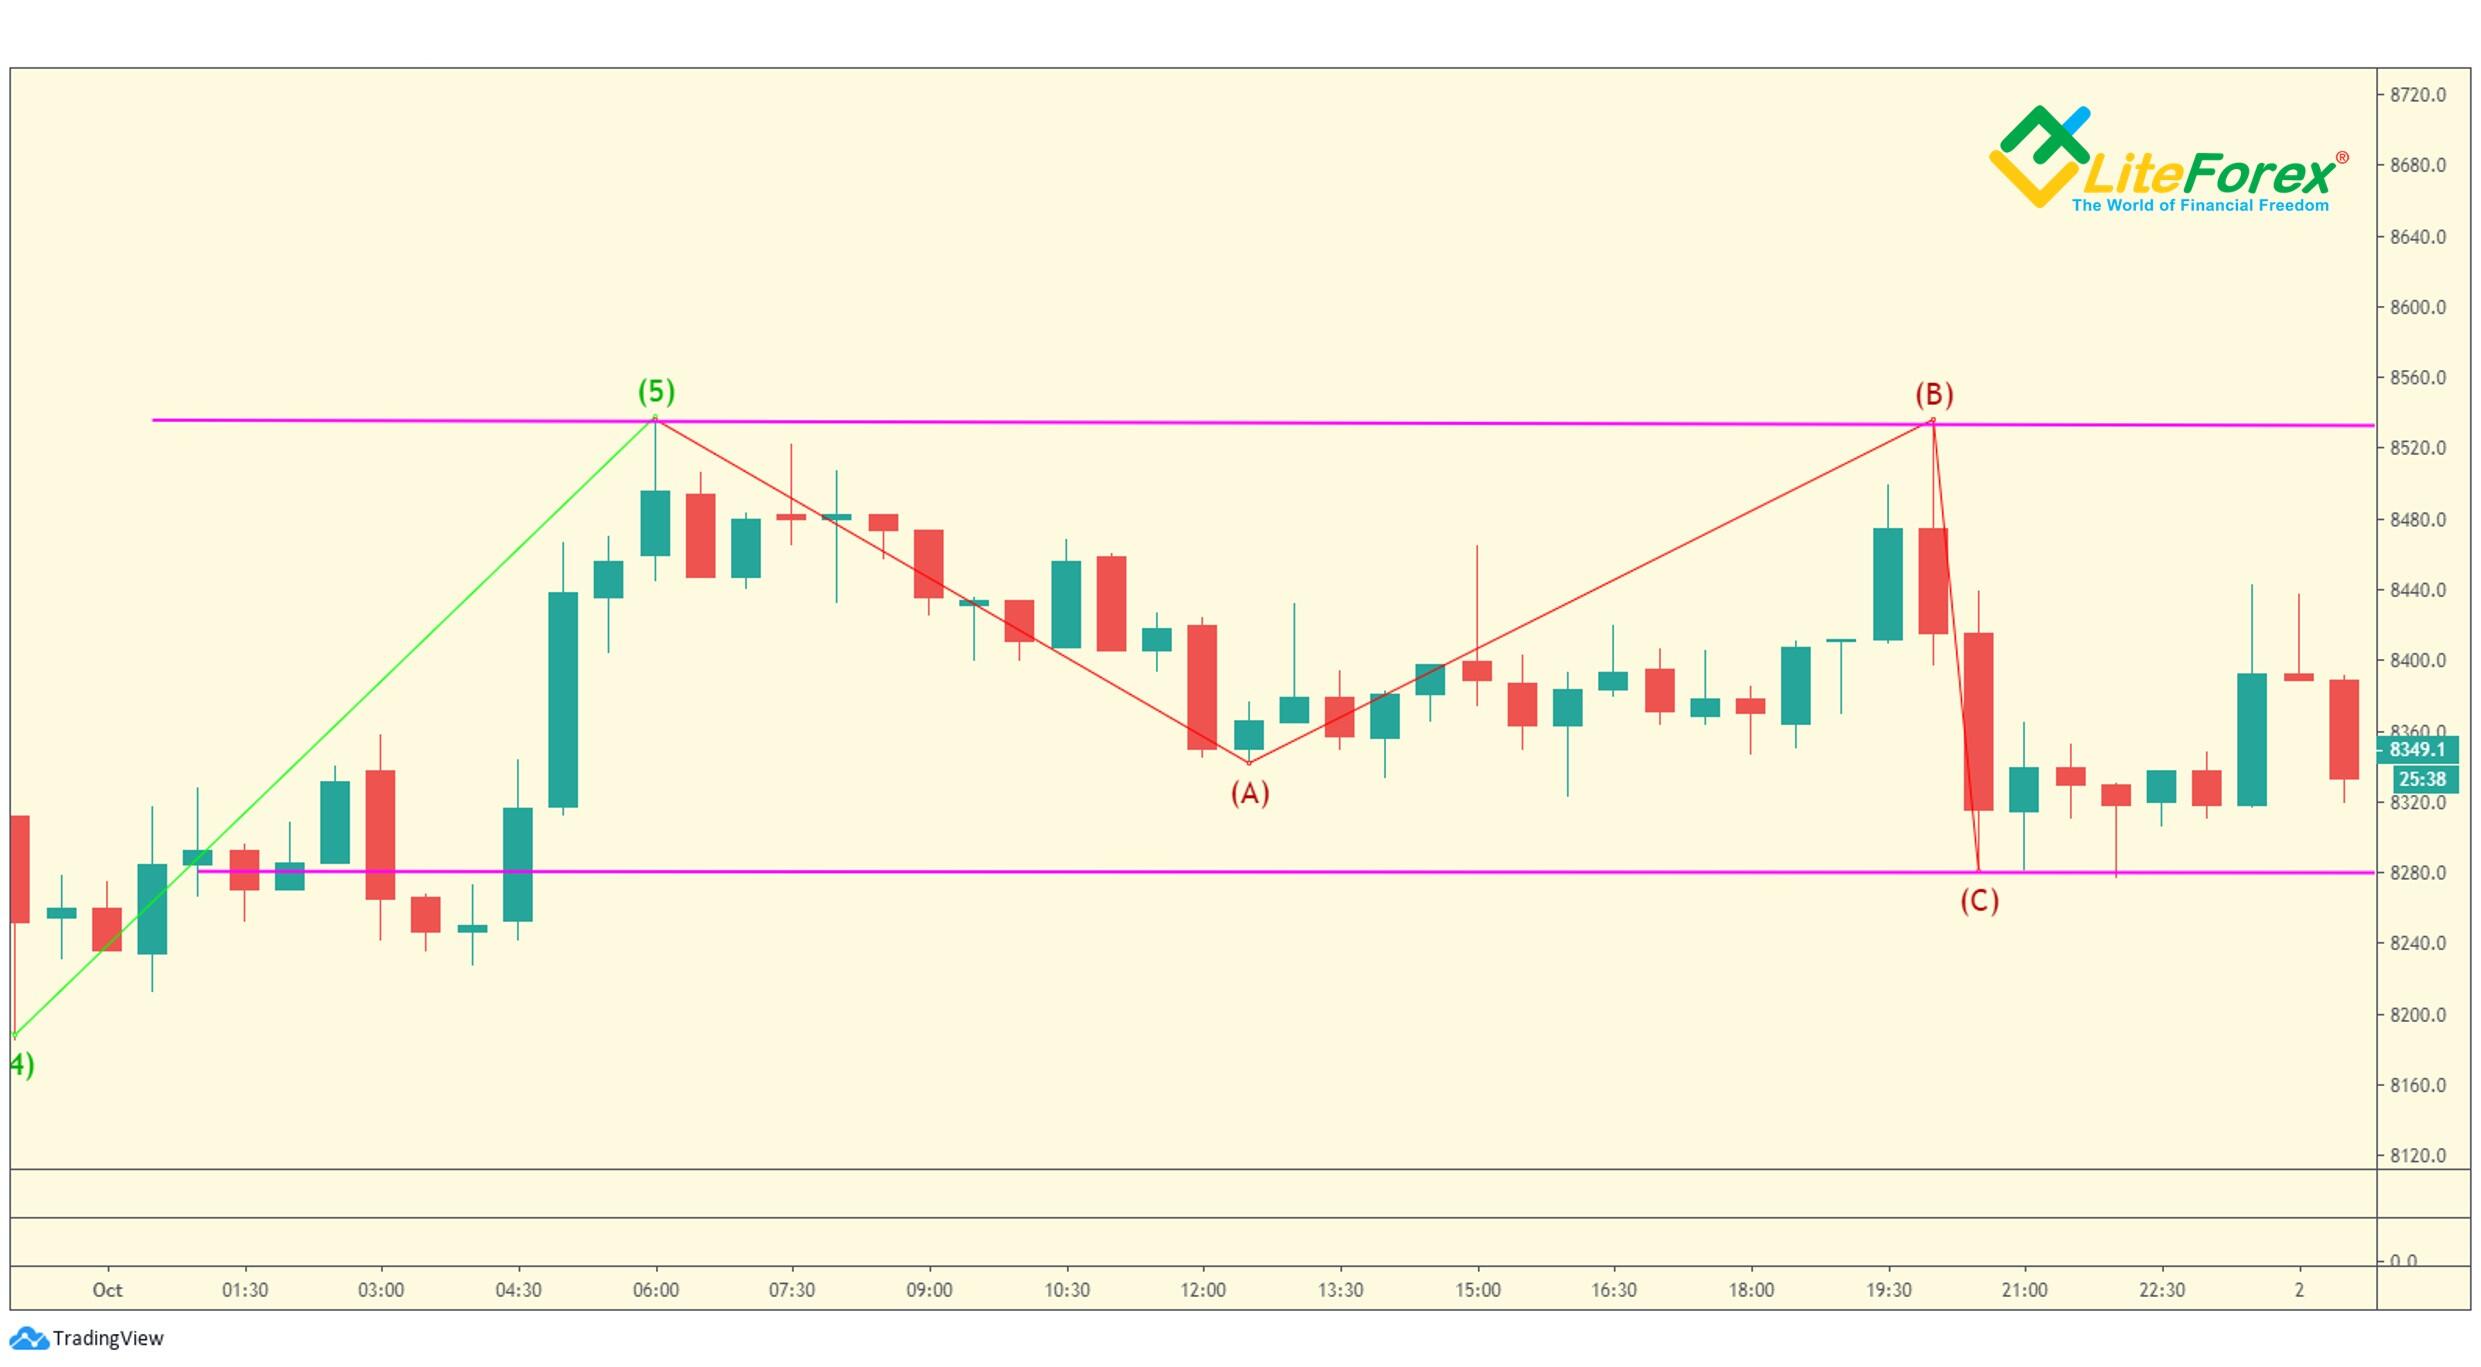
The above BTCUSD chart displays an example of a flat correction. Its waves are almost equal.
Irregular correction
Irregular correction is a three-wave formation with the structure of 3-3-5, where the B wave exceeds the high of the last impulse wave (wave 5). The correction is complex is the B wave retraces more than 75% of wave A. Besides, in most cases, the length of the B wave is in the range of 115%-125% of the length of wave A. The longest is the C wave, whose length is from 162% to 262% of wave A on average. It means that it is the most promising to trade.
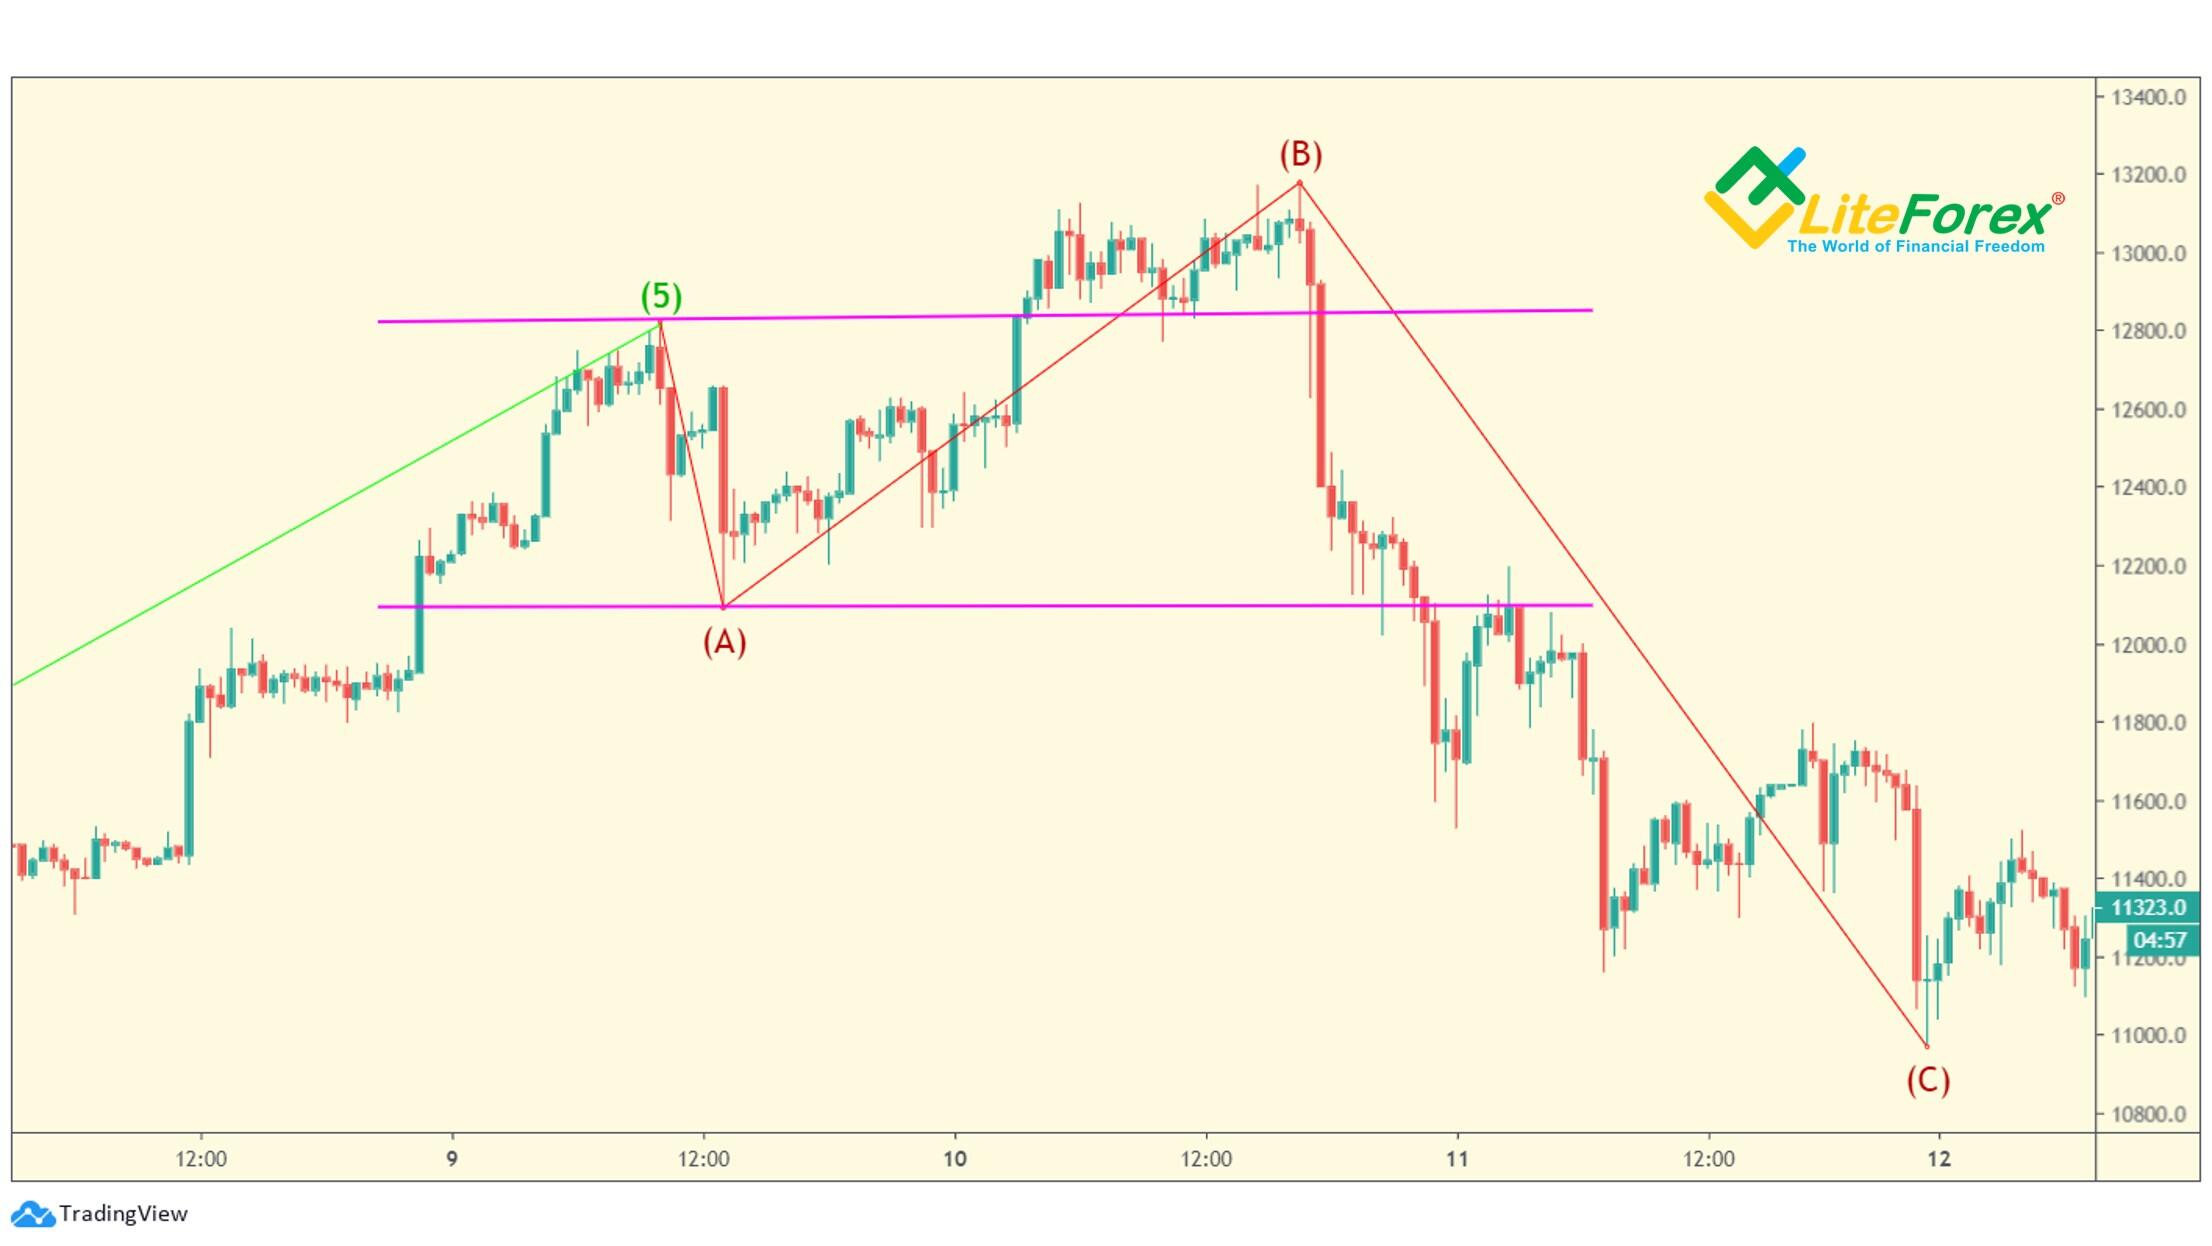
The BTCUSD chart displays an irregular correction. The B wave exceeds the high of the A wave, and after the B wave completes, there emerges the longest wave in the pattern, the down wave C, breaking through the low of the A wave.
Triangle
A triangle correction is a five-wave pattern that usually occurs in wave B of a three-wave formation or wave 4 of an impulse. All waves of the pattern overlap each other. There forms a large wave A, followed by smaller waves B, C, D and E. A distinguishing feature of triangles is that they are immediately followed by a sharp price swing in the direction opposite the E wave.
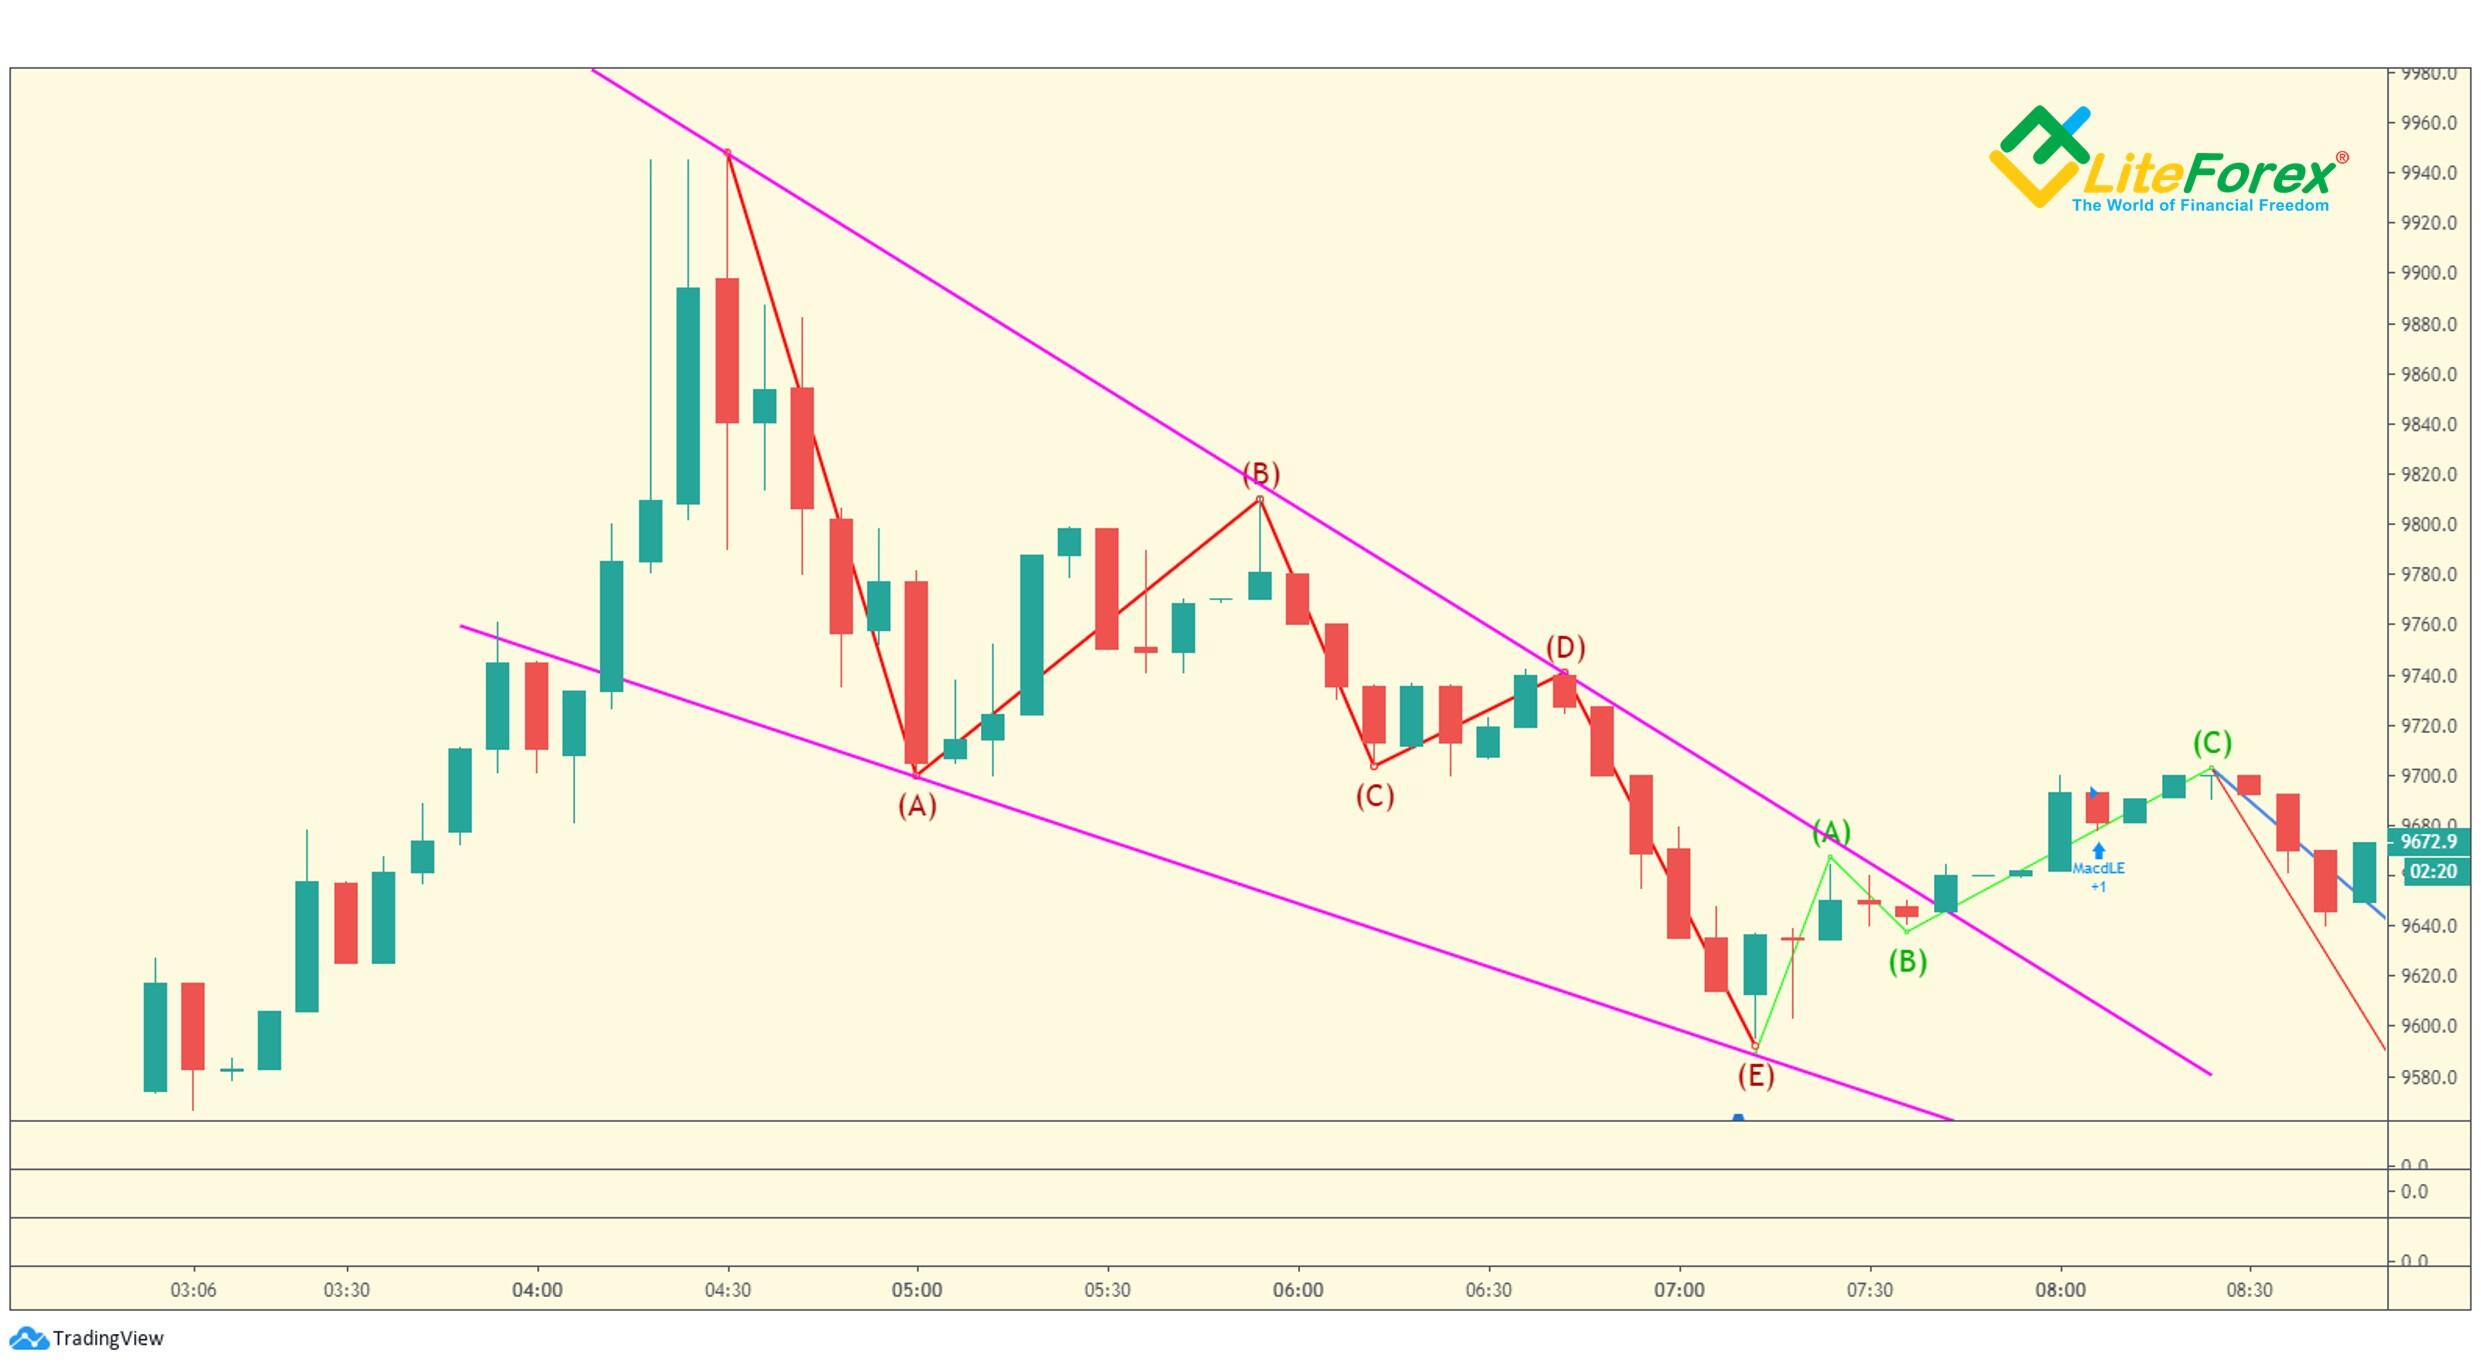
The above chart displays a triangle. It is marked by purple lines indicating that the later waves in the formation are smaller than the earlier ones. As you see in the chart, the end of the E wave is followed by the bullish correction.
Looking through Profitunity windows of Bill Williams
This one of the major problems of the Elliott Waves analysis. In the previous article, I already wrote about Bill Williams’s indicator Money Flow Index or MFI from his book Trading Chaos that helps us solve this problem. However, Bill Williams went even further and designed another technical analysis indicator that spots tick volumes and the MFI together, having created an incredibly accurate indicator showing the current market situation.
You can find this indicator referred to as the Market Facilitation Index (MFI) on the TradingView platform. I want to stress once again that this indicator analyzes the volume change for one tick. Do not confuse it with the classical volume indicator. The tick volume analyzes the change of price for one tick during the period of the bar formation. Do not also confuse the indicators Market Facilitation Index and Money Flow Index, their names in contracted forms look the same.
Bill Williams defines for states of the Market Facilitation Index indicator:
| Action | Name of the signal | Color of the bar in TradingView |
| MFI value and volume grow | Green bar | green |
| The volume and indicator values fall simultaneously | Withering bar | brown |
| Tick volume is falling but the MFI value is growing | False bar | blue |
| Tick volume is growing but the MFI value is falling | Squat (squatting) bar | pink |
Let us see each signal in more detail.
Green Bar
This bar is a kind of green-light to the market trend currently developing. It means that the number of transactions made by traders increases and happens the active movement of the market in the direction of a trend. New players add the volumes to the market in hope for the continuation of a tendency. It is best to enter a trade in the trend direction in the current situation.
In the above chart, green arrows mark green bars corresponding to the wave move direction, red cross marks the bar that is moving contrary to the trend. As you see, most green bars can be treated as an indirect confirmation of the trend continuation. However, in some rare instances, this indicator may send false signals, and so, its signals should be analyzed together with other signals.
Withering bar
The situation occurs when the volume and indicator values fall simultaneously. Traders lose their interest in the current trend, preferring to close positions, the trend slows down. In this case, the MFI indicator paints a brown bar. This signal suggests that the current asset value either ceases to meet the expectations of most traders or does not yet meet them.
Withering bars can be sometimes seen at the peaks of Elliott Waves, especially at the top of wave 1. On the one hand, it signals that the current trend is at its final stage, on the other hand, you shouldn’t treat as an early signal of a new strong trend. So, when there appears a withering bar, traders must be alerted to spot other signals indicating the inception of a new trend.
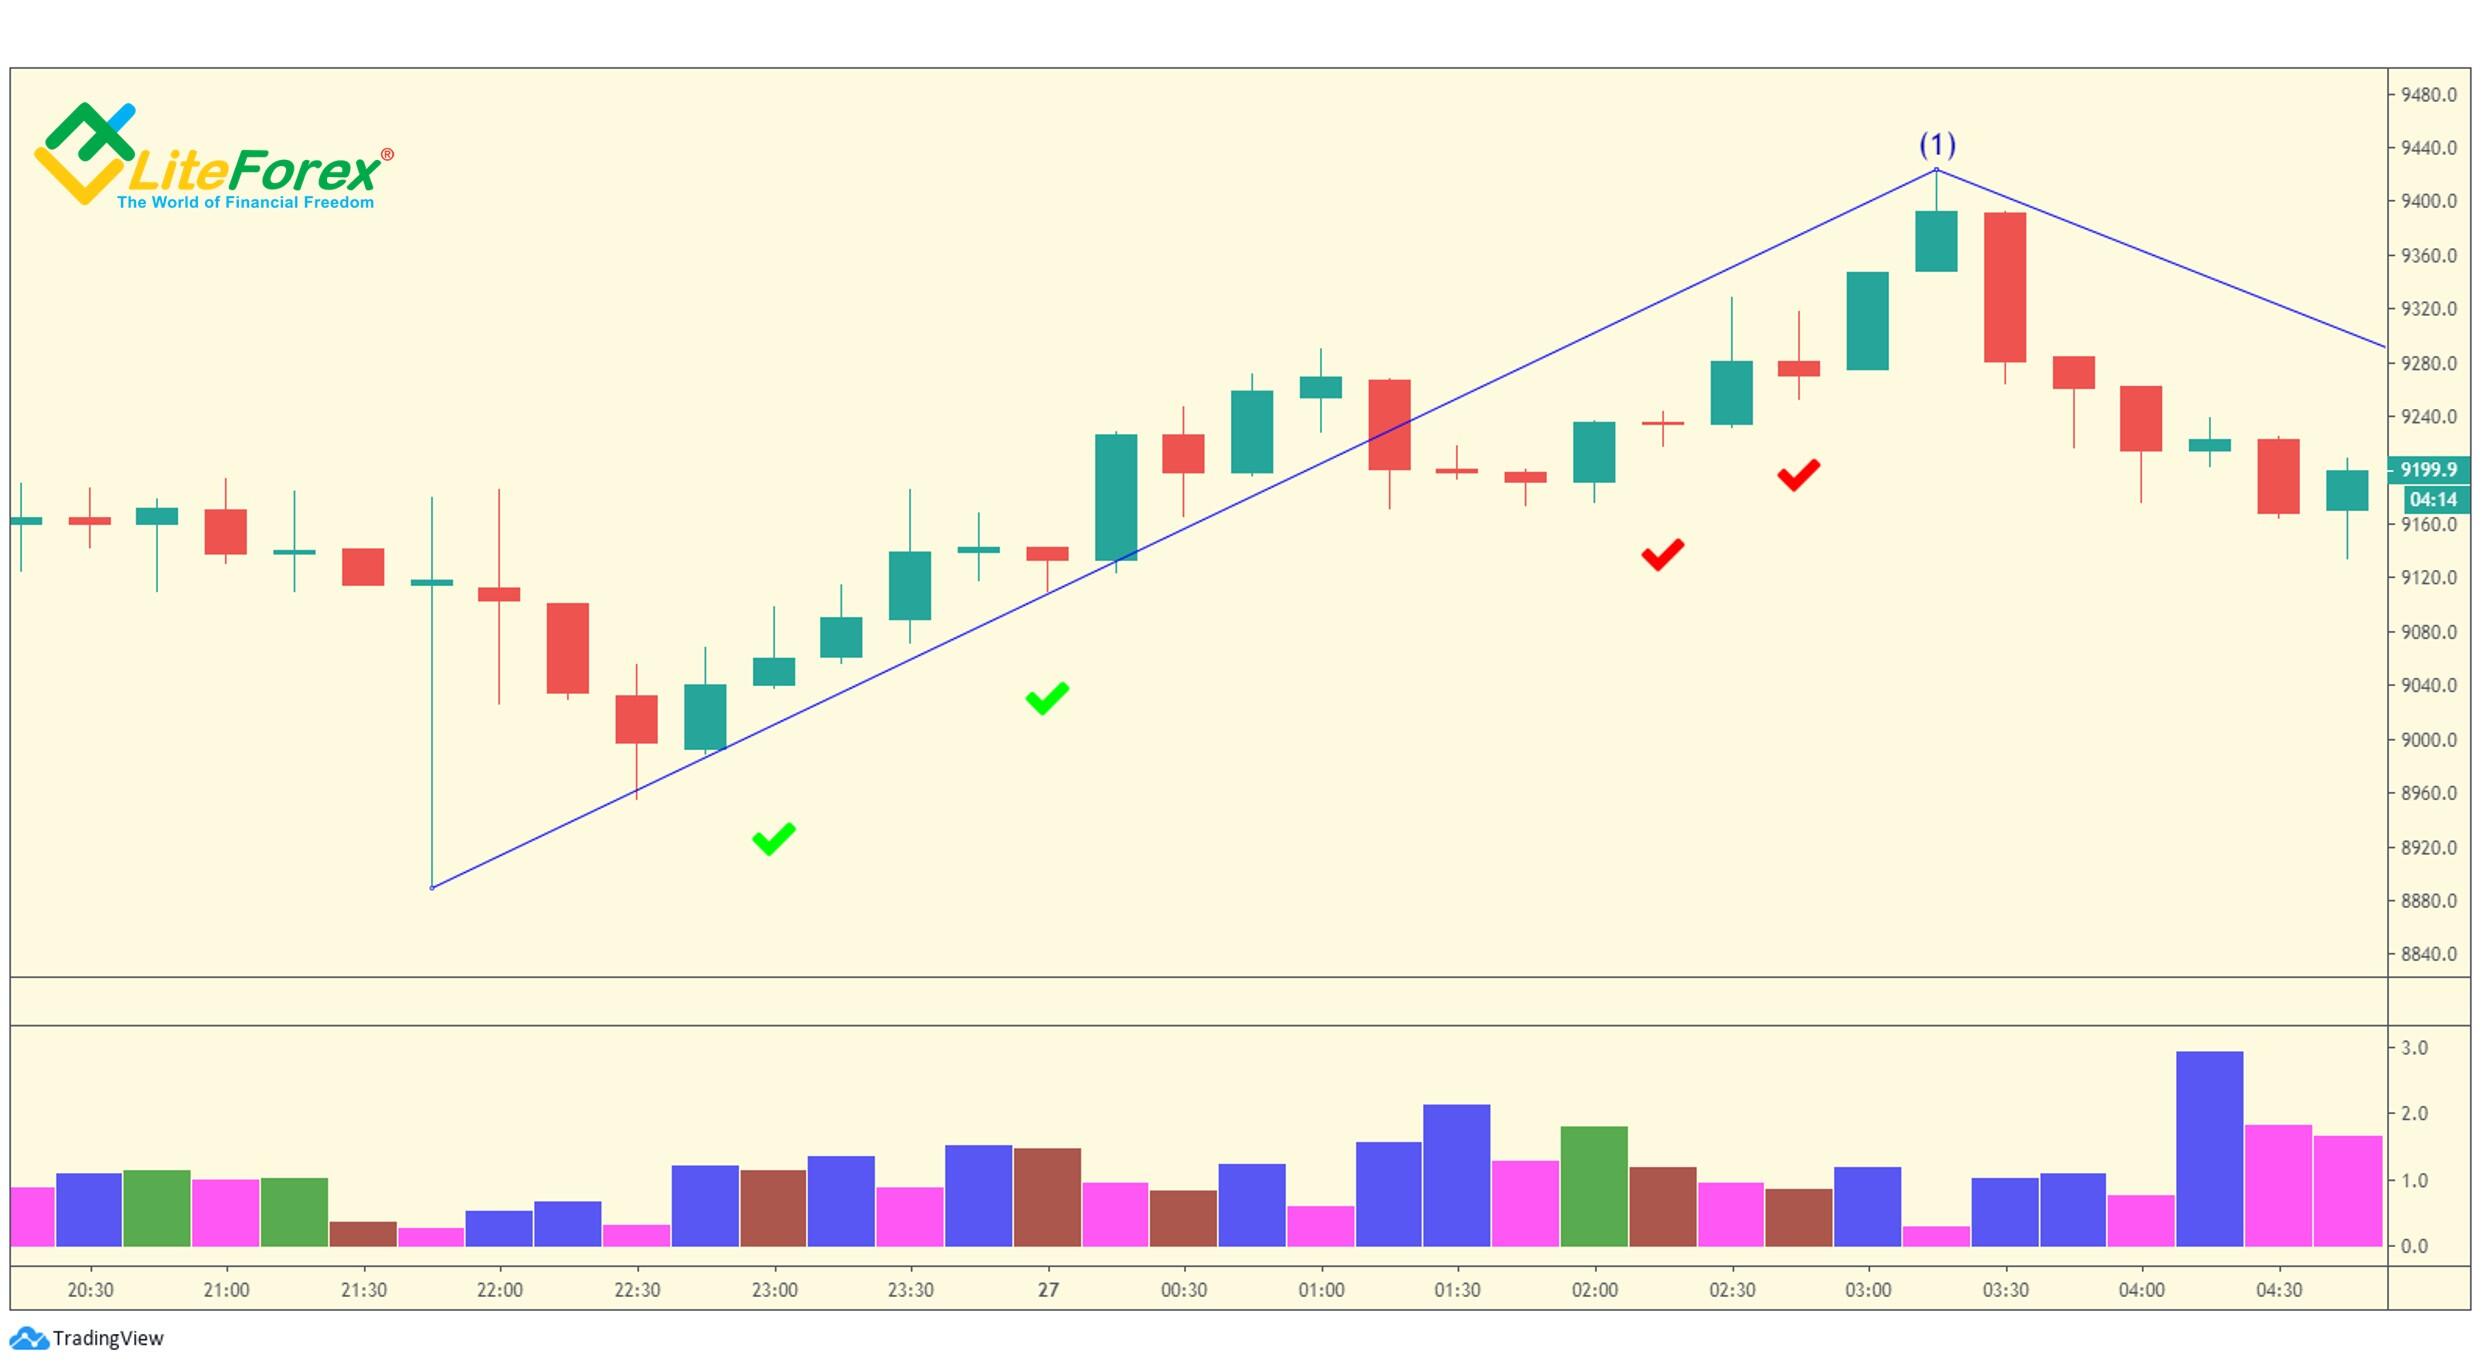
Brown bars at the beginning of the wave (marked with green checks) indicate the struggle in the market. Some trades want a higher price for bitcoin, while others haven’t yet believed in a new trend, thinking it to be just a correction. In the second half of the wave, there emerge two withering bars. They signal that some traders are reluctant to buy any more, and the price should be soon corrected.
False bar
This bar appears when the MFI rises but the weak movement is not supported by trade volumes.
In some cases, a false bar indicates a pause before a correction, in other cases, it signals a “trade hole” manipulation, when position traders try to trigger the stop losses of other market participants before the real trend starts.
A false indicator appears quite often. Therefore, I wouldn’t pay too much attention to the clusters of false bars that move counter to the major trend. If you look closer, you will see that the down move is not natural. There is a cluster of blue bars with rising volume in the MFI chart. It means that professional traders tried to trigger the stop losses of other traders through short corrections.
Squat (squatting) bar
This is one of the most promising signals. Almost every trend finishes with a squat bar that often hits a new local extreme or closes around it. It signals a struggle between the bulls and the bears, which results in high volume with a slight movement of the price itself.
In our trading system, a squat bar will be one of the signals that the current wave is finishing and a new counter movement should be shortly generated. Besides, a squat bar may also appear in the middle of a trend, especially if there is developing Elliott wave 3. In this case, this is the so-called measuring squat bar. If the trend doesn’t reverse after the signal has appeared, the next squat bar should appear after the period equal to the distance between the trend beginning and the first squat bar. Therefore, we have a new, narrower price target range.
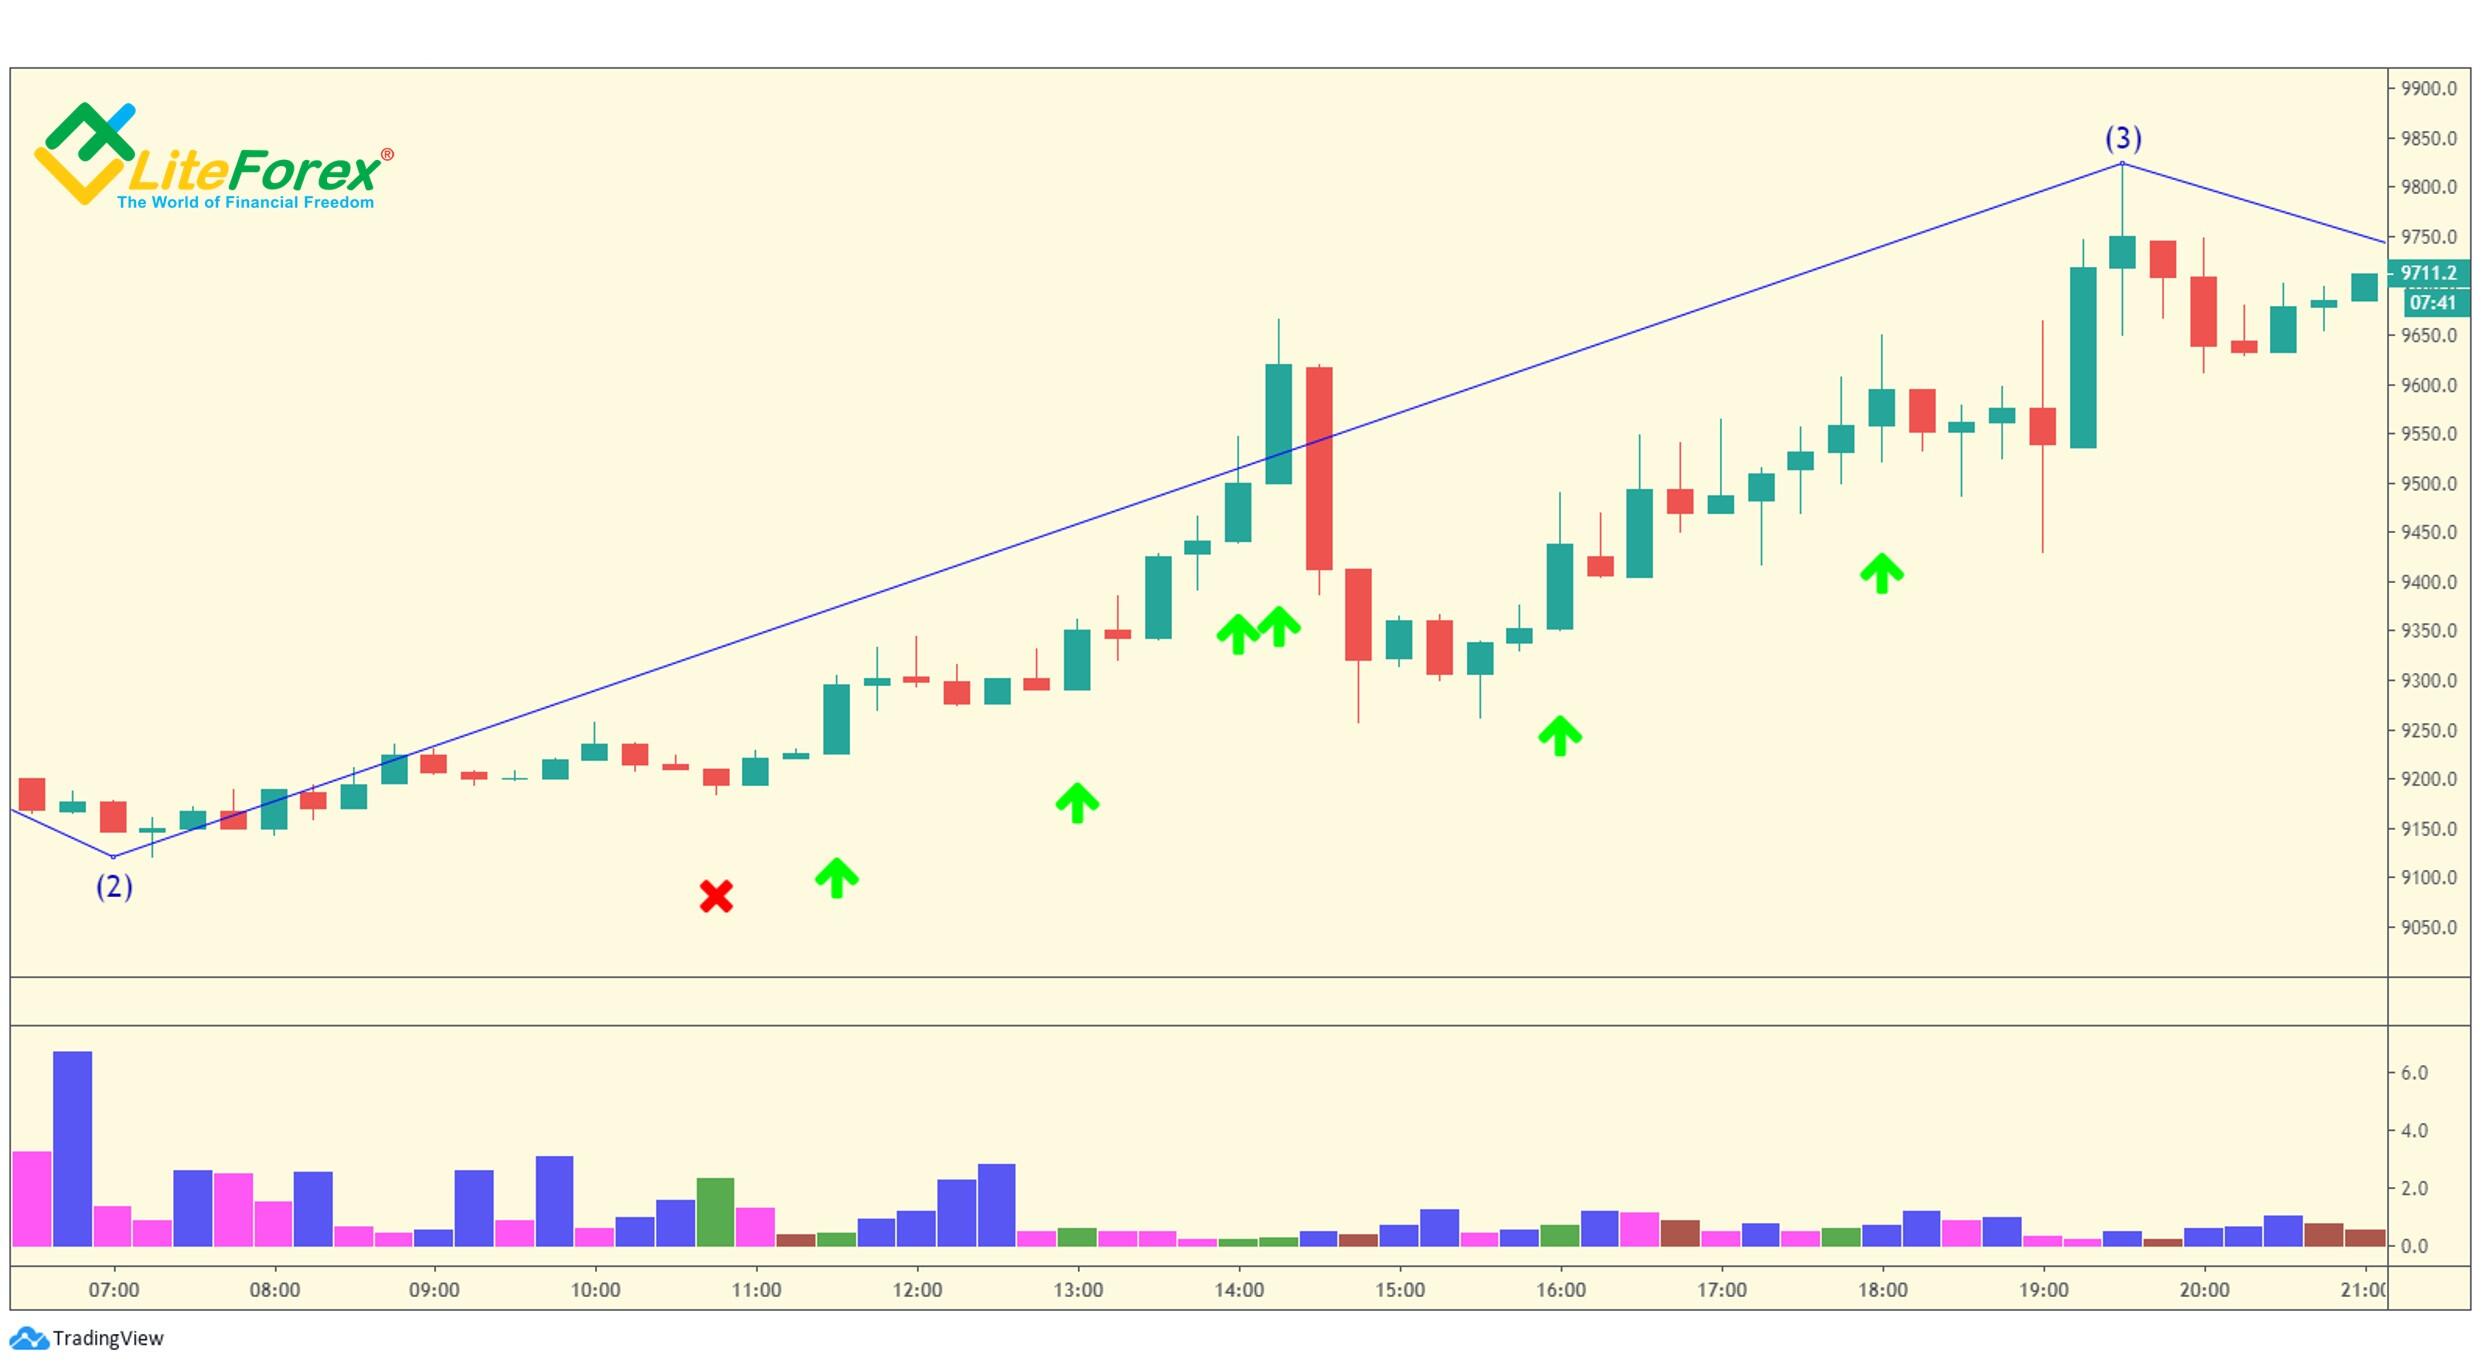
Green checks in the chart mark the peaks of waves accompanied by squad bars; red crosses mark the points where there is no such signal. As you see, the wave’s peak almost always matches a squat bar. Even if the signal hasn’t worked out, just ahead of the extreme price there were two squat bars, and the peak itself was marked by a false bar of the MFI.
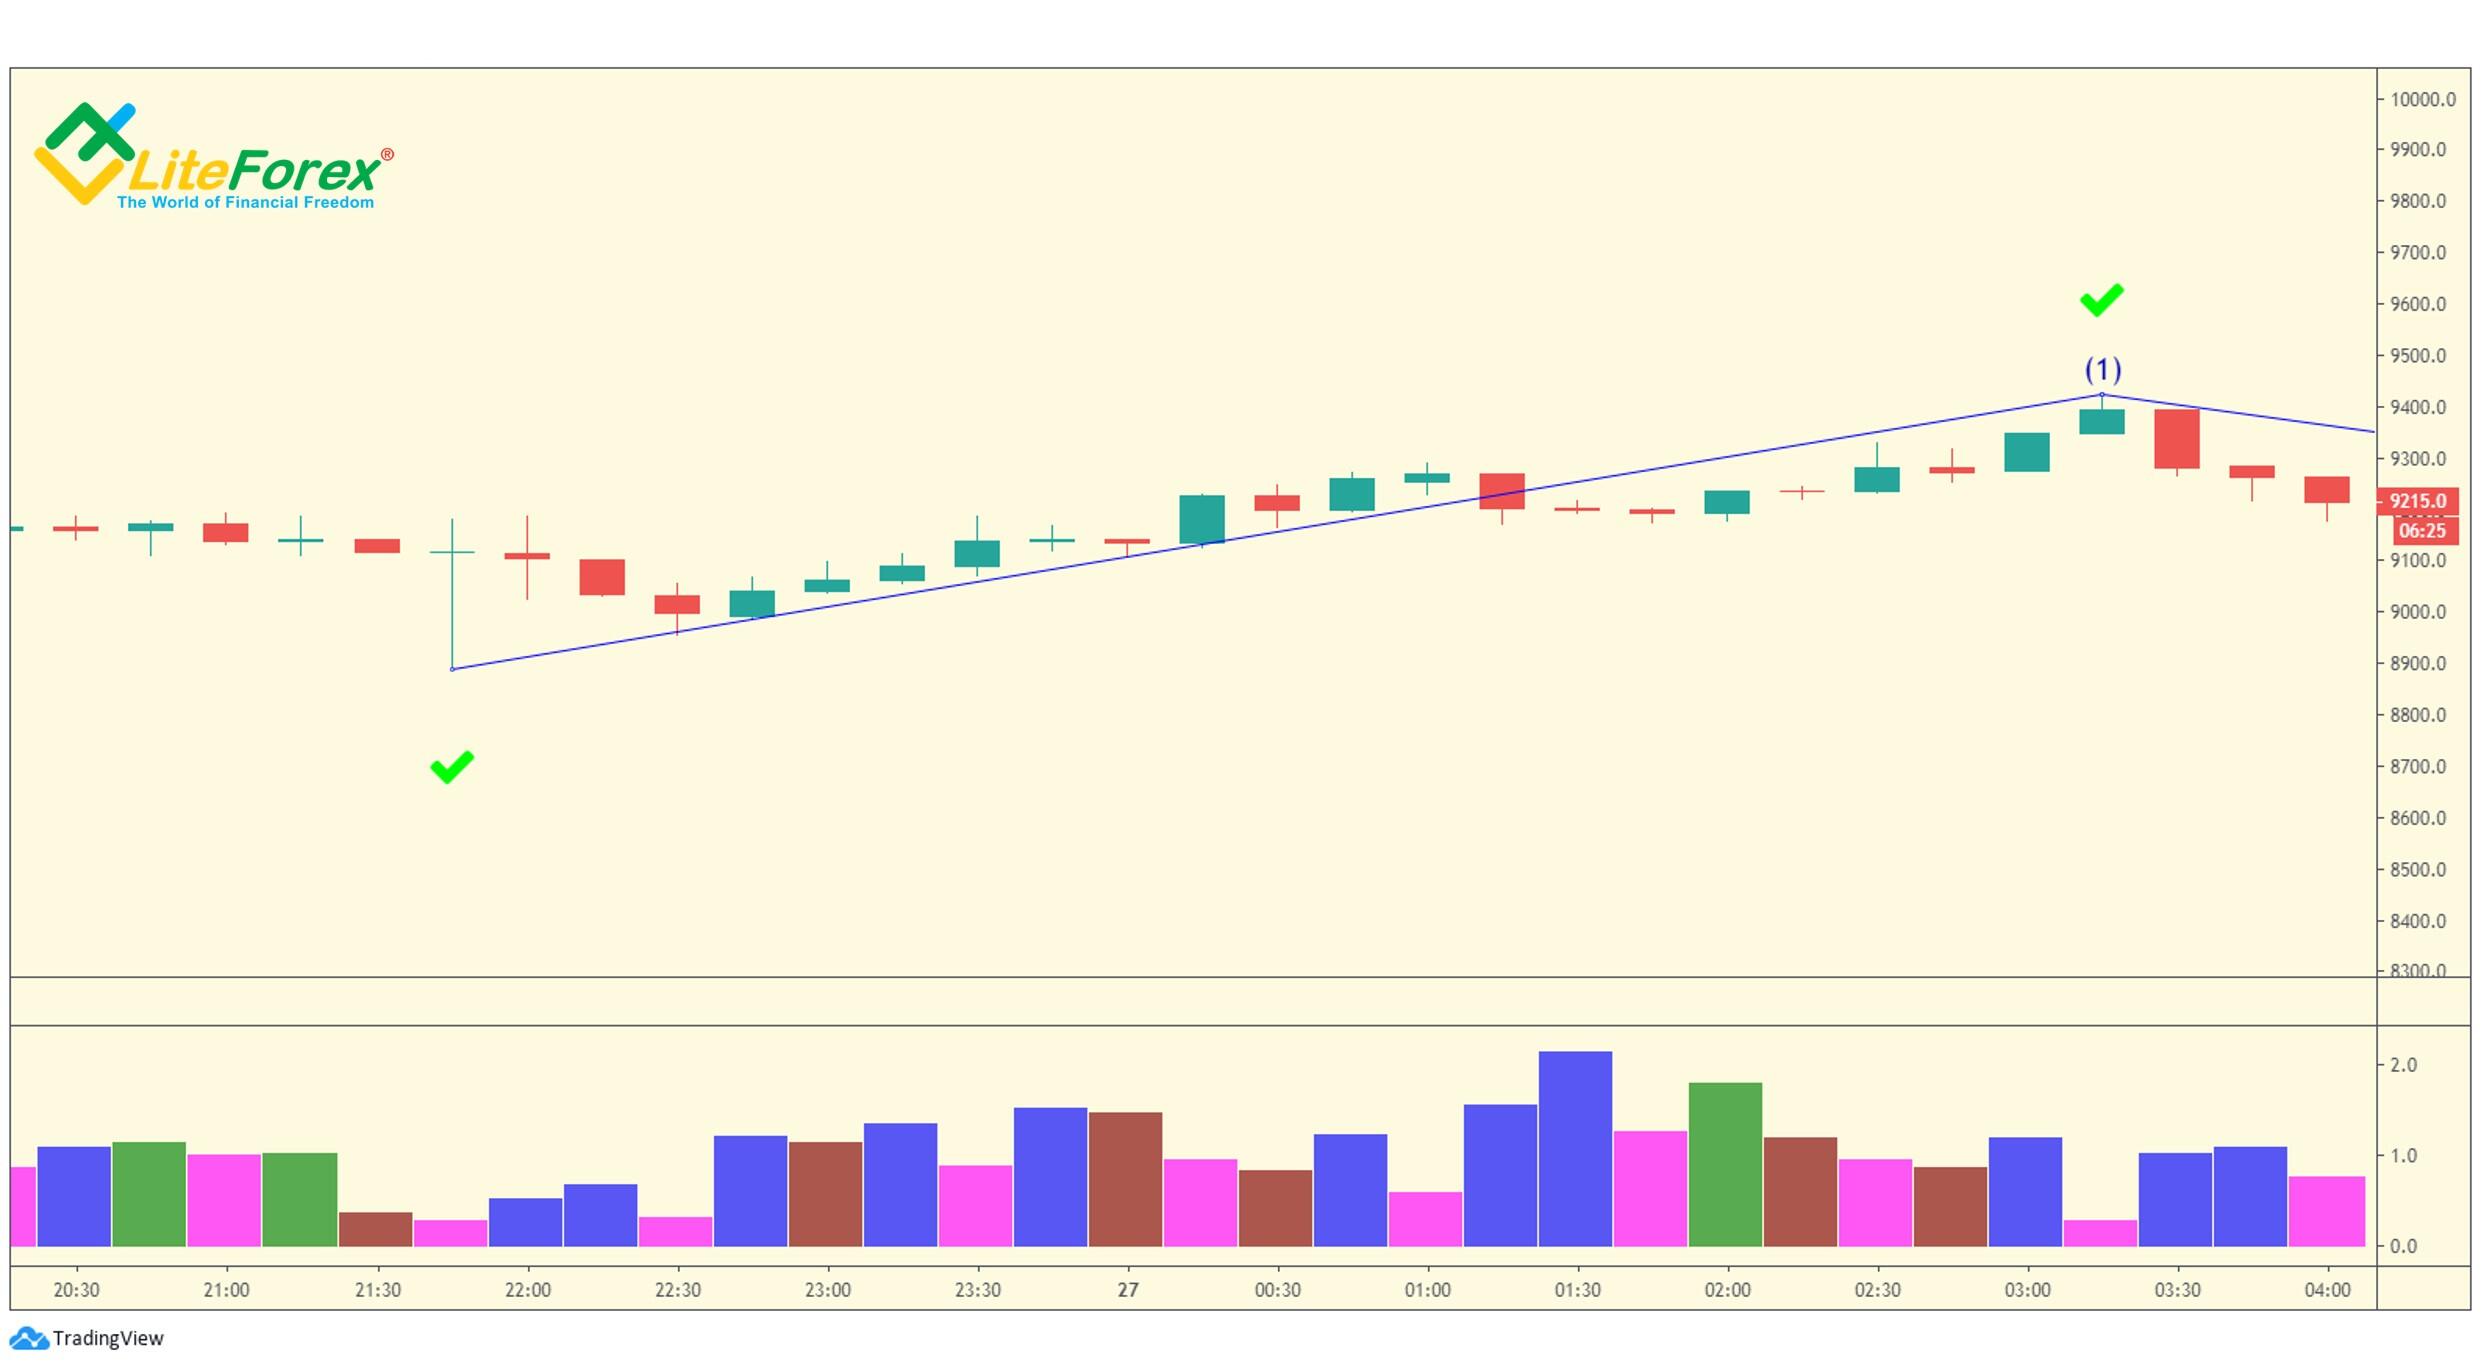
On the example of wave 1, it is clear that the pink measuring squat bars form at the same periods. In practice, such accurate sequences are not very often, but, in general, the past periods are good to be used for predicting the squat bars in the future.
Five bullets
In addition to the correct identification of the waves, and an important task is to anticipate the point of their completion. To identify the end of the trend, Bill Williams uses what he calls five magic bullets. These conditions and signals I briefly dealt with in the previous article
When all the 5 conditions are met, and so, all the 5 magic bullets are present, it will mean that the ongoing wave is finishing and a new one is about to start. The 5 bullets almost always will kill the wave, clearing the way to the new one.
Well, the 5 magic bullets that kill every trend are:
- The bar forming the extreme price is in the target zone.
- There is a divergence between the MFI indicator and the price (as an additional signal, it may enter the overbought/oversold zone).
- There is a fractal at the high (or low if it is a downtrend).
- There is a squat bar in the place of one of the three up or down bars.
- There is a momentum change on the MACD indicator, the up momentum reverses down in the bullish market, and a down momentum reverses up in the bearish market.
Let us see each of the conditions in more detail.
Target zone
When describing the structure of waves and corrections, I wrote about target zones. For impulse waves, they are as follows:
- Wave 2 – 38%-62% of wave 1 length
- Wave 3 – 100%-162% of wave 1 length
- Wave 4 – 38%-50% of wave 3 length, in rare instances, it is less than 38%.
- Wave 5 – calculate the difference between the starting point of wave 1 and the peak of wave 3, next, add 62% and 100% of the calculated value to the ending point of wave 4. The identified price range is the target zone.
For corrections:
- Simple: Wave B is 62% of the length of wave A, rarely, it is 75%. Wave C is 100%-162% of the A wave’s length.
- Flat: waves B and C are roughly equal to wave A.
- Irregular: wave B is 115%-125% of wave A, wave C is 162%-262% of wave A.
- Triangle: then next waves are longer than wave A
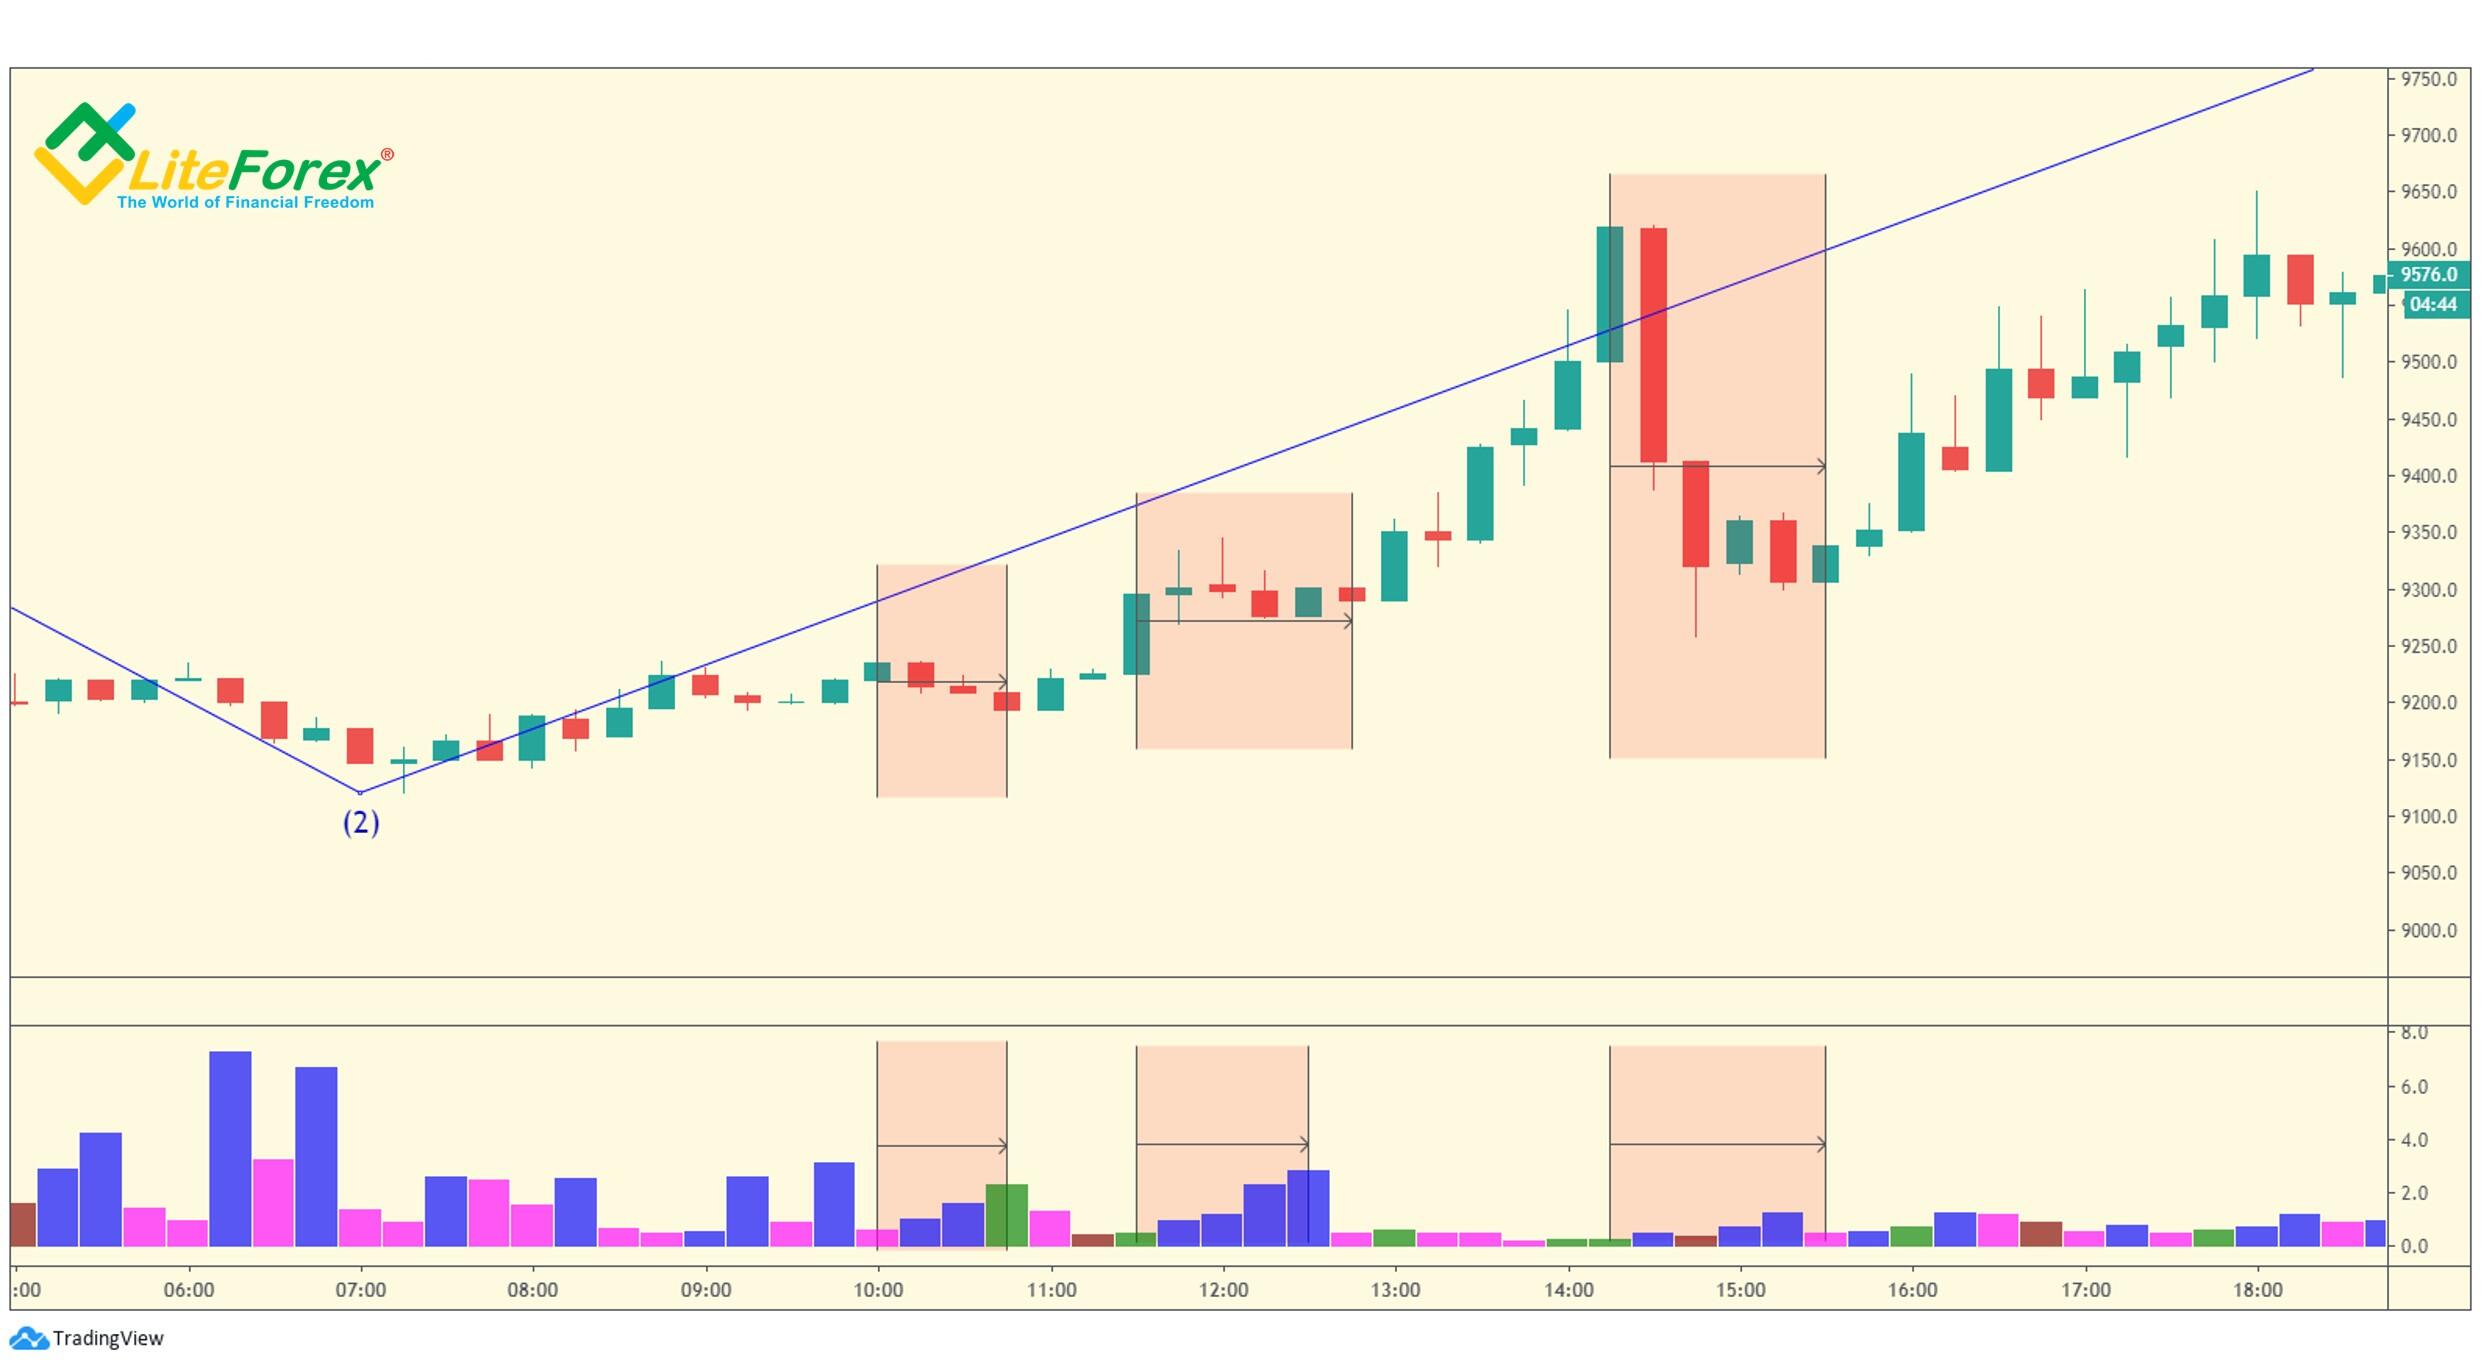
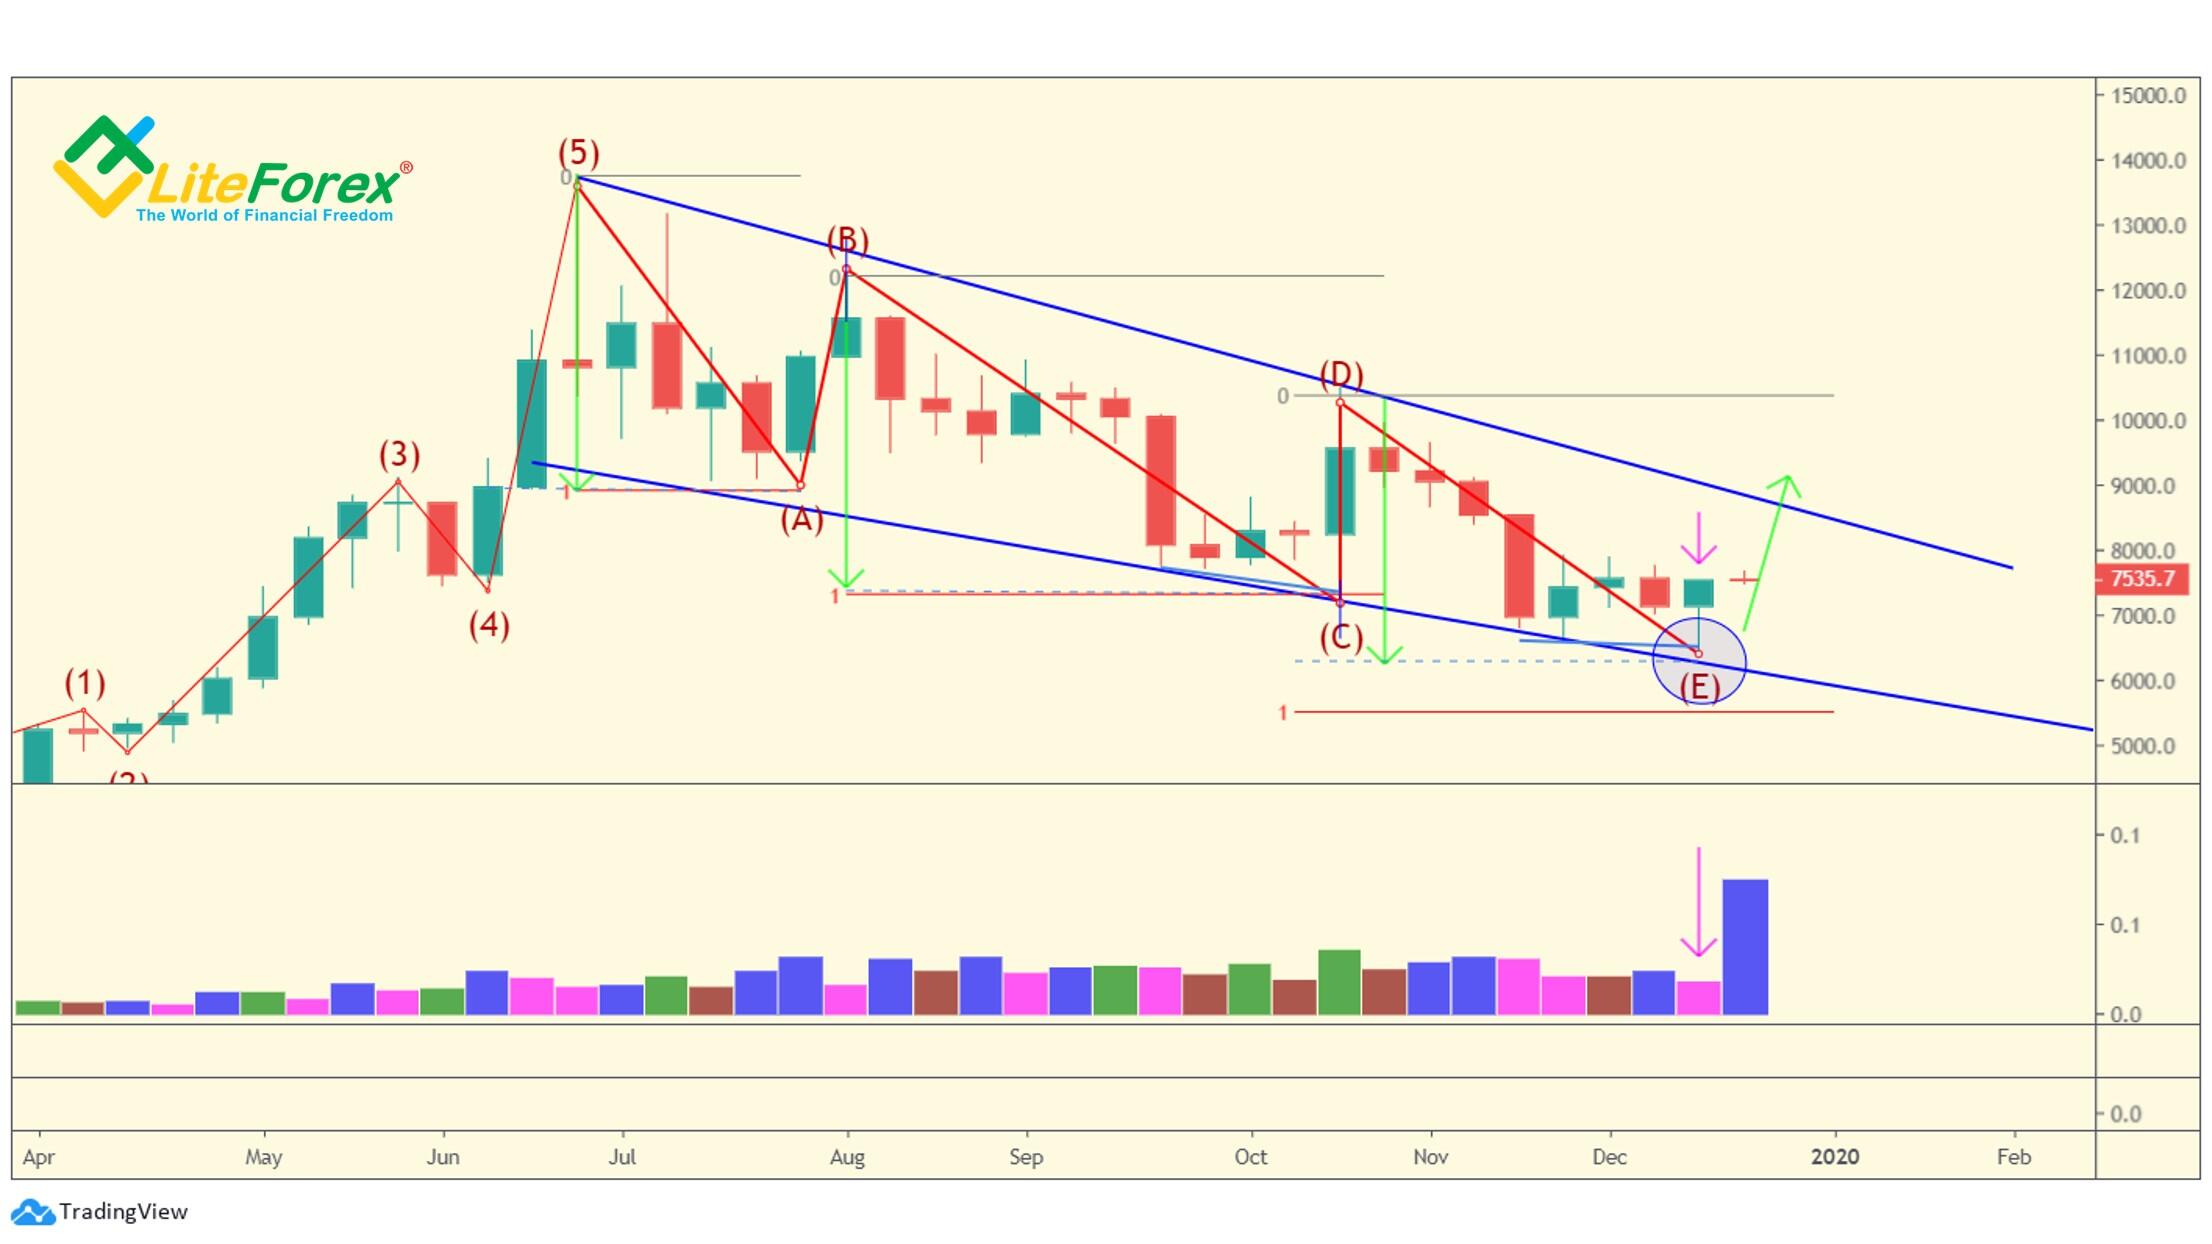
Let me explain how to identify the target zone on the example of the BTCUSD market:
There is something like a triangle correction on the above chart, whose most important condition is that the next wave should be less than the prior one.
In general, this condition is met, and there should soon form wave E.
The MFI indicator by Bill Williams
I described this indicator in detail in the previous article devoted to the Elliot Wave Theory. Remember, two signals are indicating the end of the waves:
- Divergence (convergence) of the indicator and the price. It may appear long before the trend reversal
- The indicator enters the overbought/oversold zone around the extreme price.
Bill Williams also uses the MFI signals to correctly identify the Elliot Waves. The average value of the indicators is the greatest for wave 3. Therefore, there is forming divergence from the end of wave 3 and the end of wave 5.
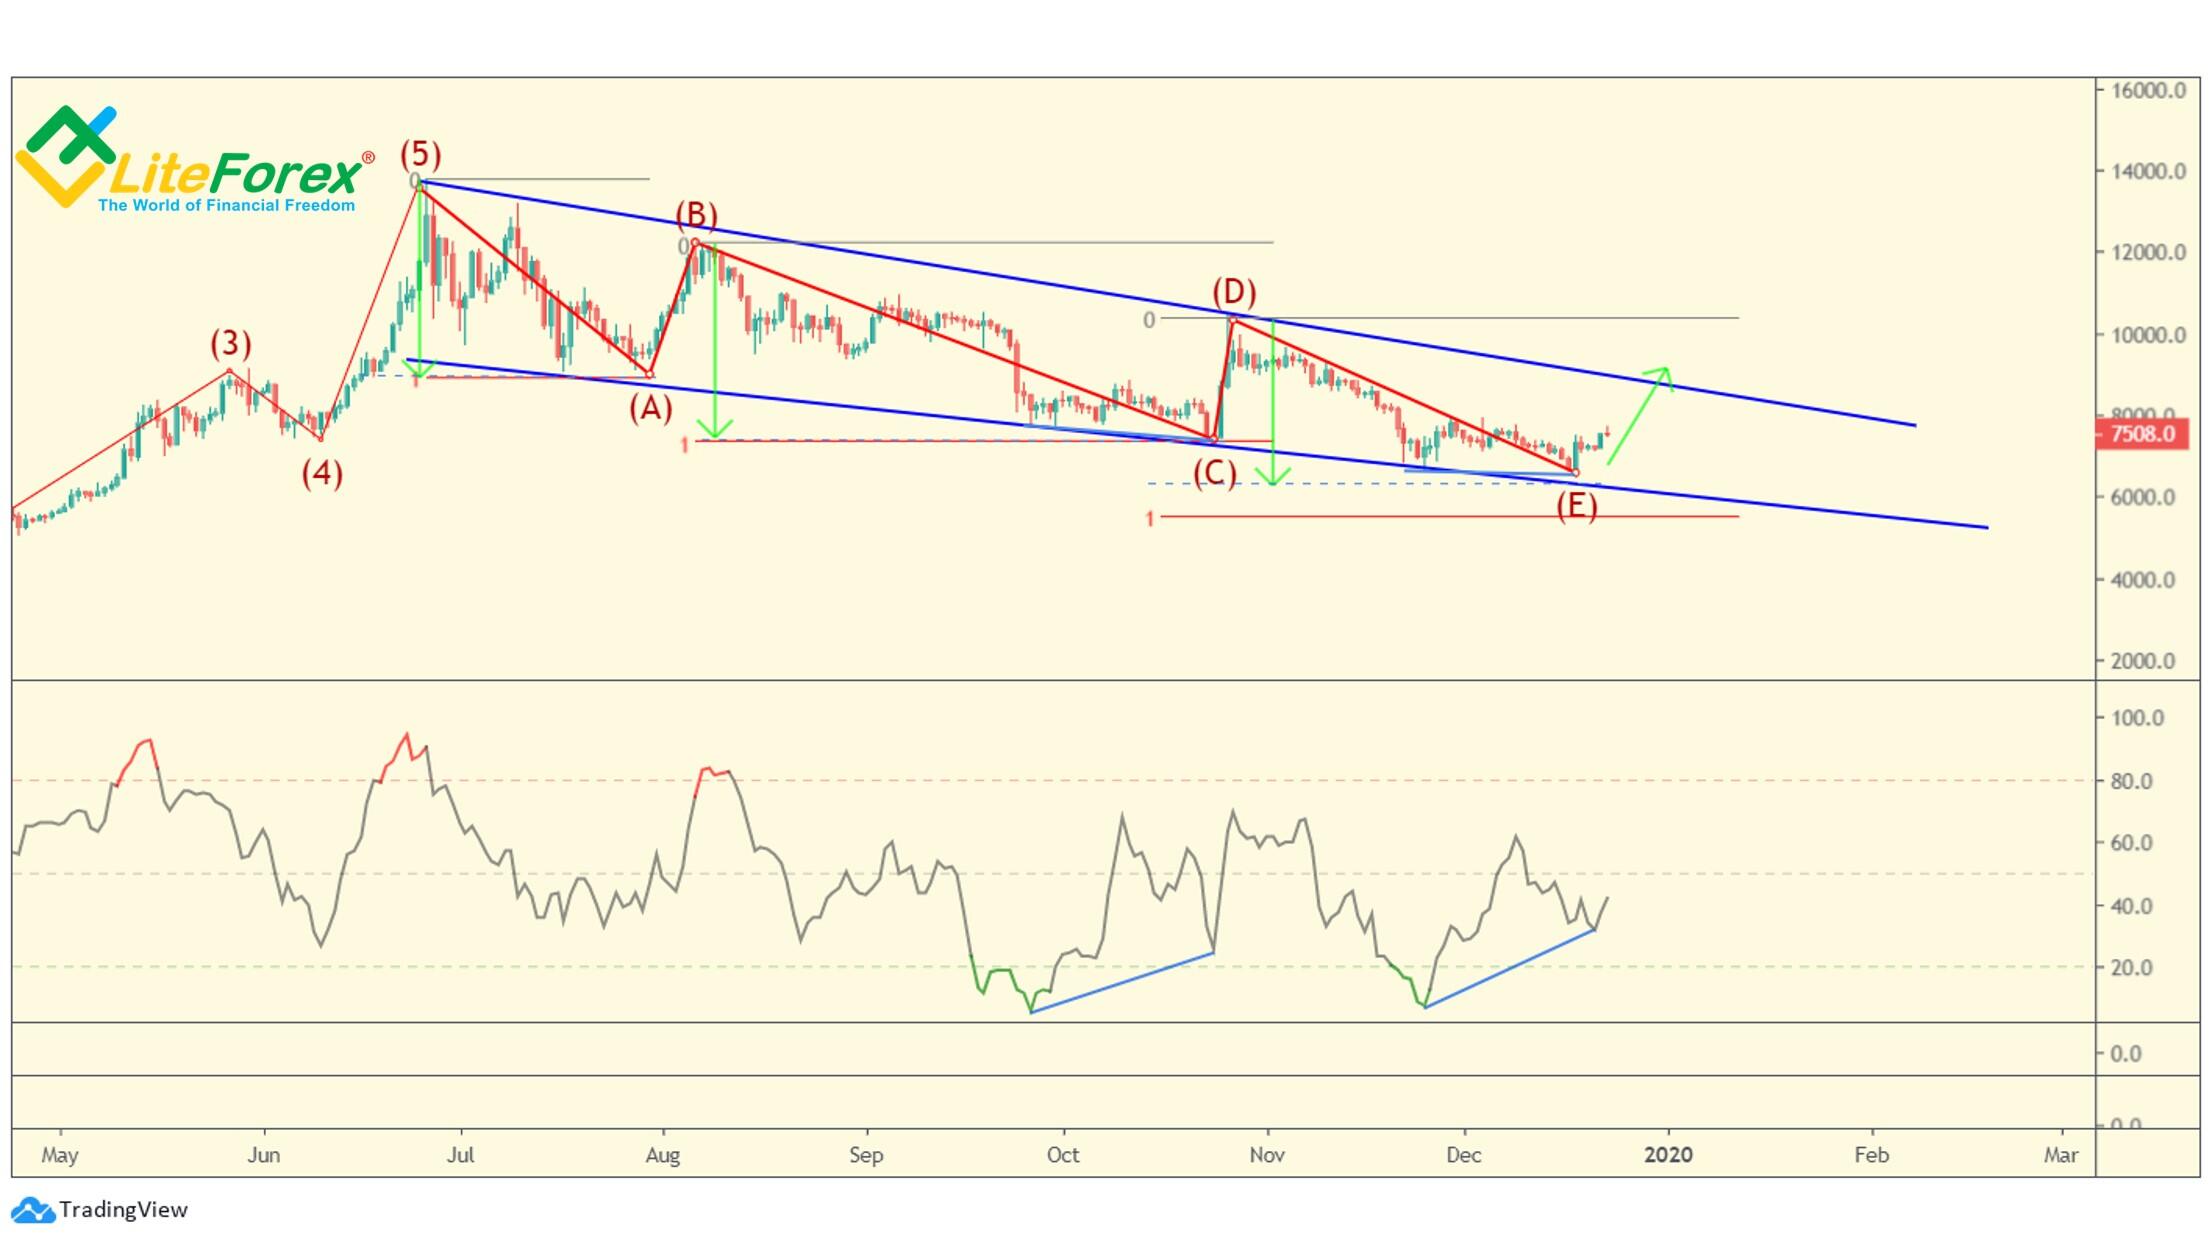
In our example of the current market situation, there is the MFI convergence that confirms the waves change.
A similar situation was when the C wave was changed by the D wave. There was also convergence, the indicator didn’t break through the low, unlike the price chart that did. So, the trends in the price chart and on the indicator are directed at each other.
Besides, the MFI indicator left the overbought zone, which is an early signal of the price reversal and the wave change.
Fractals
Fractals are reversal patterns that often emerge at the waves’ peaks. I recommend using the Williams Fractal (equals fixed) indicator to identify fractals.
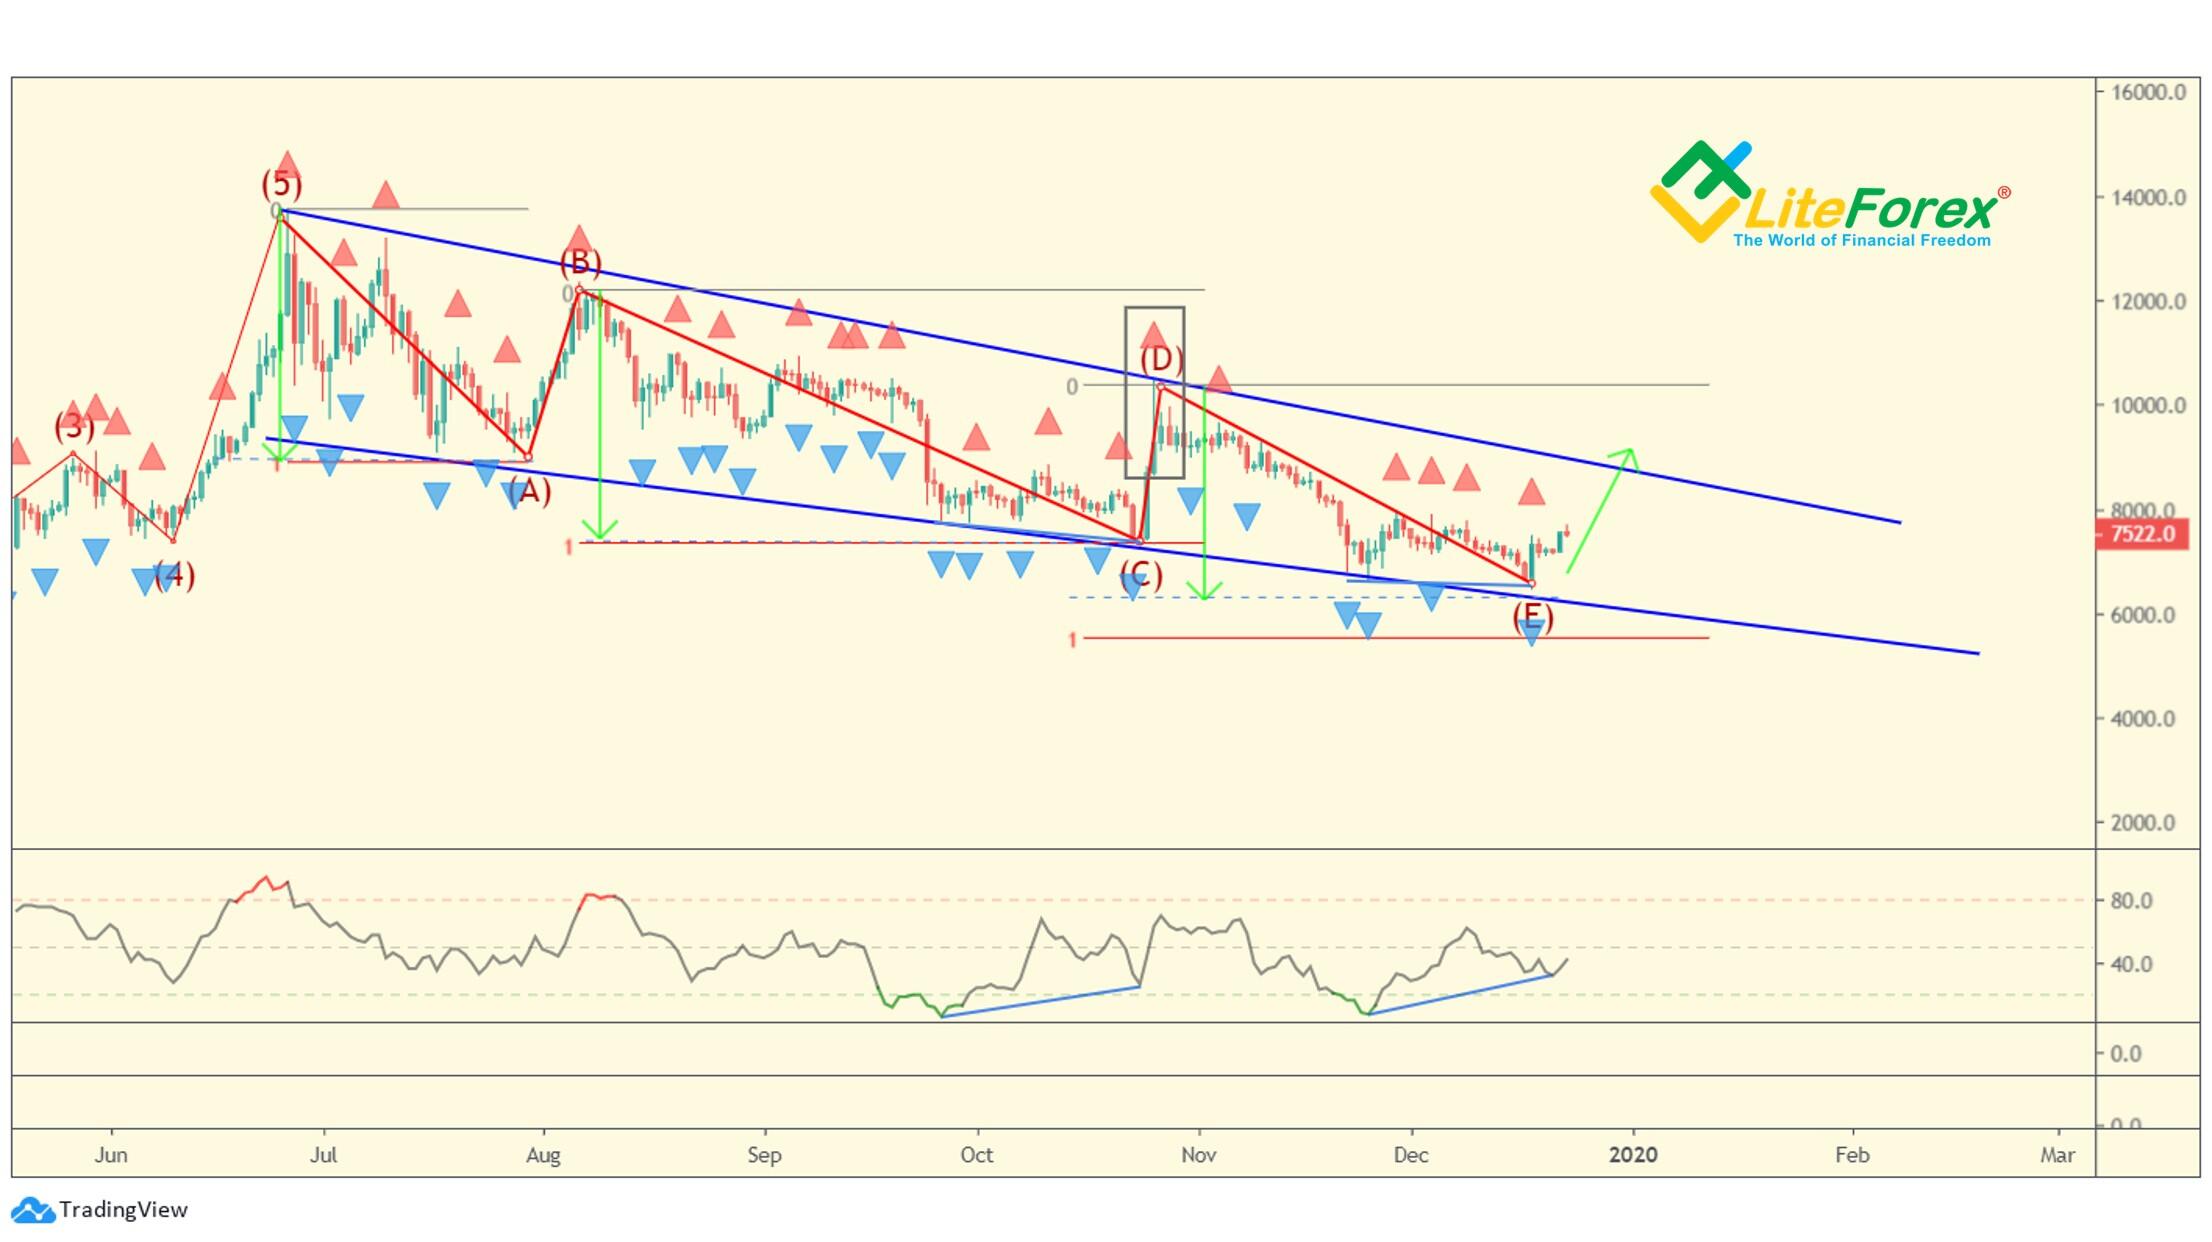
In the above chart, the fractals are highlighted with red and blue triangles. As you see, each wave peak matches to a fractal. A similar signal appears on other sections as well, and this proves that this signal should be considered only together with other bullets.
A squat bar
This is one of the Profitunity signals allowing to identify the reversal points. I described this instrument in detail above. On the Market Facilitation Index, the MFI indicator by Bill Williams, which combines the MFI signals with the volume, the squat bars are pink.
For a more objective analysis of the Market Facilitation Index performance, I took a larger timeframe (a weekly chart, instead of the daily one), as the longer is the timeframe, the stronger signal will be delivered by the MFI. It is clear from the above chart (highlighted with a pink arrow) that the last bar is a squat bar, which validates another bullet in the trend-killing set.
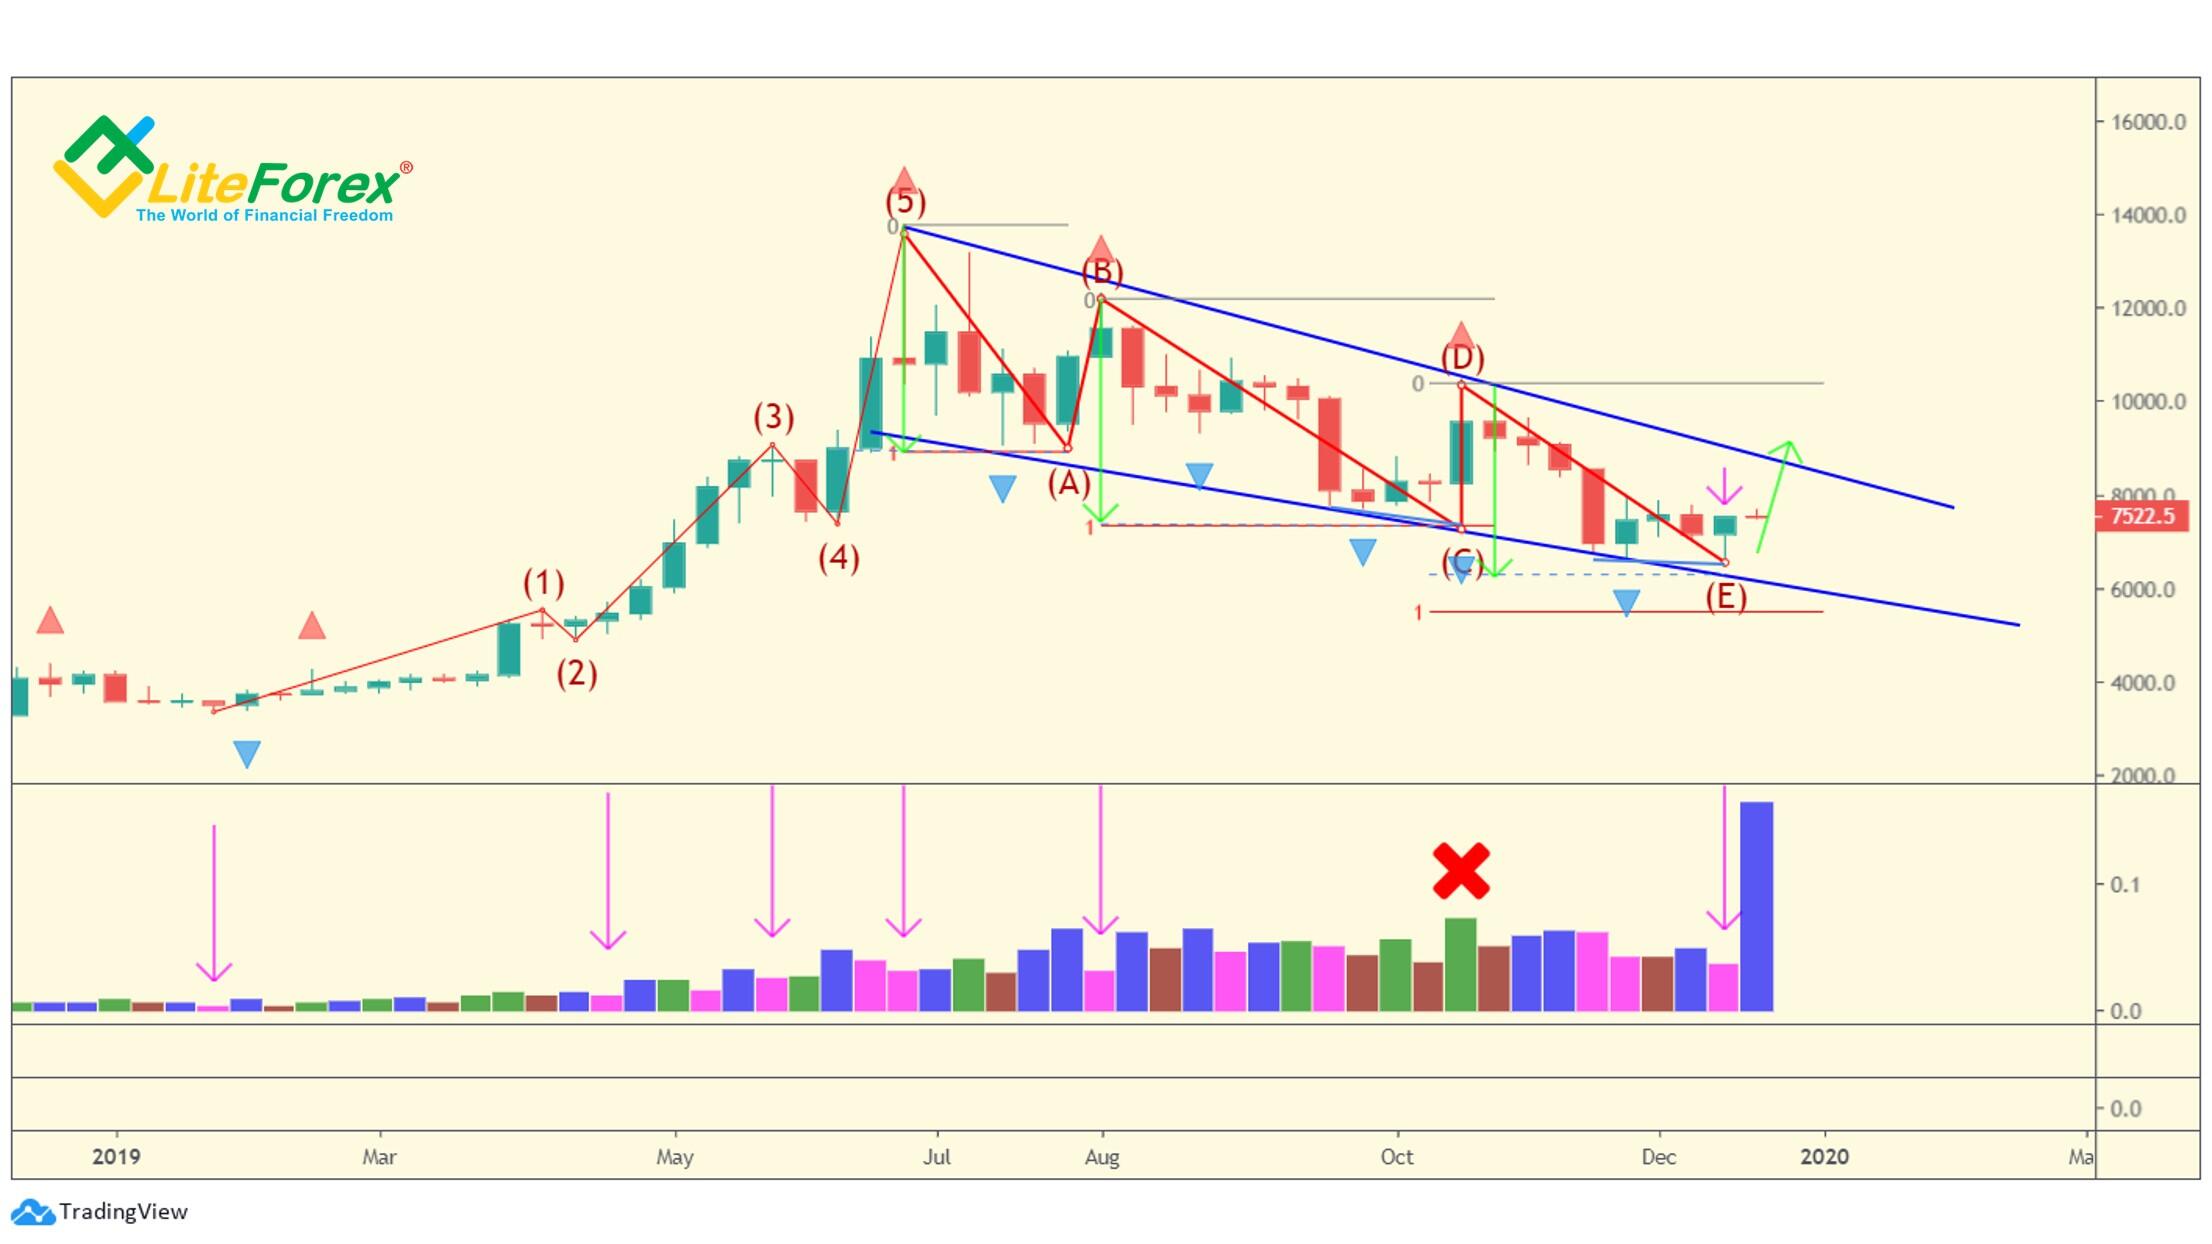
It is clear from the history of signals of this indicator that it is quite accurate. There has been only one error, marked with a red cross when the indicator sent a false green signal.
Profitunity MACD
You can also employ the traditional MACD indicator to analyze the Elliot waves. However, to achieve the best result, I recommend using the Profitunity MACD by Bill Williams with periods of 5/34/5. Bill Williams recommends using it to do the following:
- Identify the peak of waves 3,4, and 5 (based on my own experience, the indicator can also be used to validate the reversal signals on the corrections).
- Identify the motive power (momentum) to choose the right side of the market to trade in.
I should also mention that Bill Williams recommends using the Profitunity MACD to identify the waves of 100-140 bars. If this condition is met, the indicator performs the highest accuracy and timeliness of signals.
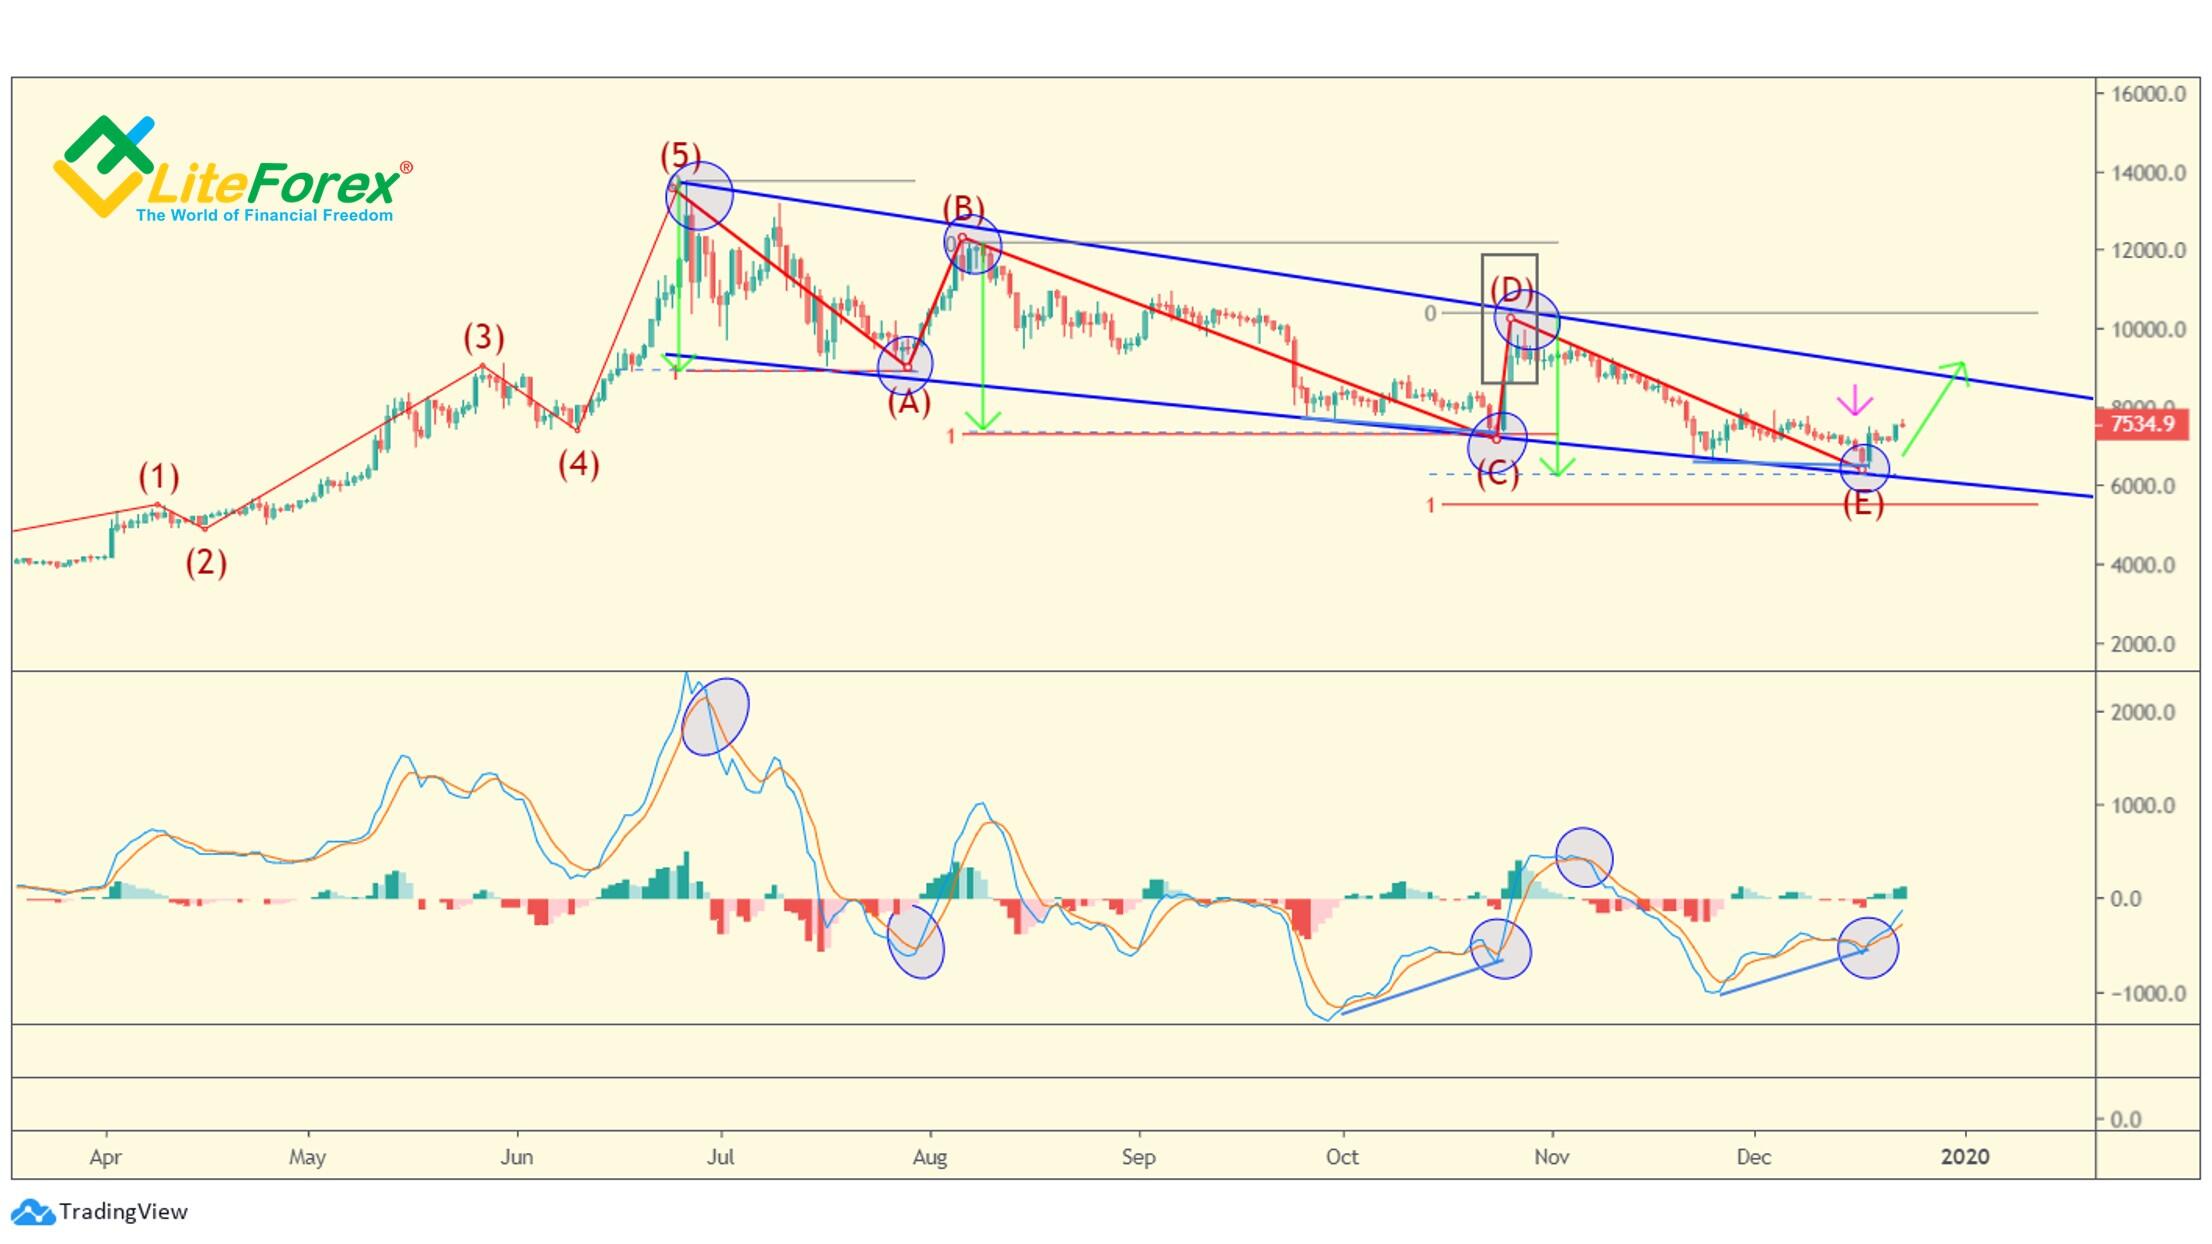
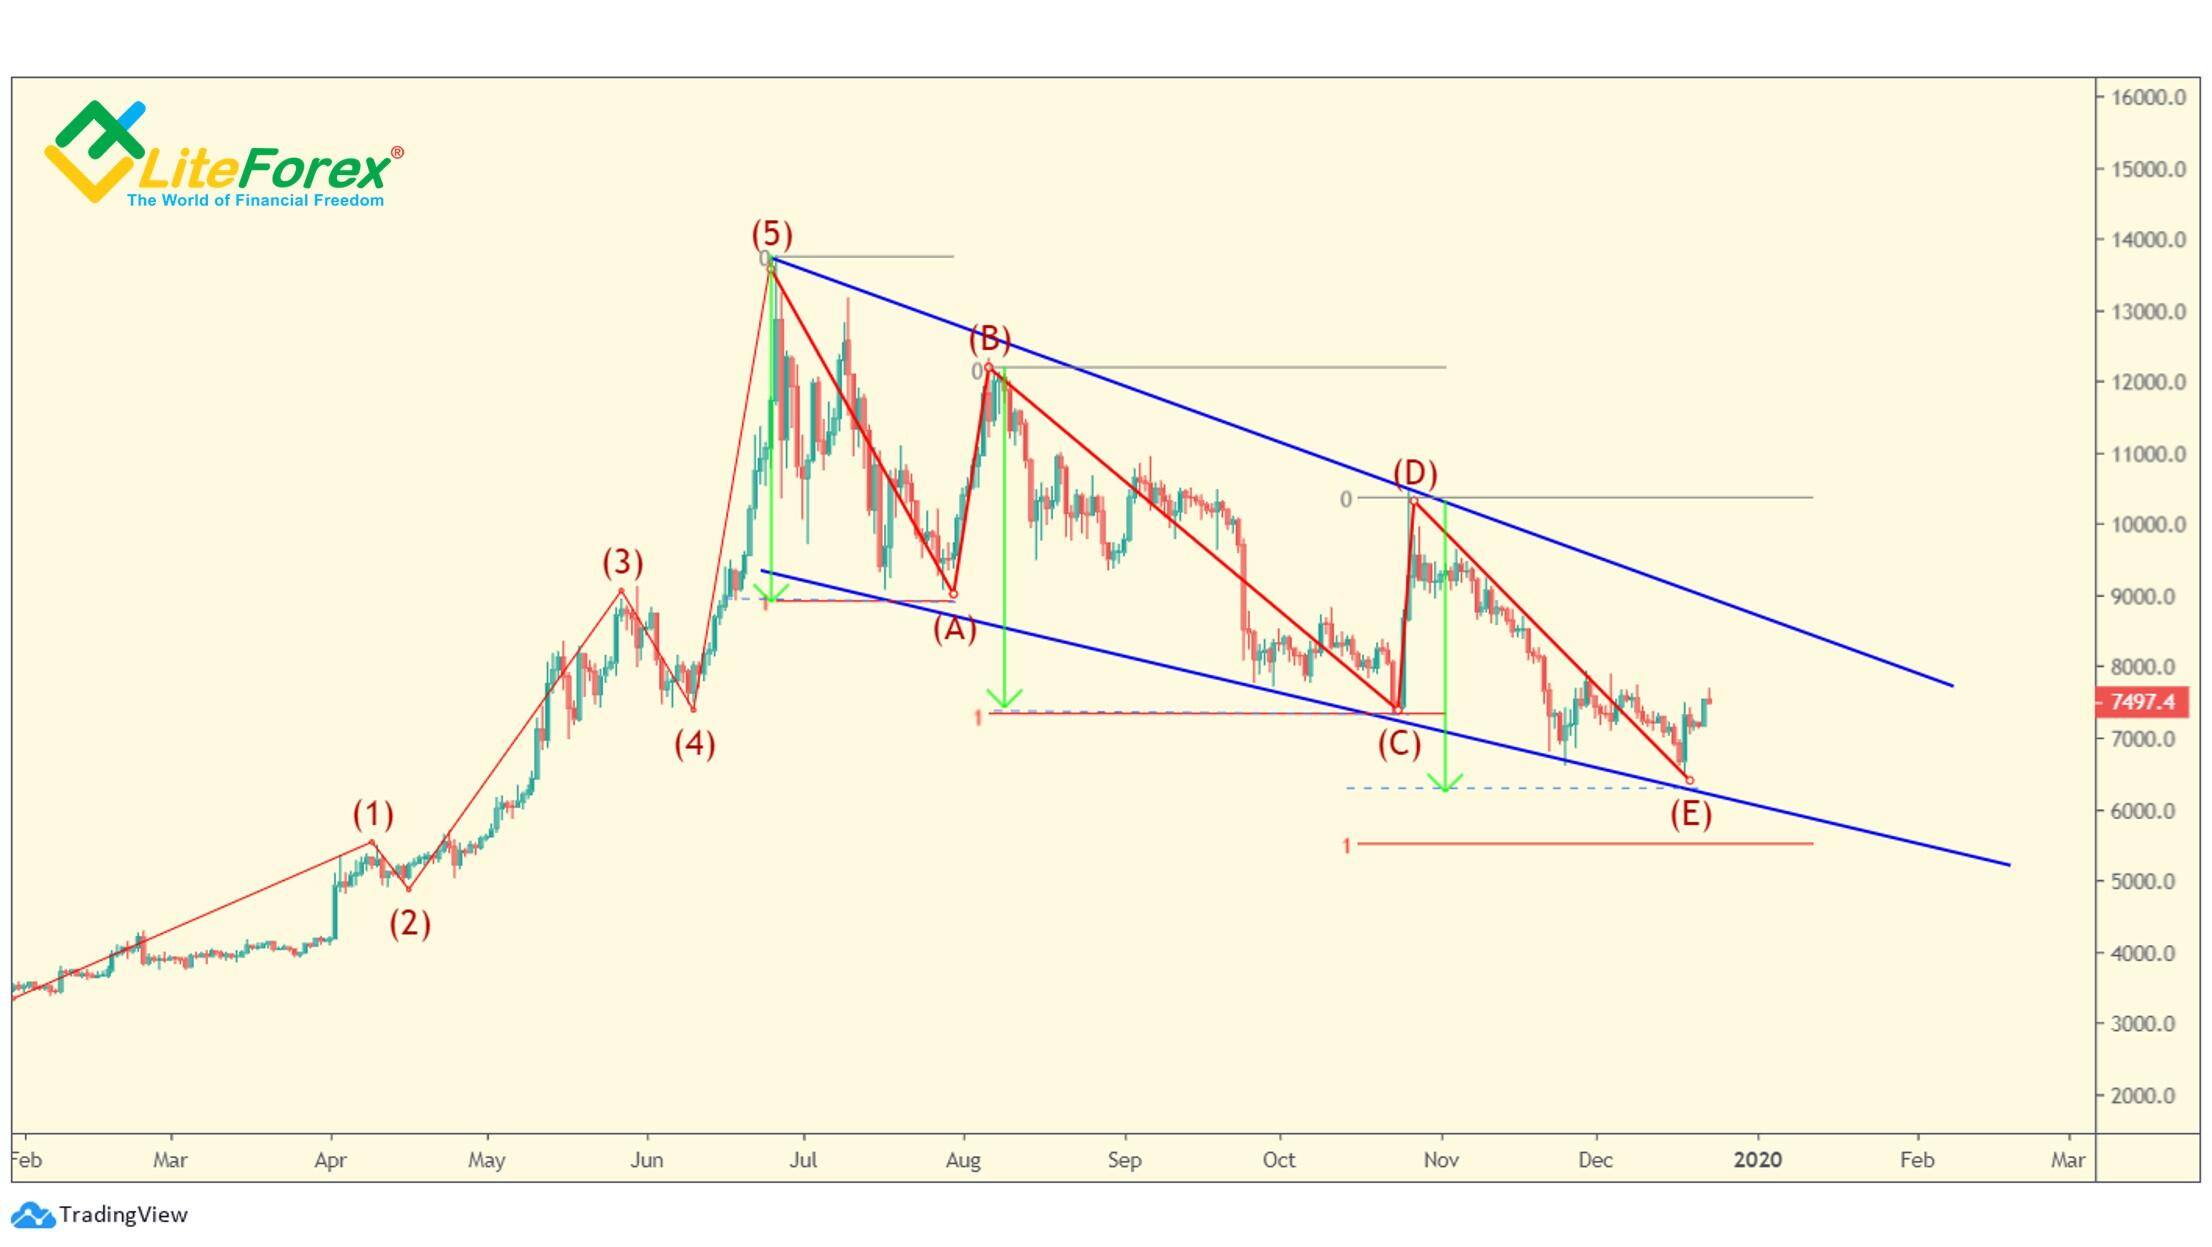
Blue circles in the chart mark the zones of the extreme prices of the final wave, wave 5, and also those of the waves A, B, C, D, E, on the MACD chart, they mark reversal signals. Remember, the MACD reversal signals are the meeting of the indicator’s MAs and the change of the direction, as well as the shift of the histogram from the green zone into the red one (the so-called zero zone) and vice versa. As you see, the MACD signals are a little lagging. However, in short timeframes, this lagging is not significant.
The MACD can also send signals of divergence or convergence as in our example, similarly to the MFI signals. They also can be used as additional signals to confirm the primary ones.
Finally, there all the 5 bullets present, and so we can expect a new bullish cycle to start. We only need to wait and to check in fact.
Summary
My description of the Elliot Wave theory based on Bill Williams's books is about to finish. Let us sum up all that we have studied.
When you identify Elliott waves, you should follow a few simple rules:
- The low impulse wave 2 should be higher than the starting point of wave one. If it is equal to the level of the first wave or lower, the trend may not be forming.
- The peak of the third impulse wave in an uptrend should be higher than the high of wave 1, or the lower than its low in a bearish trend.
- Wave 3 can’t be the shortest of the three impulse waves.
- The low of wave 4 must be greater than the peak of the first wave in the bullish trend, and less in the bearish trend. If this condition is not met, look at wave 5, its peak should be greater than the high of the third wave (vice versa in a bearish trend). If this condition is not met, the wave sequence is not identified correctly.
- Corrective waves formed within the major impulse should differ from each other by at least one of these parameters, size, time of developing or complexity. If there are no clear differences, there must be forming a complex corrective model rather than a trend.
- The development time of the three waves next to each other that are forming within an impulse should be different.
- One of the impulse waves should be expanded by nominal size, it should be larger than the other two waves.
- These waves will help you avoid the wrong interpretation of the wave sequences. So, if even one of the rules is violated, you should close the positions opened and revise the forecast.
When you analyze the five bullets, first of, you need to calculate the zero point from which the five-wave sequence begins. Next, during the entire first wave, we watch the trend forming and find out the moment when the first correction starts. To do this, we can switch to a shorter timeframe and watch the five-wave sequence forming within the first wave, simultaneously spotting the five bullets for these waves of lower degree.
The first short position is opened at the start of the second wave. A stop loss is put a little higher than the local high. If you can’t monitor the market constantly, you should choose the target between the retracement of 50% and 62% of the length of wave 1. If you plan to monitor in the short-term, wave 2 should be subdivided into the five-wave formation where the end of the fifth wave will be an exit signal.
You also might not identify the zero point correctly. In this case, the price will go lower than it, and so, you should exit the current trades and expect further signals that the long corrections have ended.
When wave three starts developing, Williams recommends buying a small number of contracts. Stop losses, like in the previous case, are set around the peak of wave 2.
You open an add-on buys when the impulse’s length reaches 100% or more of wave 1. In this case, it is certainly wave 3. The target will be in the range of 150%-163% of the first wave’s length. Besides, if there are no reversal signals as the price is approaching the target, you shouldn’t exit the trades until there are any. In this case, there is forming an expanded wave 3, and so, you need to bear in mind that wave 5 could be short.
You similarly trade the fourth and the fifth waves, dividing them in wave formations of a lower degree and exiting the trades when there are five bullets. To take the maximum profit, you should use the advantages of corrective waves. The end of the fifth wave will be a zero point.
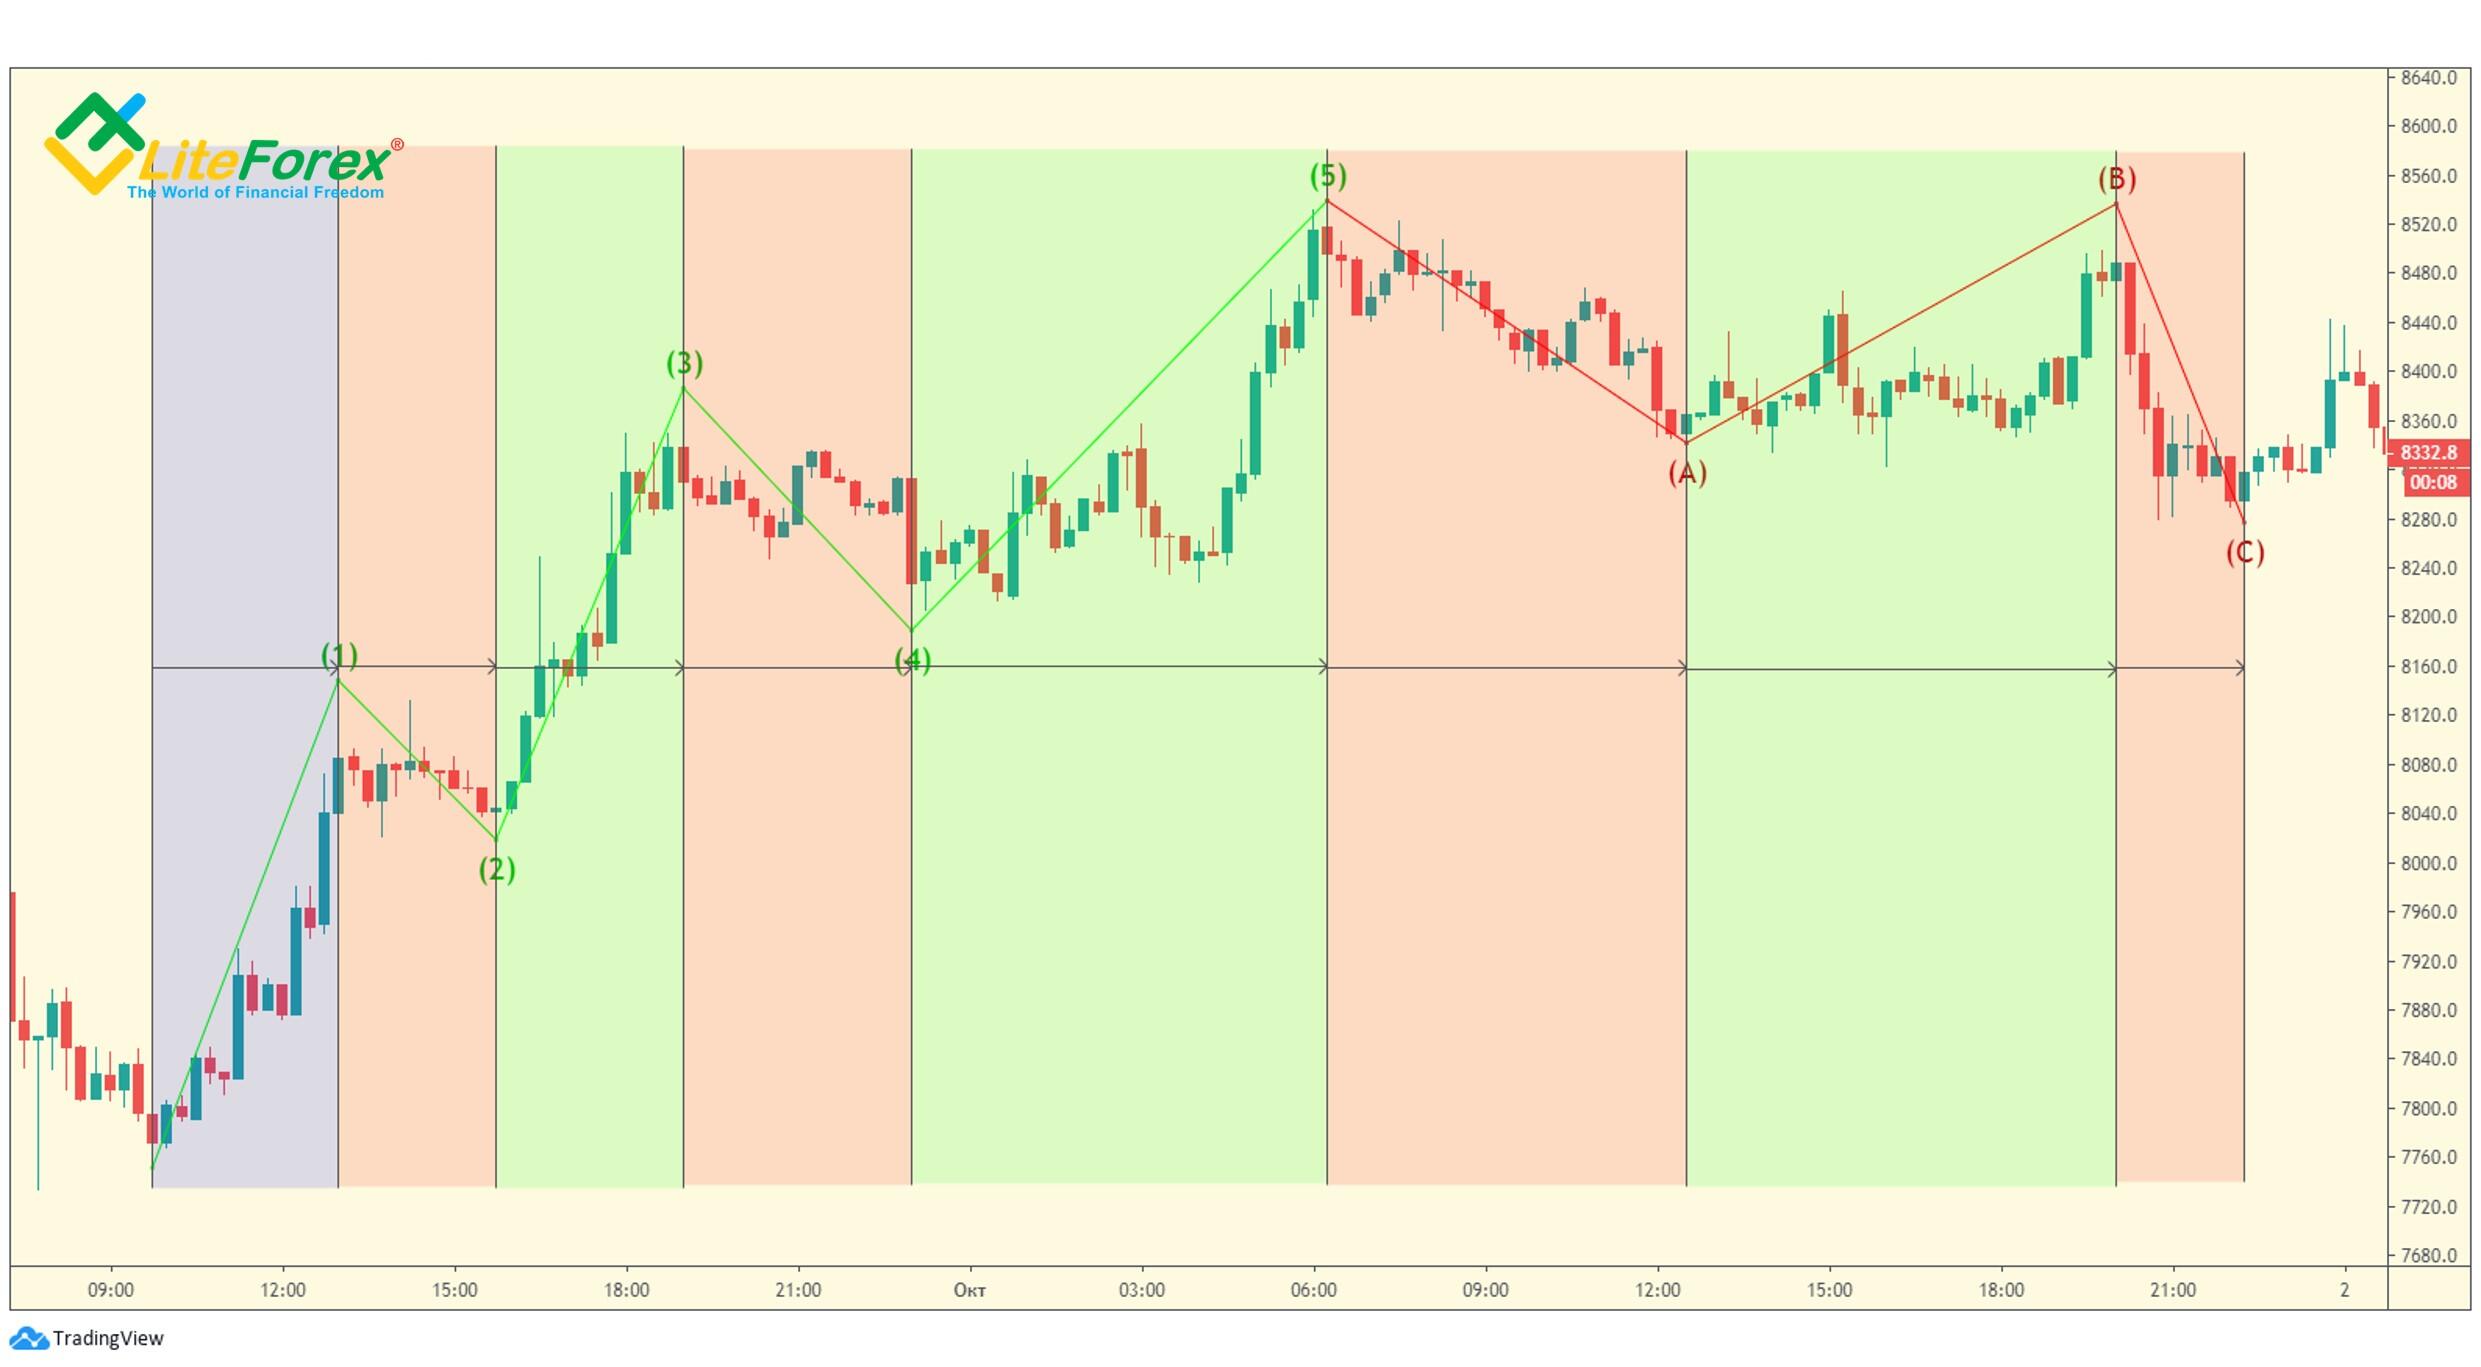
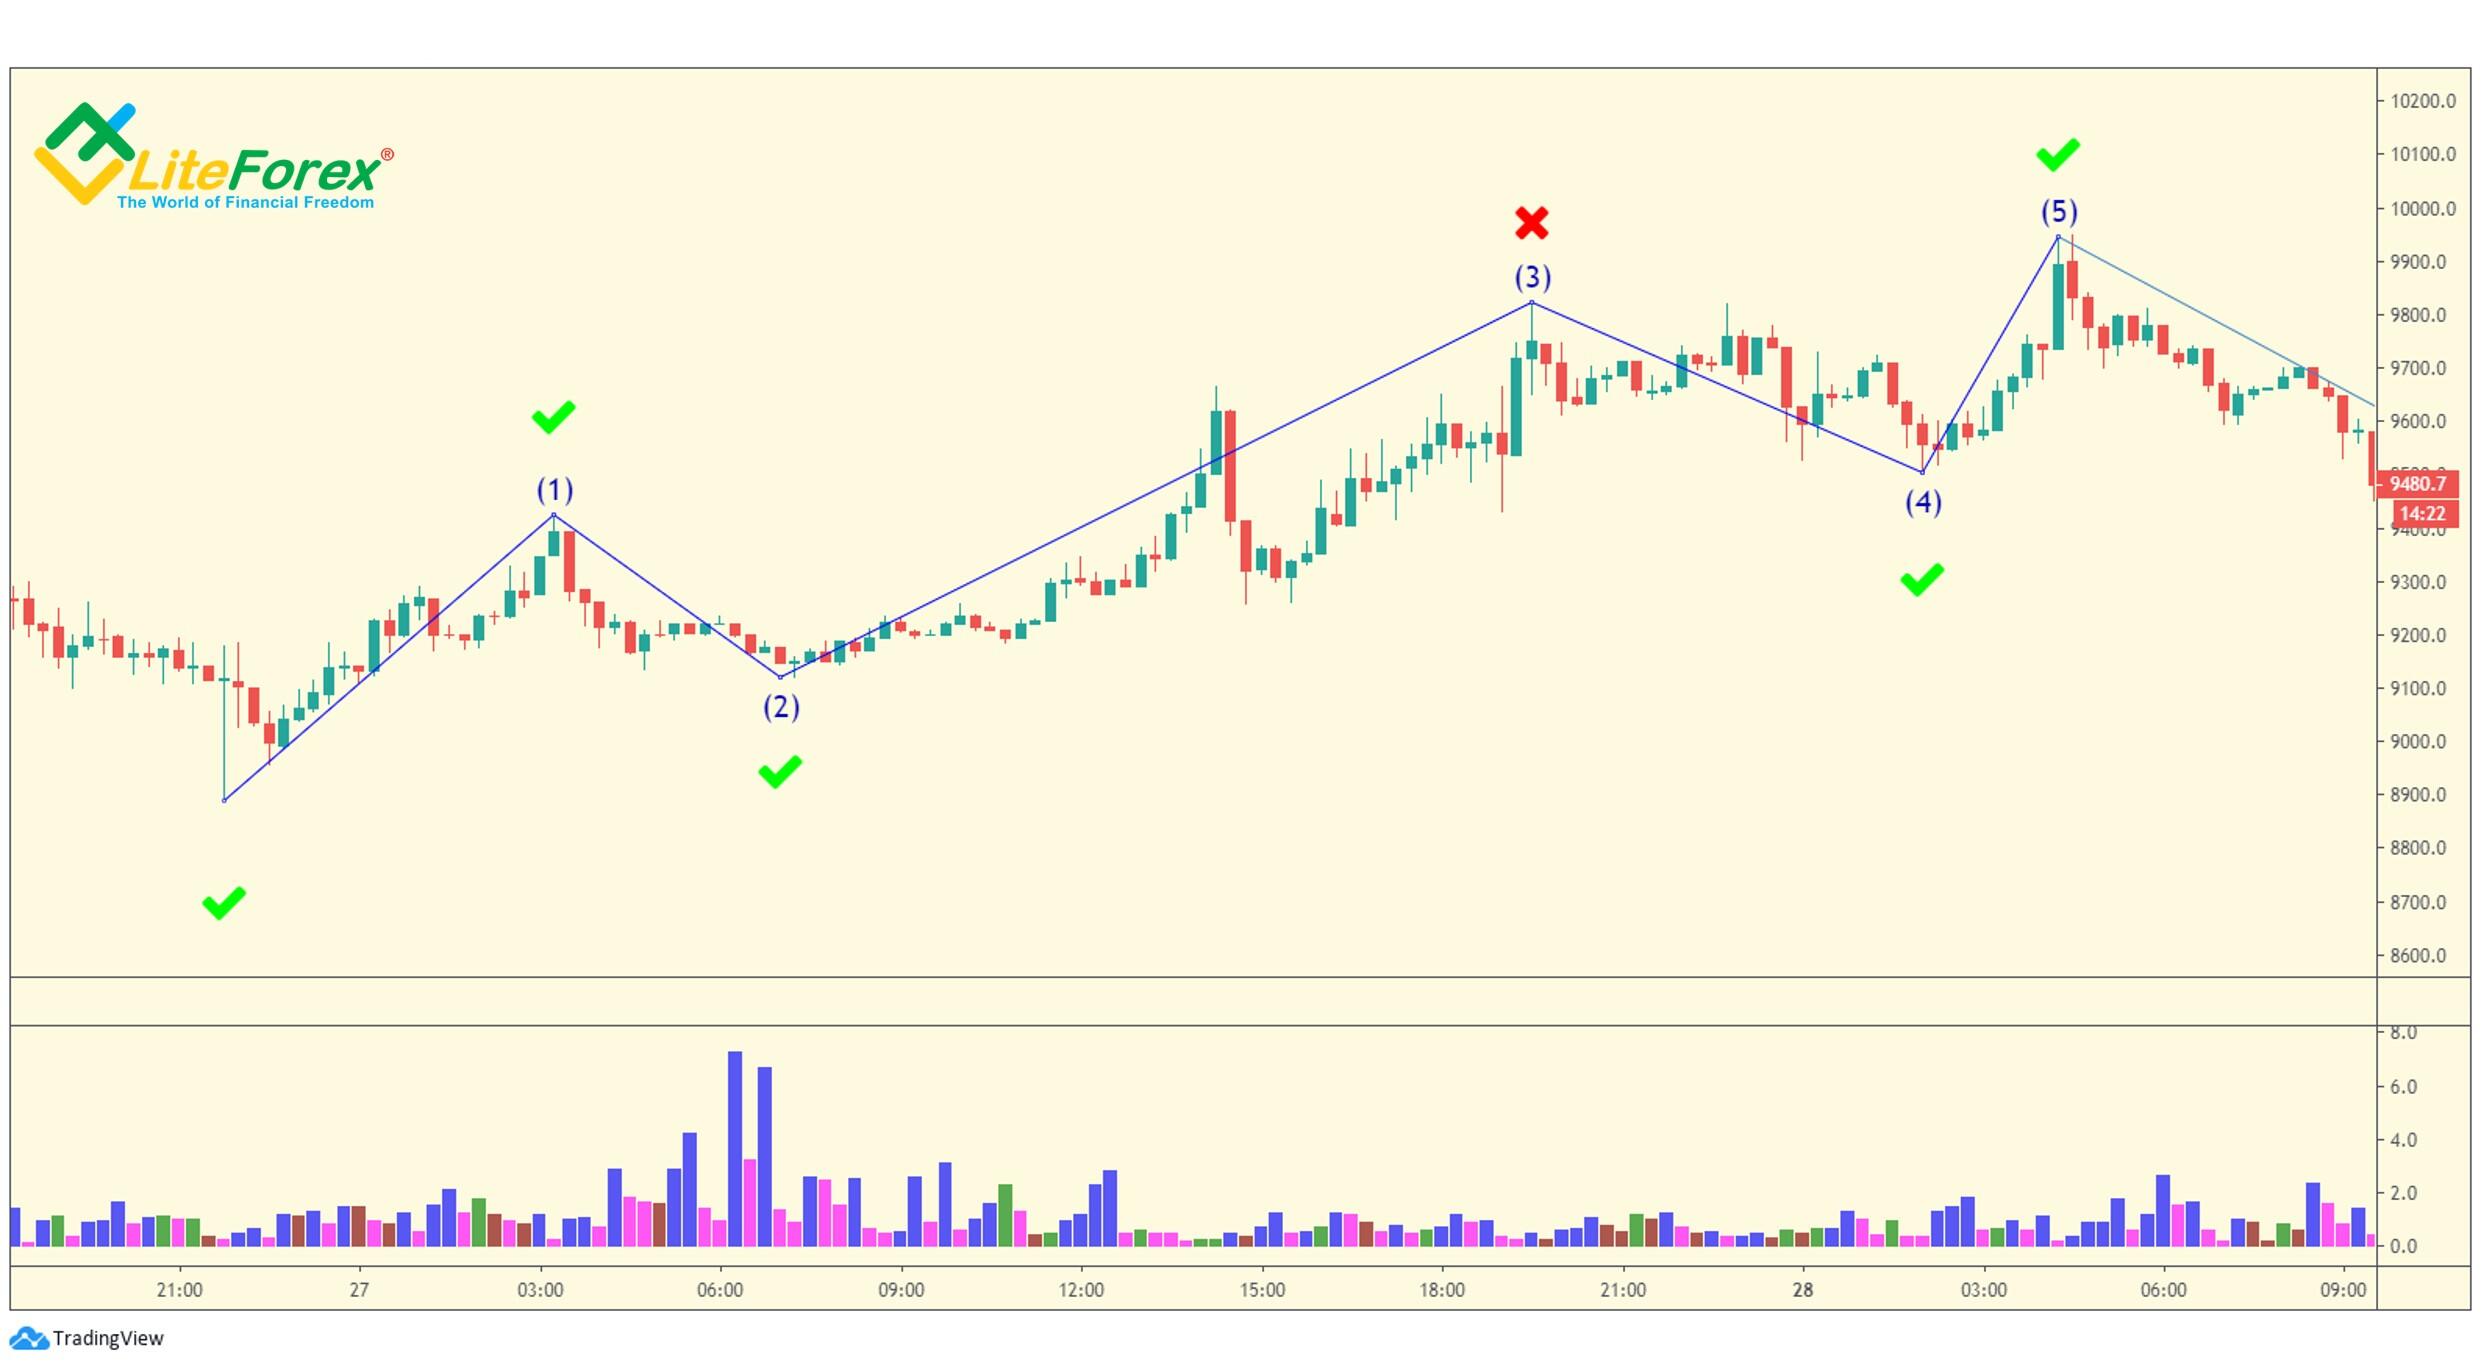
In the above chart, I roughly outlined Williams’s trading system. The blue zone, where the first wave is, is used to confirm that the trend is really developing. Green zones mark the buy zones, the red one- the zones to enter sell trades.
That is all for today.
I wish you good luck and good profits!
P.S. Did you like my article? Share it in social networks: it will be the best "thank you" :)
Useful links:
- I recommend trying to trade with a reliable broker here. The system allows you to trade by yourself or copy successful traders from all across the globe.
- Use my promo code BLOG to get a 50% deposit bonus on the LiteFinance platform. Simply enter this code in the appropriate field when funding your trading account.
- Telegram chat for traders: https://t.me/litefinancebrokerchat. We are sharing the signals and trading experience.
- Telegram channel with high-quality analytics, Forex reviews, training articles, and other useful things for traders https://t.me/litefinance
Price chart of BTCUSD in real time mode
The content of this article reflects the author’s opinion and does not necessarily reflect the official position of LiteFinance broker. The material published on this page is provided for informational purposes only and should not be considered as the provision of investment advice for the purposes of Directive 2014/65/EU.
According to copyright law, this article is considered intellectual property, which includes a prohibition on copying and distributing it without consent.