


Description of TD Retracements indicator. Explanation, construction principles and conditions of TD Retracements application.
Dear Friends,
We continue studying Thomas DeMark trading tools and developing a trading system.
We have already studied the following tools by DeMark:
TD – Wave (see here)
TD Sequential and TD Combo (see here)
Due to this article, you can safely add another efficient tool to the set of the studied indicators by DeMark.
Most professional traders agree that trend trading is probably one of the most simple and affordable strategies. Unfortunately, predicting a change in the trend direction is quite difficult. Any upward price movement sooner or later will come to an end and will be replaced by a fall. Price movement is like a zigzag. It does not mean something negative about this trading instrument, whether it is the BTCUSD or the EURUSD trading pair. According to the laws of the market, after a rise, the price should be corrected down to a certain level, which Thomas DeMark called the level “TD Correction” (TD Retracement). The calculation of the beginning and end of the corrective movement will allow us to open trades counter the trend and close them at the right time.
Like in the case with building trend lines, the application of Fibonacci retracement levels is a very subjective process. Different traders will consistently choose highs and lows depending on what they consider to be extreme price levels, and it is not surprising that different highs and lows have different meanings depending on the role of the market participants. This leads to different results. Therefore, this method has a large error.
Thomas DeMark developed a methodology that allows quite accurate identification of the retracement levels, calculating their values and duration in time.
TD Retracement Points
DeMark to calculate correction levels uses three price points and coefficients derived from a Fibonacci number sequence. If we are looking for TD Retracement levels to anticipate the price fall, then the first point B is the last record price low (reference).
Then you need to draw a horizontal line from this point from right to left, find the day with the price below the reference price low (point C), and then choose the highest point between them (point A). Thomas calls this point the “critical price” (see the example in the chart below).
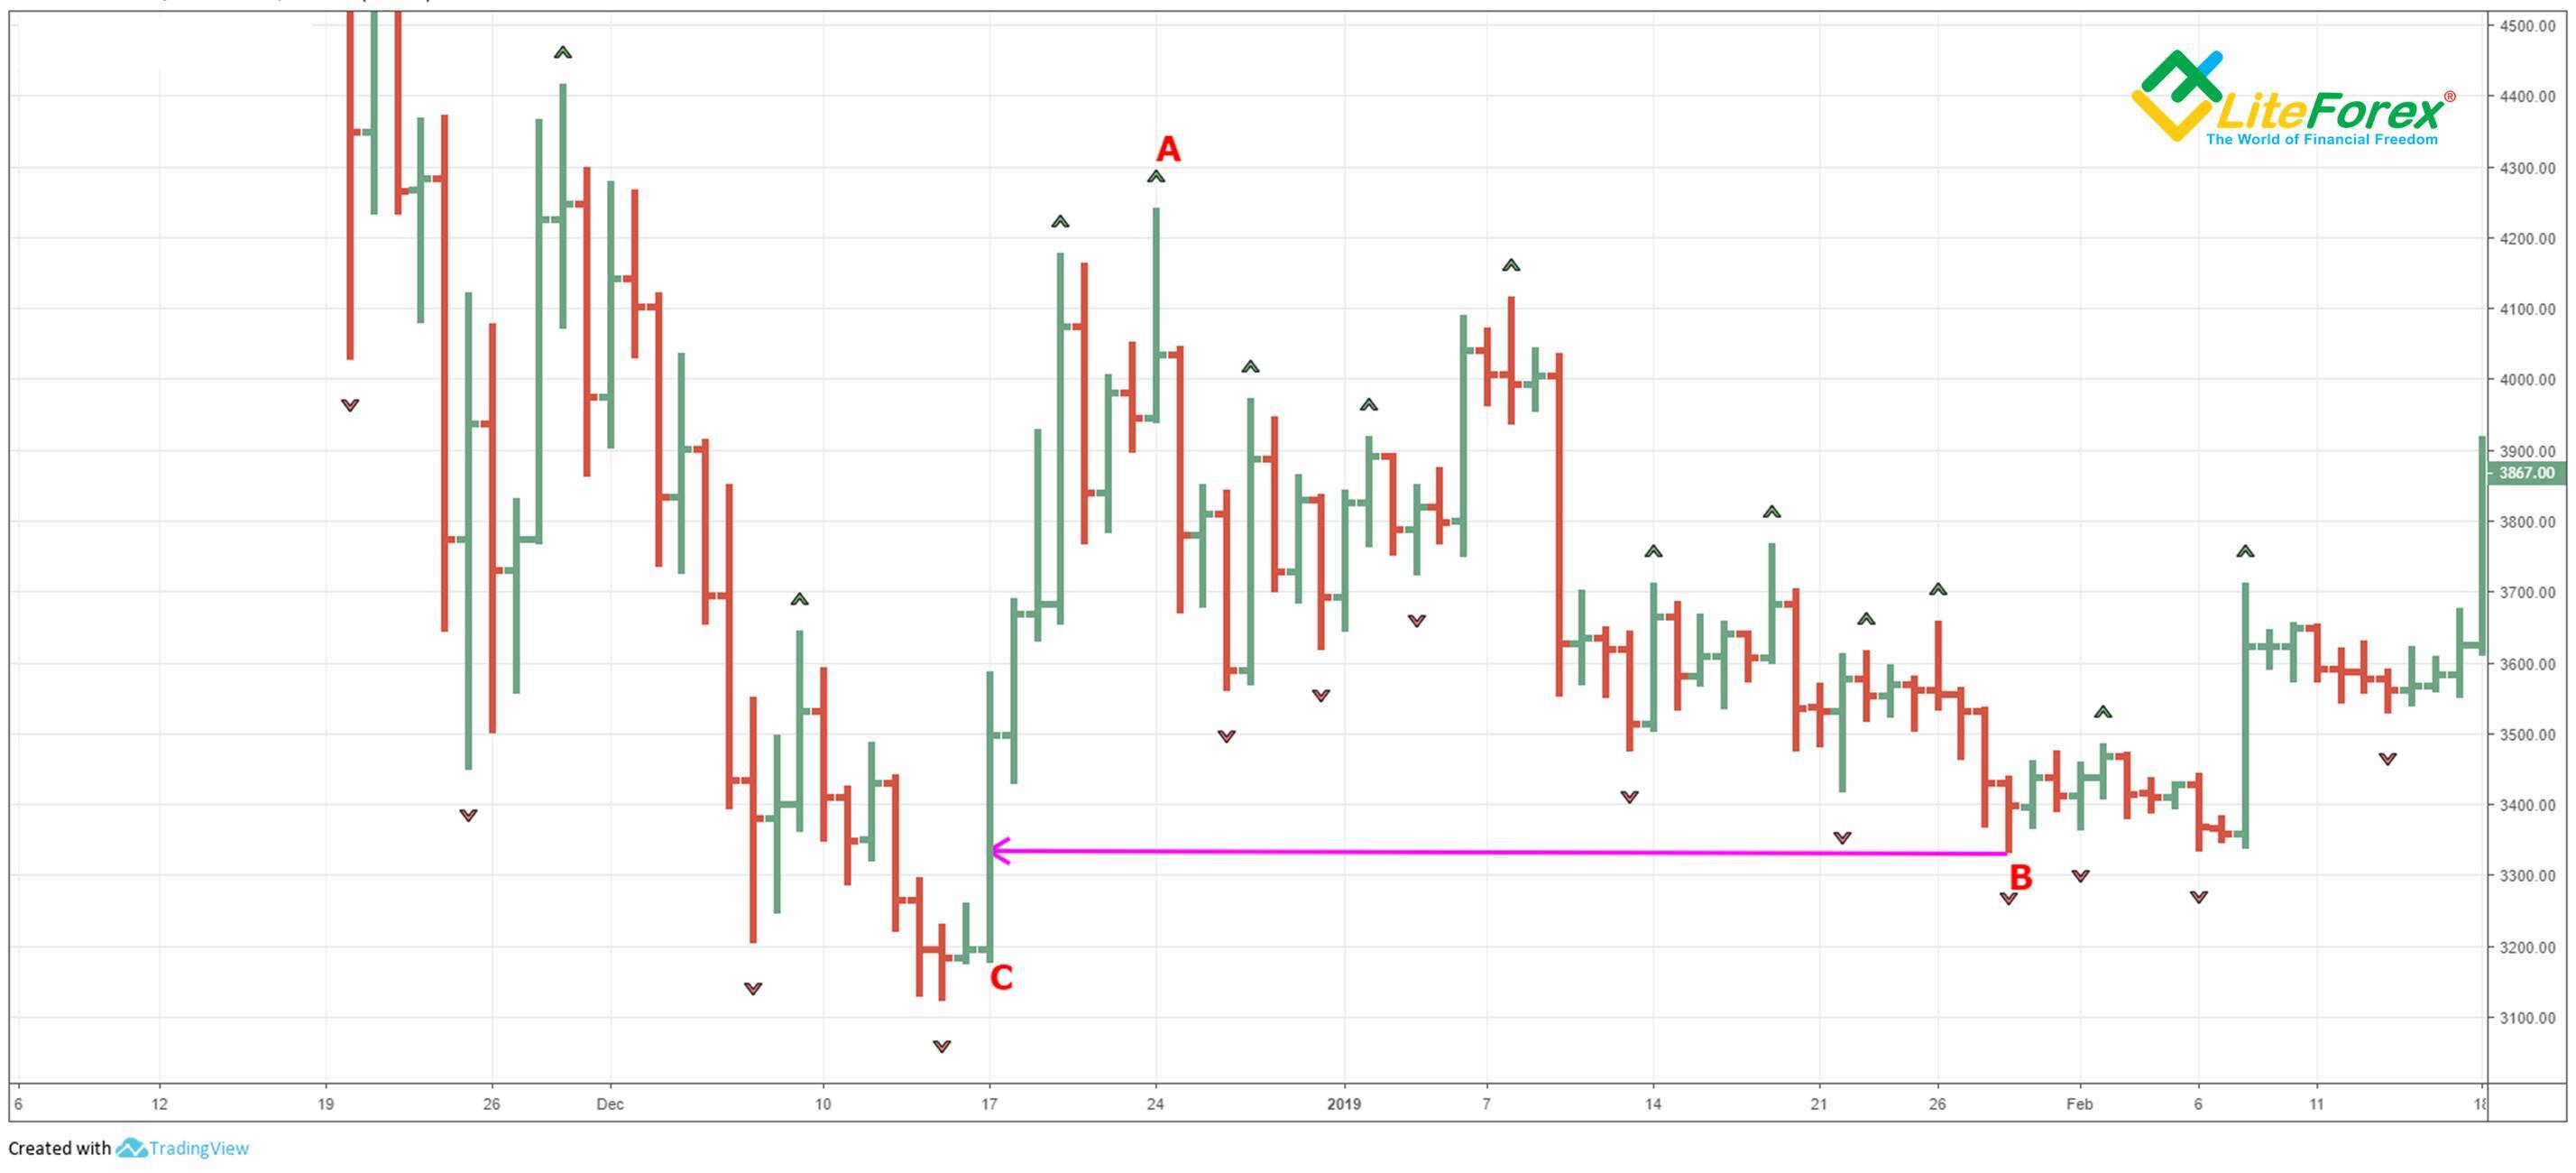
And vice versa, to choose the points in the downward movement to build the retracement levels, you need to find the last two price highs (points B and C) and choose the lowest point between them (point A).
DeMark also introduces the concept of "magnet price". He associates with it the fact that the corrective movement often does not reach the maximum, stopping at a level equal to the closing price on the day of the price high or low, depending on the direction of the trend. In other words, the closing level of the bar that formed point A is the “magnet price” (TD Magnet). The property of magnetism of this level results from the fact that many traders start exiting trades approaching the previous price high, expecting a rebound from the resistance line.
Identification of magnet levels to project TD Retracement levels.
To determine the TD retracement level, DeMark introduces such a concept as retracement factors (see the table below). ниже)
Retracement Factors
0.382 | |
0.618 | |
| |
1.382 | |
1.618 | |
2.236 | |
2.618 | |
3.618 |
In fact, this is a set of Fibonacci levels that are arranged, based on the magnet price.
Consequently, the TD retracement levels are built according to the following algorithm:
If you expect a downward movement after a bullish rally,
1. Calculate the difference between the reference high found earlier and the “critical price”;
2. Multiply this number by a retracement factor of 0.382 and 0.618 and
3. Subtract the obtained values from the reference high.
If you expect an upward movement after a decline,
1. Calculate the difference between the reference low found earlier and the “critical price”;
2. Multiply that number by 0.382 and 0.618
3. Add the resulting values to the reference low.
The resulting points will be the retracement levels. If the market closes above the retracement level of 0.382, there is a real chance that it will reach the retracement level of 0.618. If it closes above the retracement level of 0.618, the price is likely to move even higher, to the magnet price.
The TD magnet price is important because most people focus on the retracement of 1.00, that is, on the extreme high or low of the reference level - after the breakout of level 0.618. It is remarkable that Thomas DeMark called the factors up to the “magnet price” corrective, and those that are higher are expansion factors. This is due to the fact that if the level of the “magnet price” is broken out, the corrective movement is getting more likely to develop into the trend, opposite to the previous one.
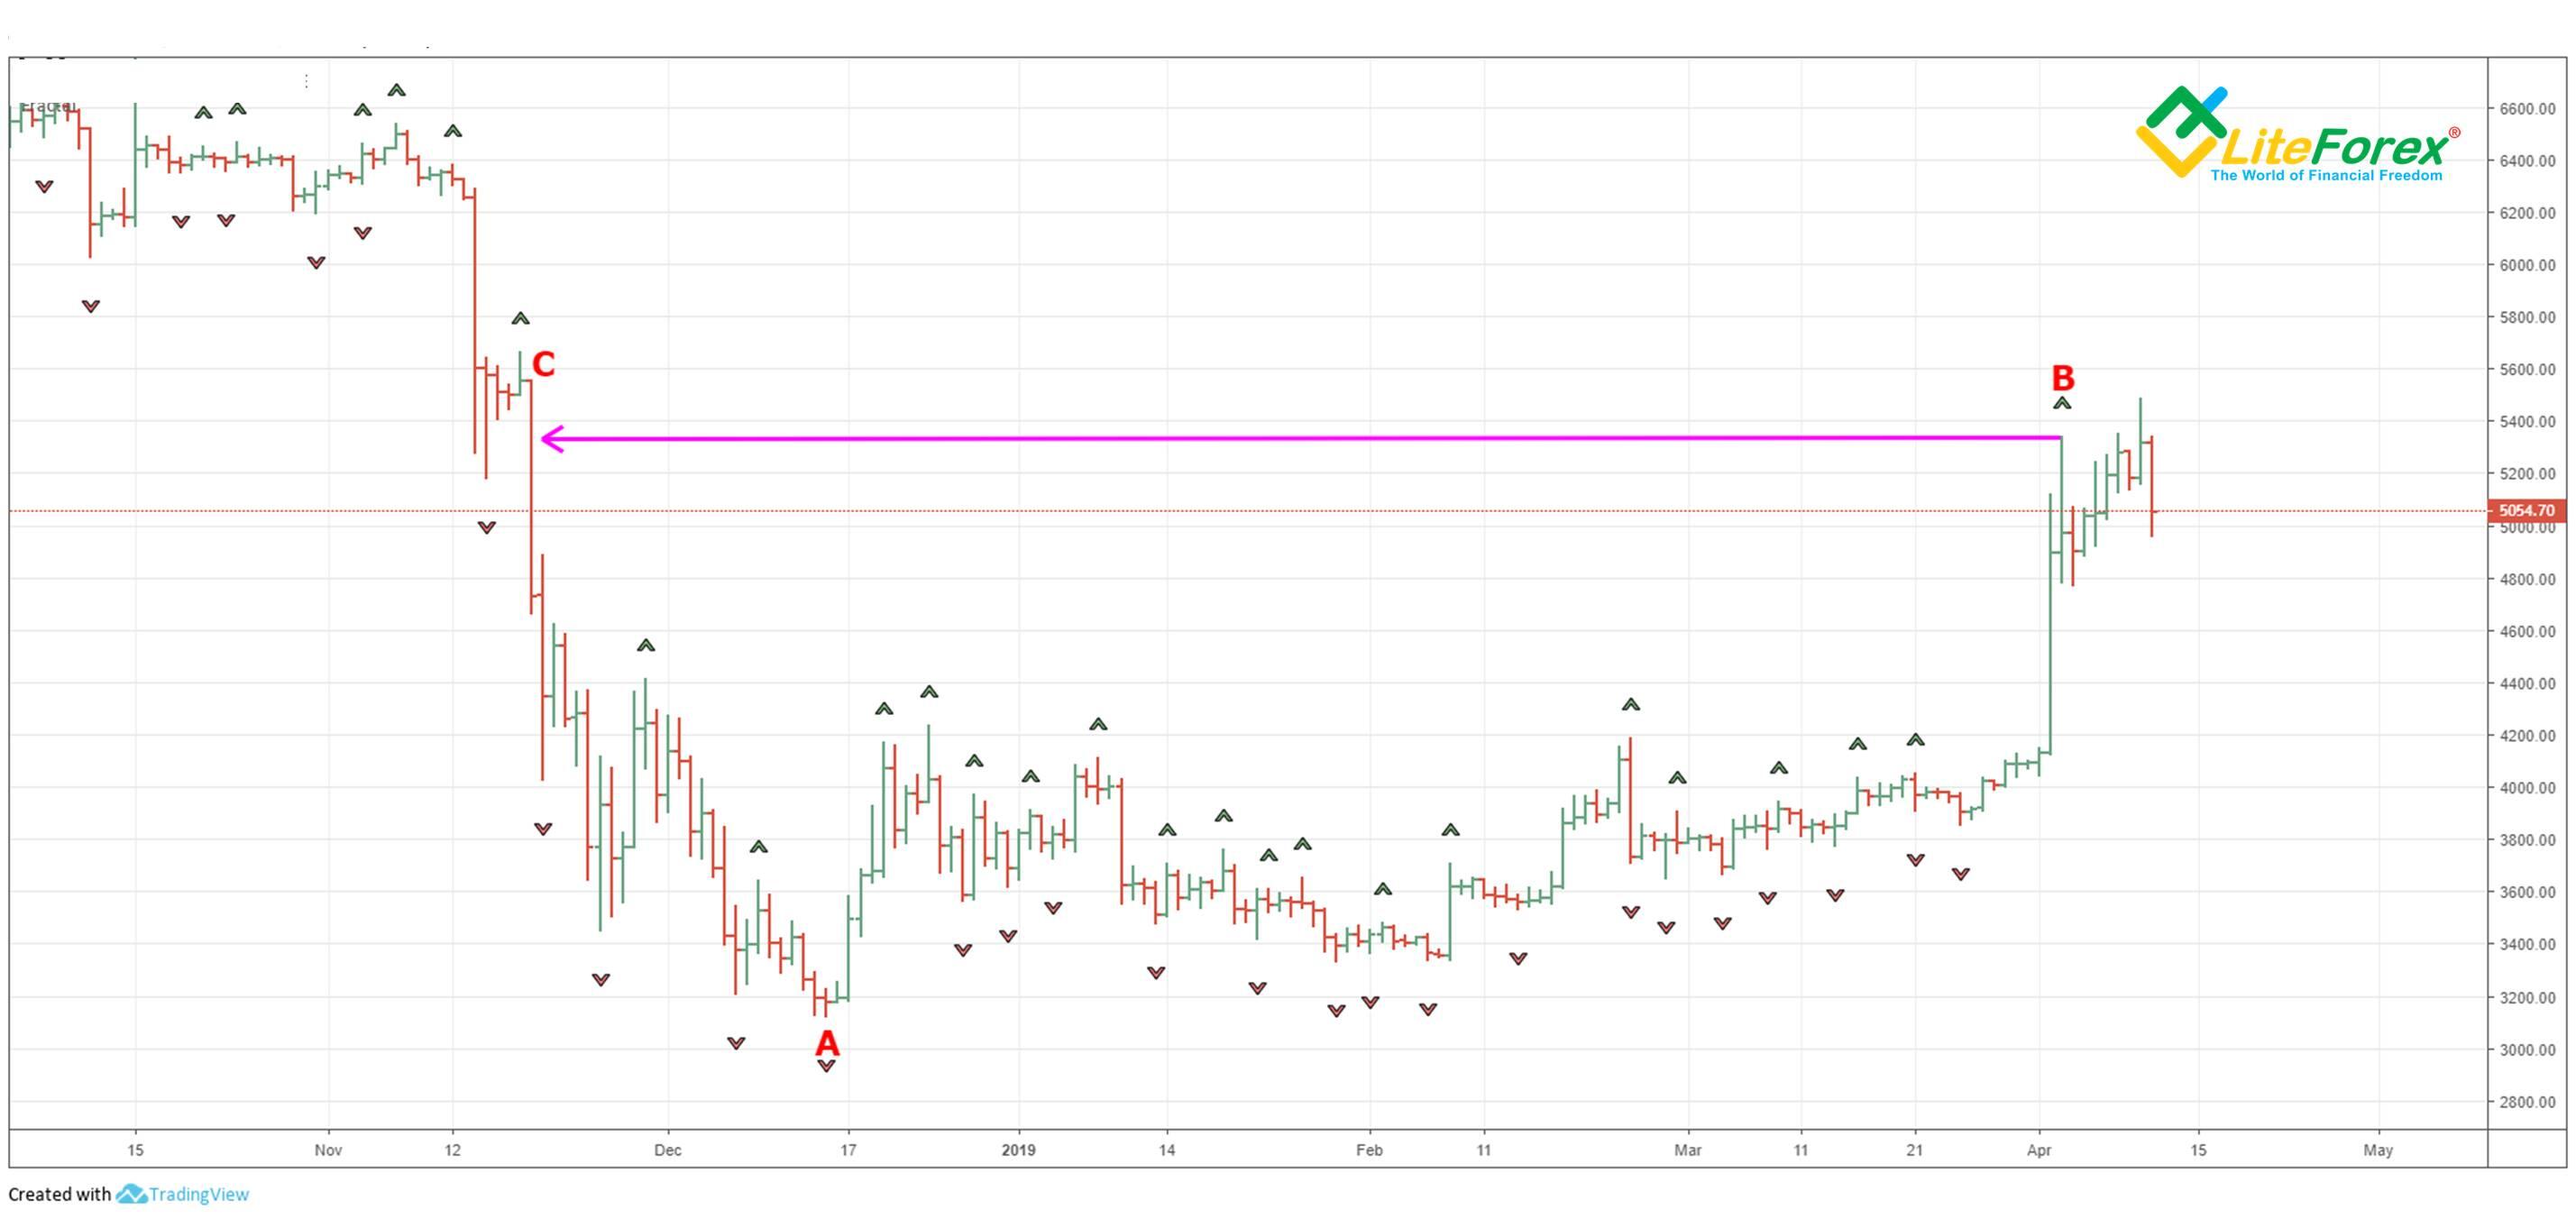
1. Identify price C, when the market closed above reference low B, and then choose the lowest point A between the two given lows (I described how to do it in the beginning)
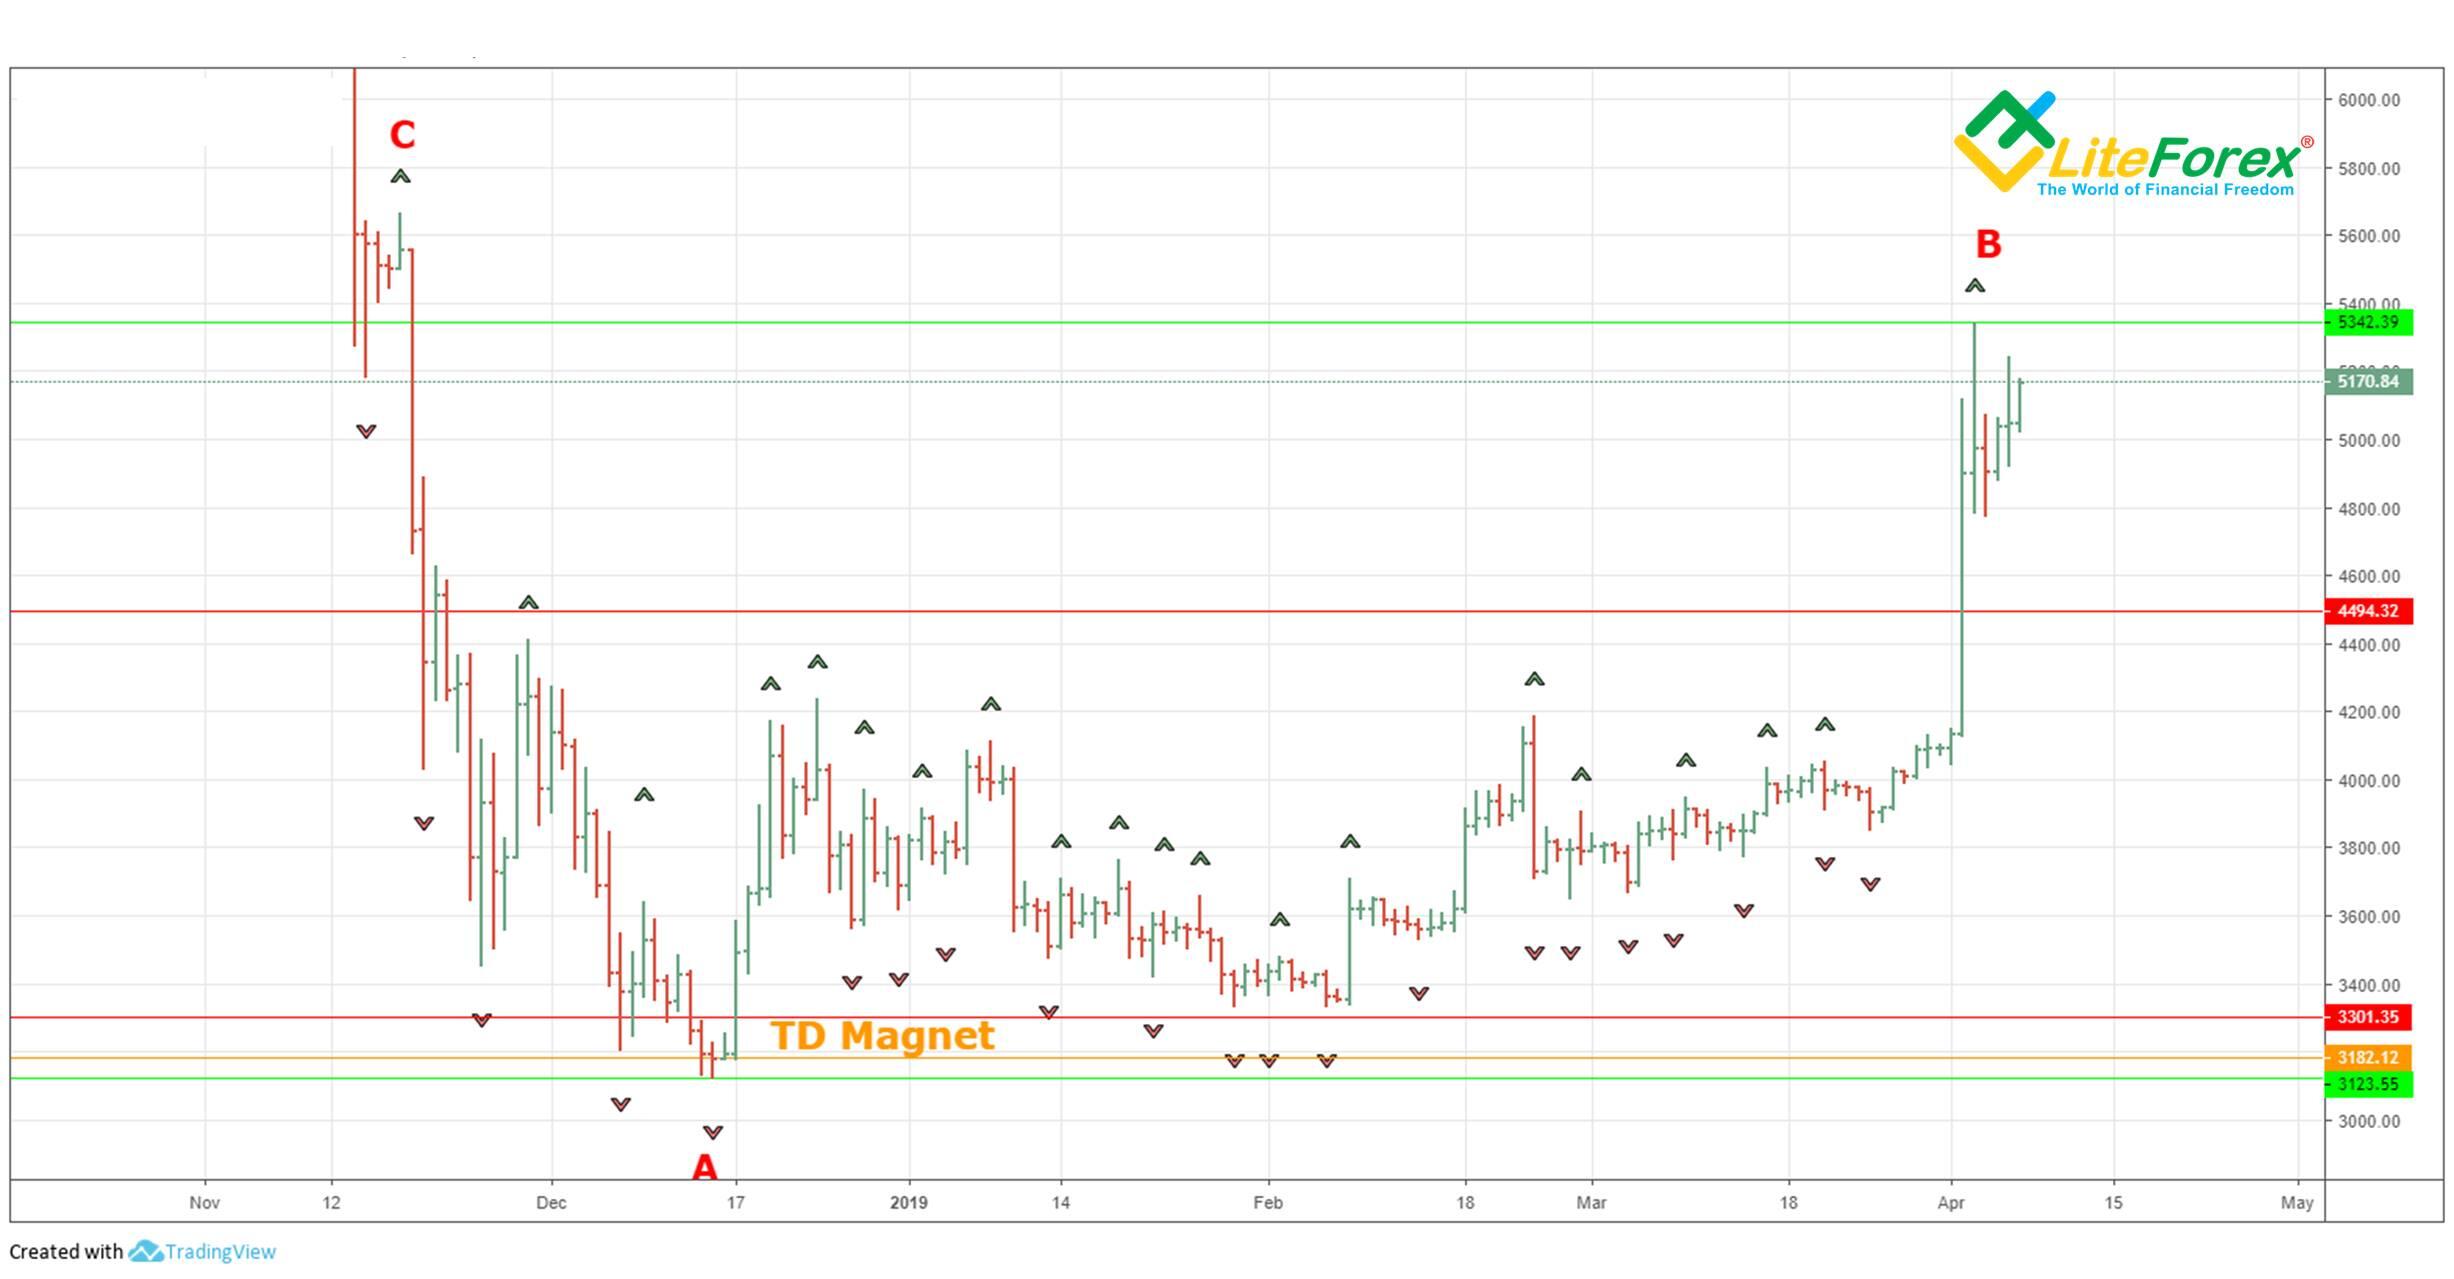
The above chart shows that the price high is at the level of 5342 USD - point B.
The local low - “critical point” - is at the level of 3123 USD - point A.
The closing price at point A - “magnet price” - is at the level of 3182.12 USD - TD Magnet orange line.
Having determined all the necessary values, let's proceed to the calculation of the TD Retracement.
Find the difference between B and A.
5342-3123=2219
2. Multiply the resulting value by 0.382 and 0.618, and then subtract the results from the reference low. Notice how TD "magnet price" provides resistance in some cases.
5342-(2219*0.382)=4494.34
5342-(2219*0.618)=3301.35
According to this data, we will construct two retracement levels. As can be seen from the chart, the level of 4494.34 does not reach the “magnet price” of 3182.12. Rebound from the “magnet price” resumes a wider trend in the former direction, while a successful breakout of the “magnet price” leads to the breaking through the reference high or reference low, while a successful breakthrough often leads to an expansion of the downward movement to the level of 1.382.
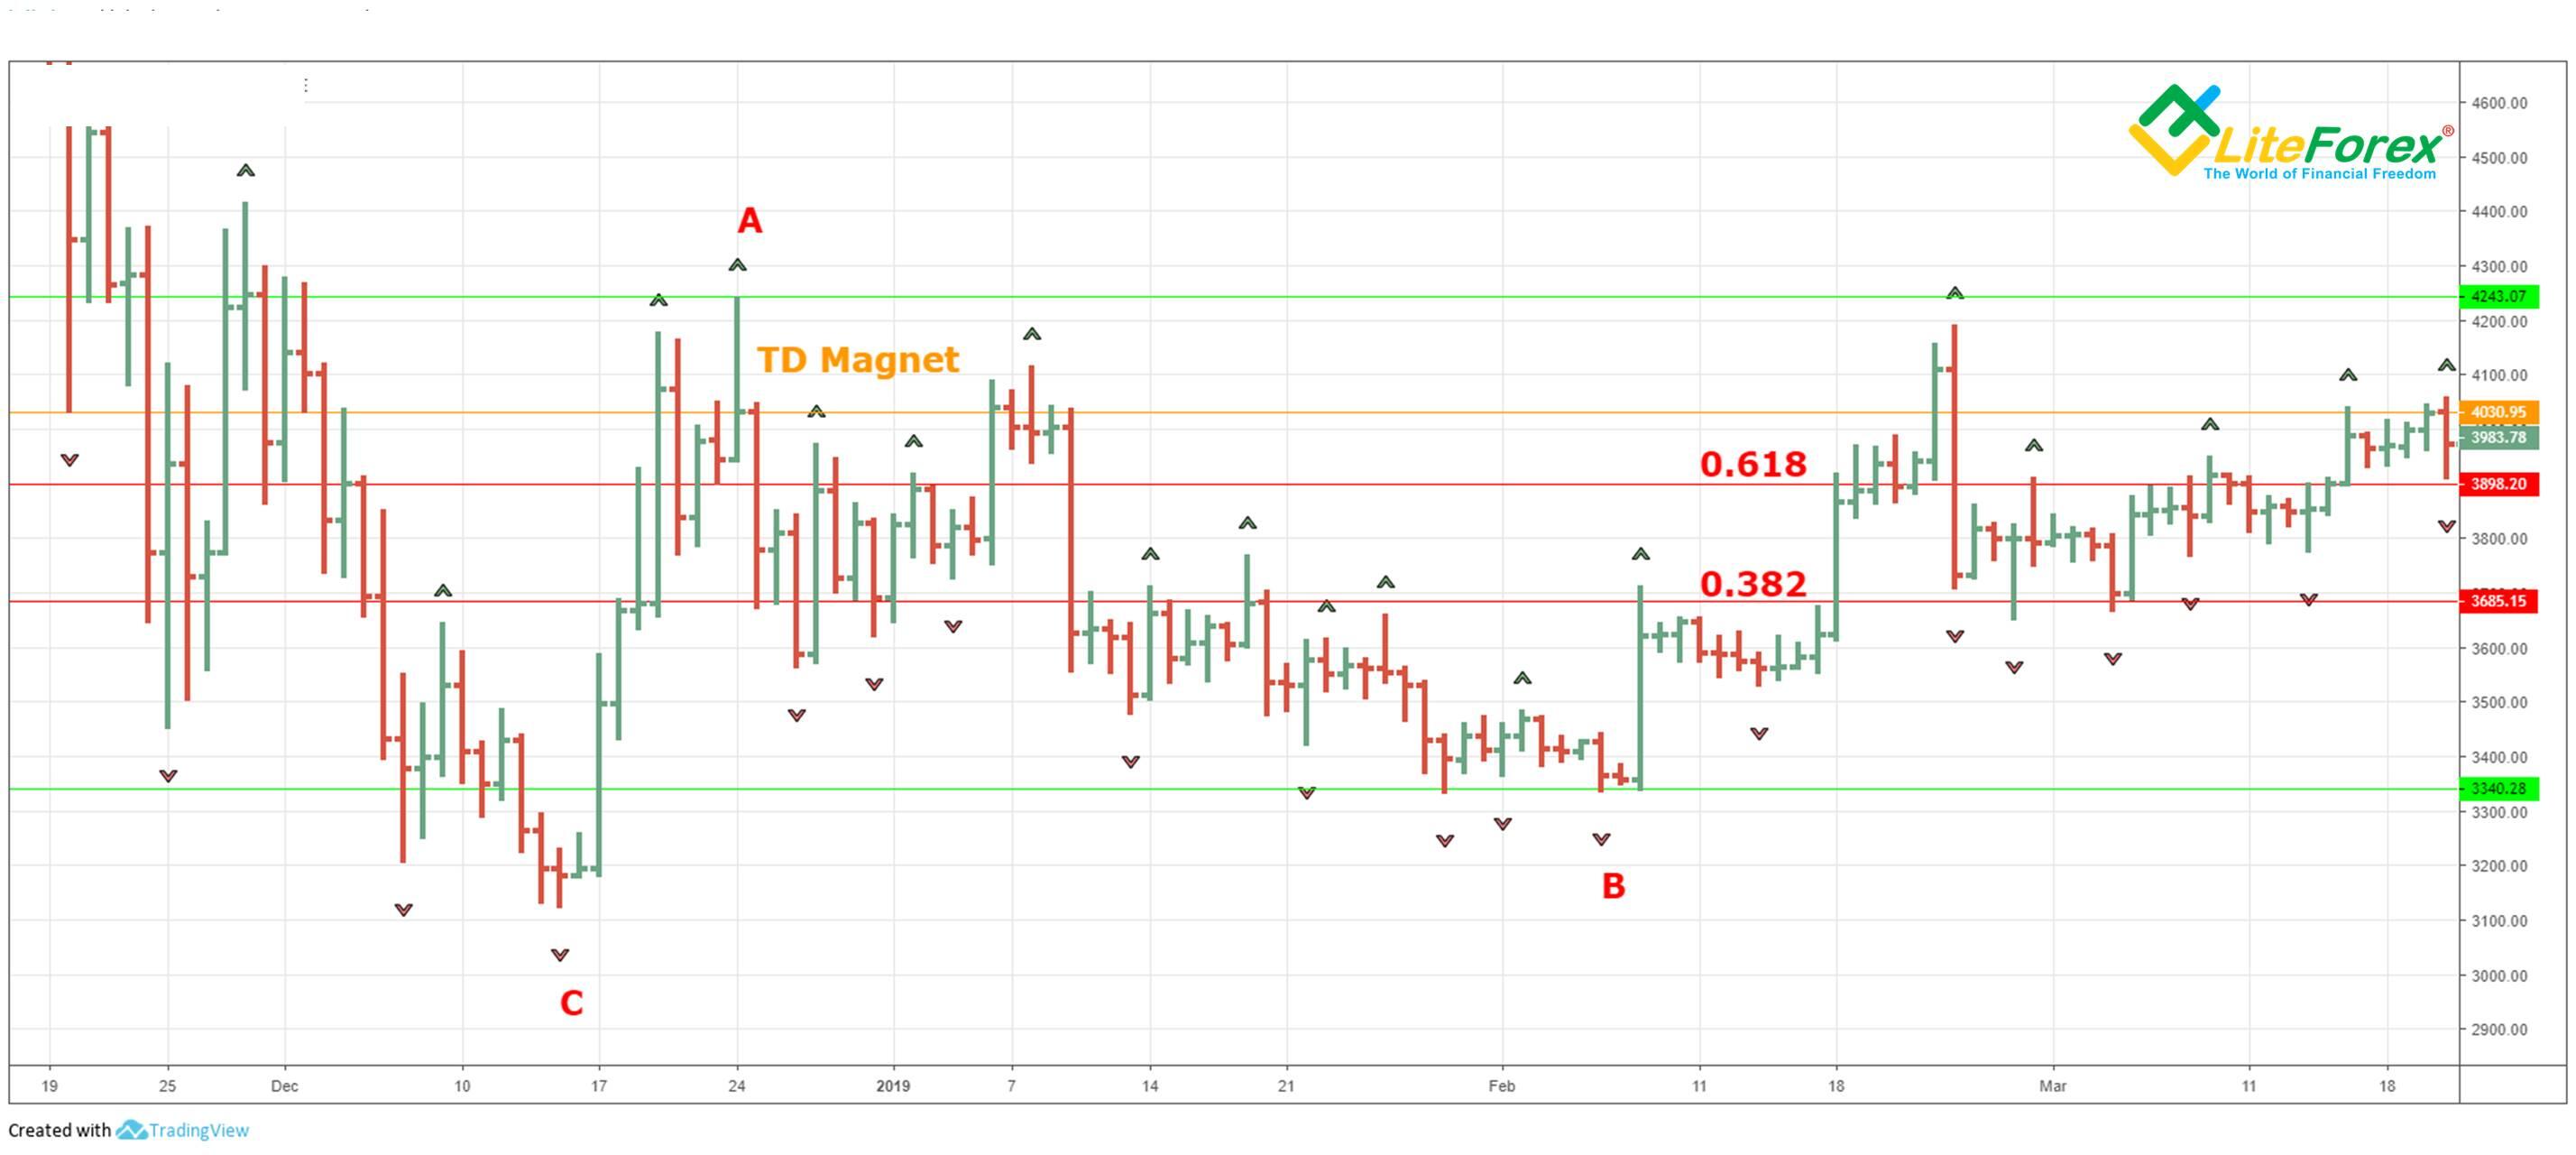
Now, let us study building TD Retracement levels on the daily BTCUSD chart for a downtrend (see chart above).
We construct the retracement levels for the history of the BTCUSD daily chart. At point B equal to 3340.28, the trend reversed and went up. Let's draw a straight line from right to left and find point C when the price was below point B. But the value of point C is not important to us. We define “critical price”, point A equal to 4243.07.
Find the difference between points A and B:
4243.07-3340.28=902.79
To calculate retracement levels, multiply the result by the retracement factors and add to the value of the reference point B.
3340.28+(902.79*0.382)=3685.15
3340.28+(902.79*0.618)=3898.20
As you see from the chart, at the retracement levels, a corrective movement in the flat did occur. After the breakout of level 0.382, the price stopped at the level of 0.618, then broke through the “magnet price” level and, not reaching the “critical price” level a little, rolled back to the level of 0.382. Further, the levels of relative TD retracement formed a “corridor”, inside which the price was trading for 20 days.
In case of the “magnet price” level breakout, one can expect a movement to the level of 1.382, which is determined similarly to the previous retracement levels.
As you can see, the TD retracement levels have worked out perfectly and we can safely apply them further. However, in order to confirm these signals, it is necessary to make sure that the corrective movement itself is true.
Three qualifiers to validate the TD retracement levels
As in the method of TD lines, qualifiers are used to validate the correction movement and TD retracement levels. So, if any of the following three conditions is met, then the intrabar breakthrough of the top of the relative TD correction level is true, and the probability of closing above the relative TD correction level increases.
TD Qualifier 1
- With a downtrend, the close, prior to their upside breakout, must be lower than the close, two bars ago before the upside breakout inside the bar.
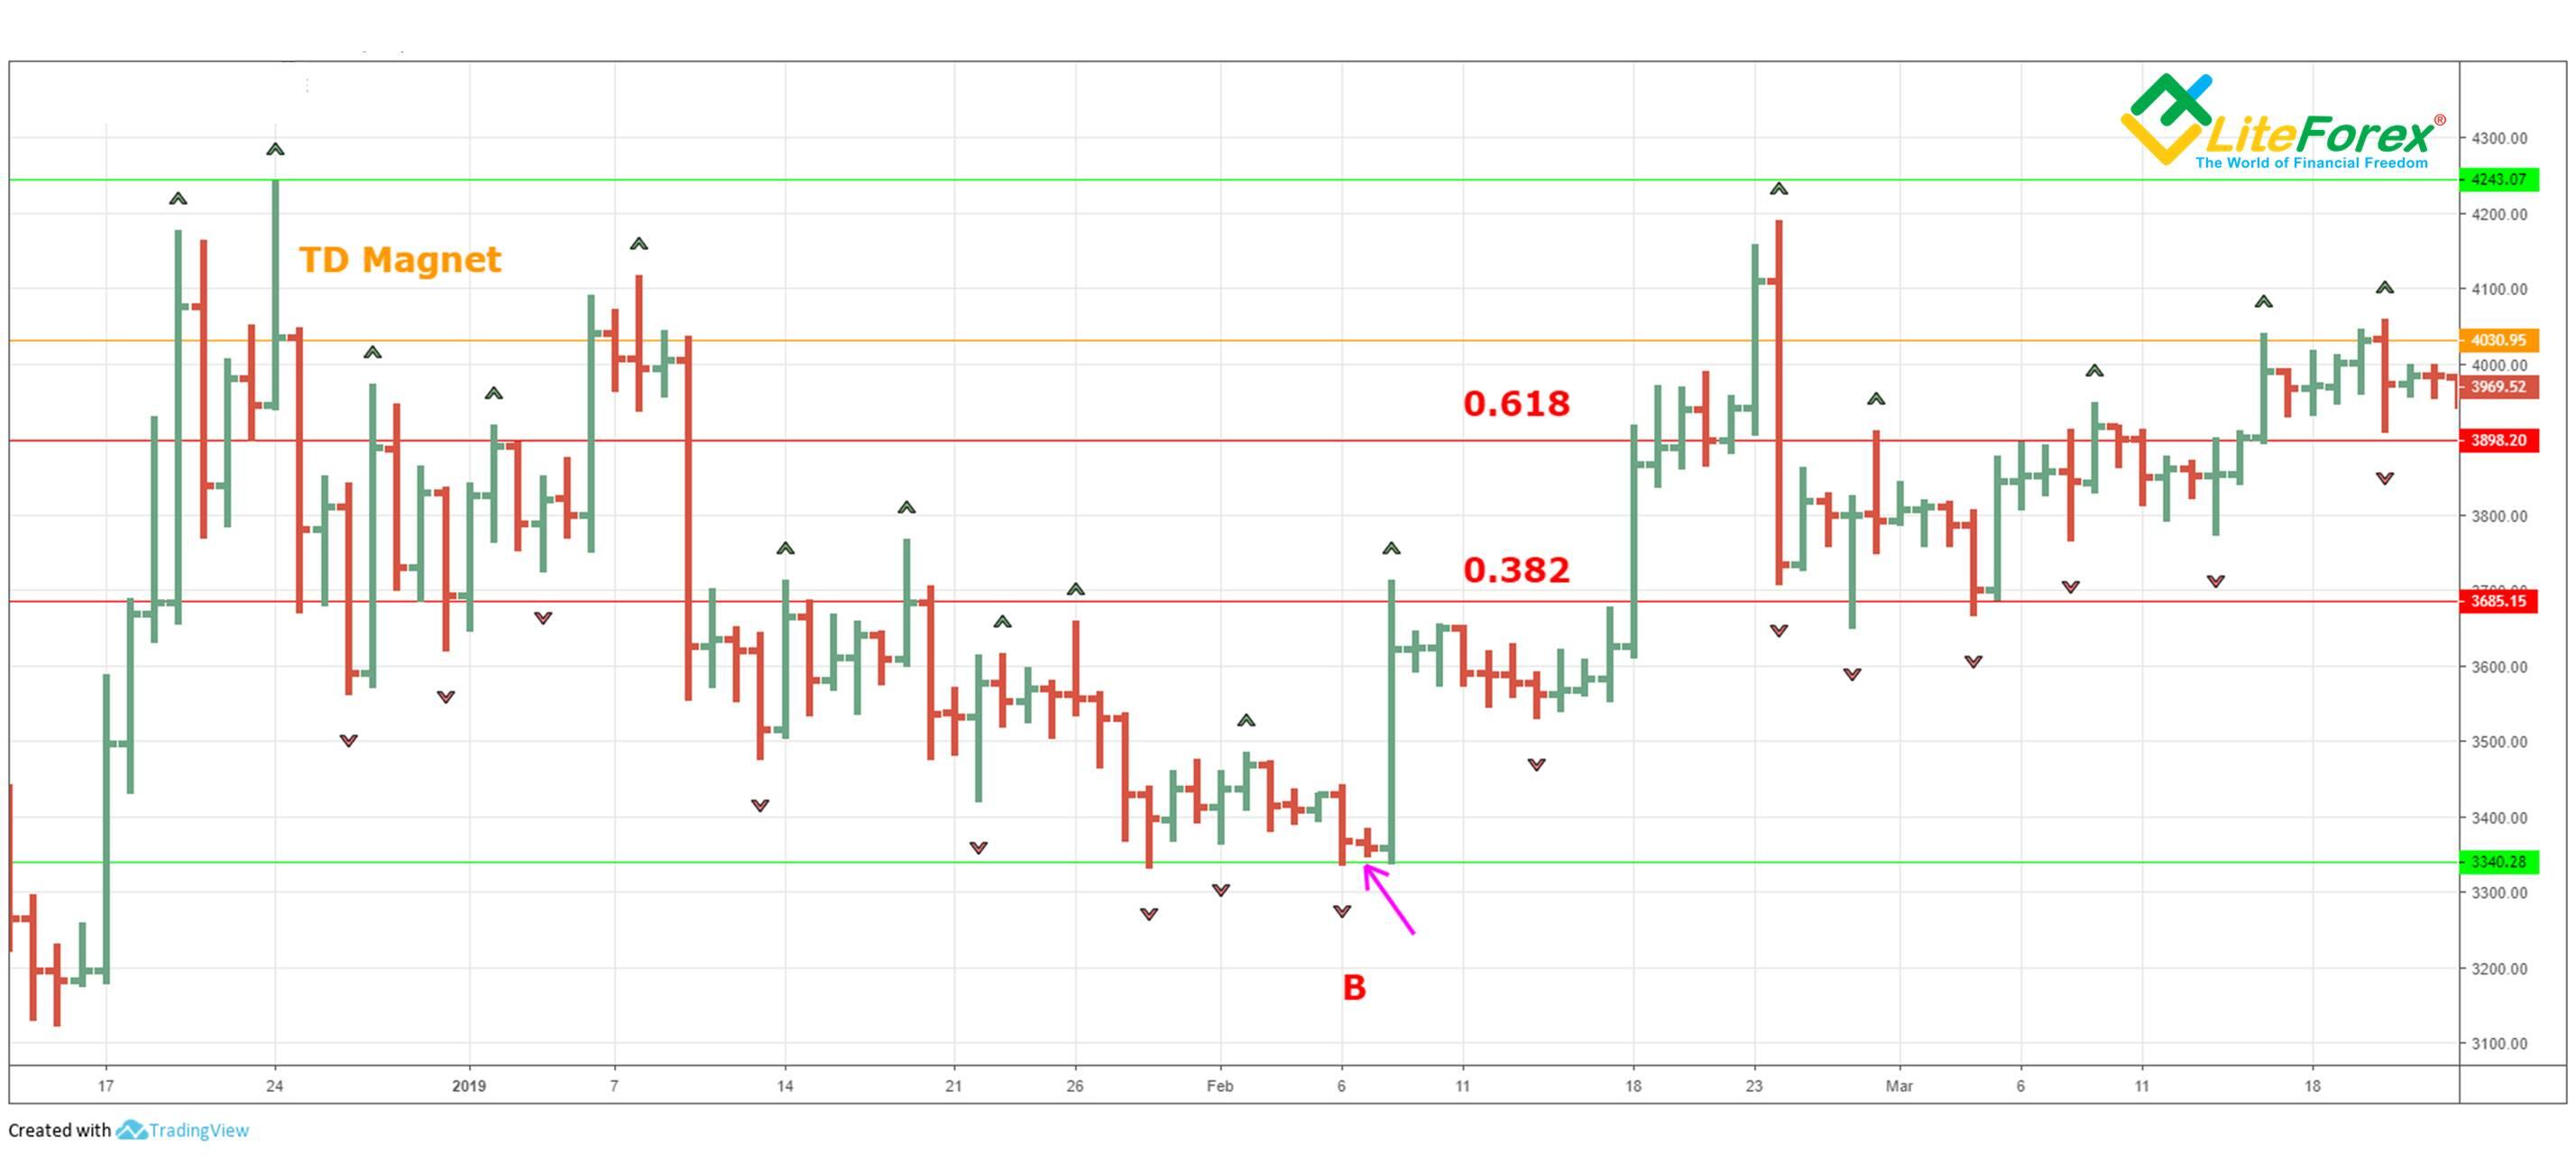
The chart above shows that before recording point B, the price declined relative to the previous day. Therefore, the conditions of the first TD qualifier are satisfied. This signal indicates the market being oversold, and we can enter an intraday trade, expecting or the price to reach the TD retracement level. In this case, the level of 0.382 was reached within one trading day.
If we analyze an uptrend, then the condition for the first TD qualifier is the price increase on the day before the breakout.
If the first condition is met, traders can open long positions during the correction, and not wait for a bullish confirmation at the bar close. If the condition of the first TD qualifier is not met, the probability increases that, having reached the TD retracement level, the price will rebound and continue the trend movement.
TD Qualifier 2
- If the first condition is not met, a true breakout can still occur if the market opens higher (lower) than the level of the relative TD retracement and goes on trading one tick higher than the opening price.
If the condition of the second qualifier is met, it suggests that the balance of demand and supply has shifted in favor of the bulls and the resumption of consumer activity will increase the chances of closing above the upward TD retracement level.
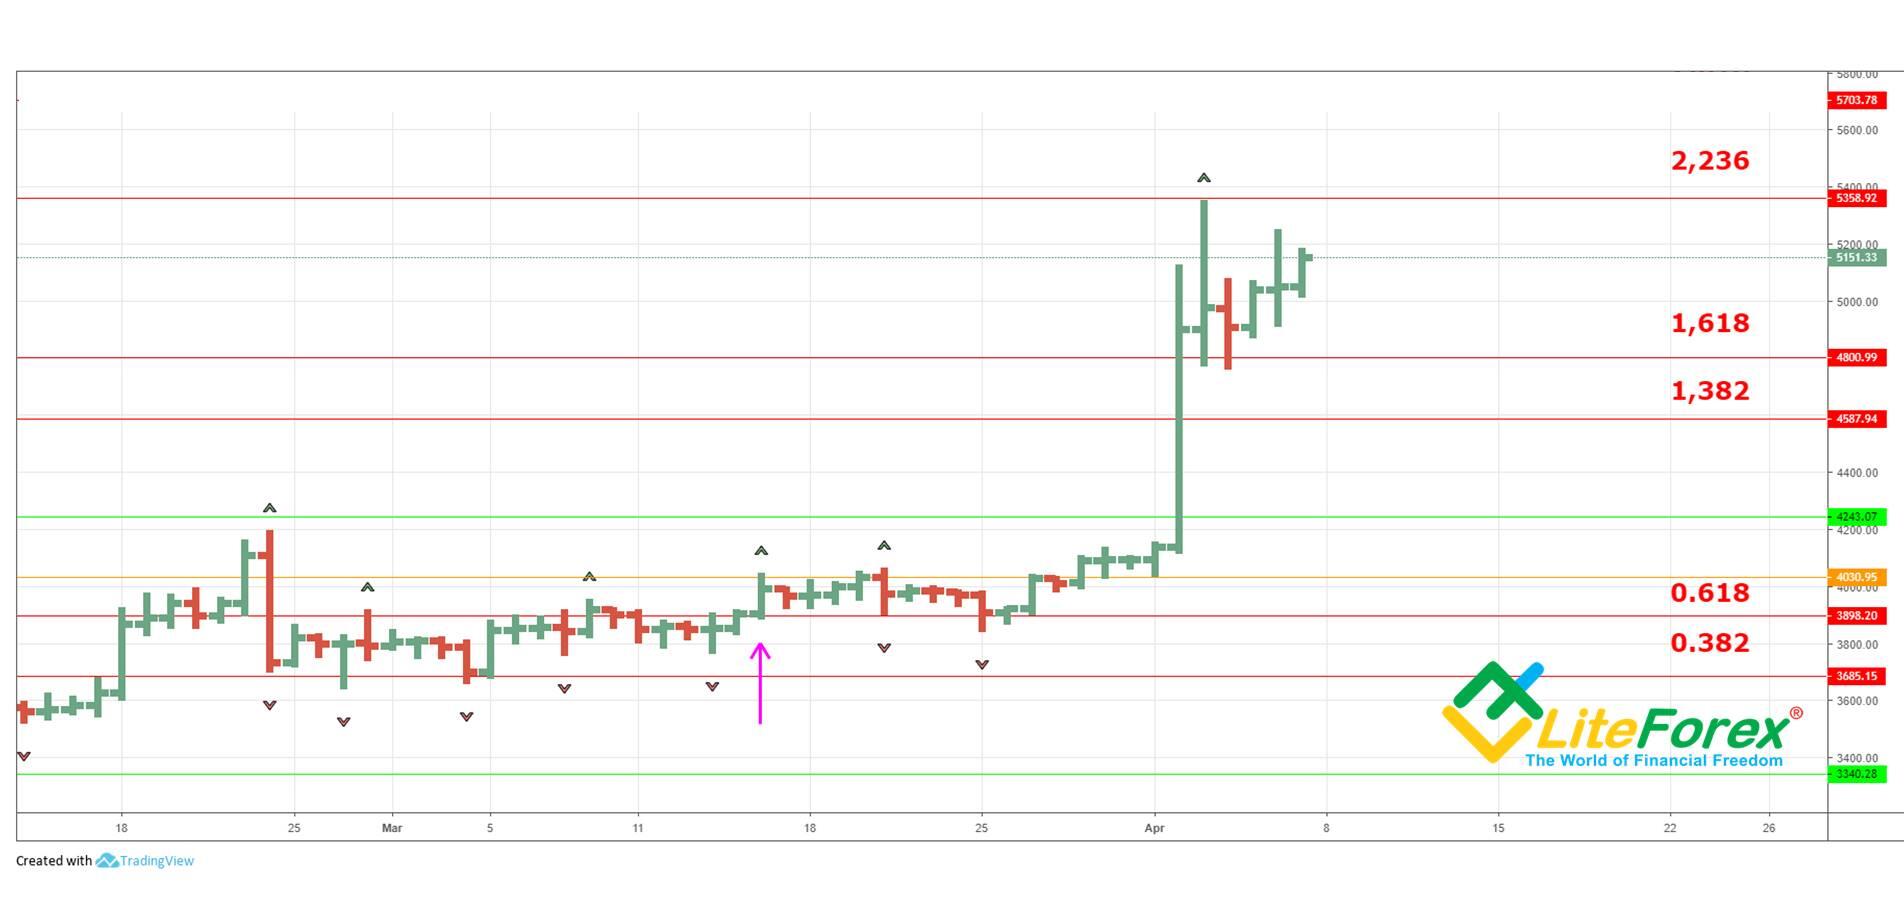
In the chart above, the arrow points to the bar, where the market opened a little higher than TD retracement level. Therefore, the condition of the second TD qualifier is confirmed.
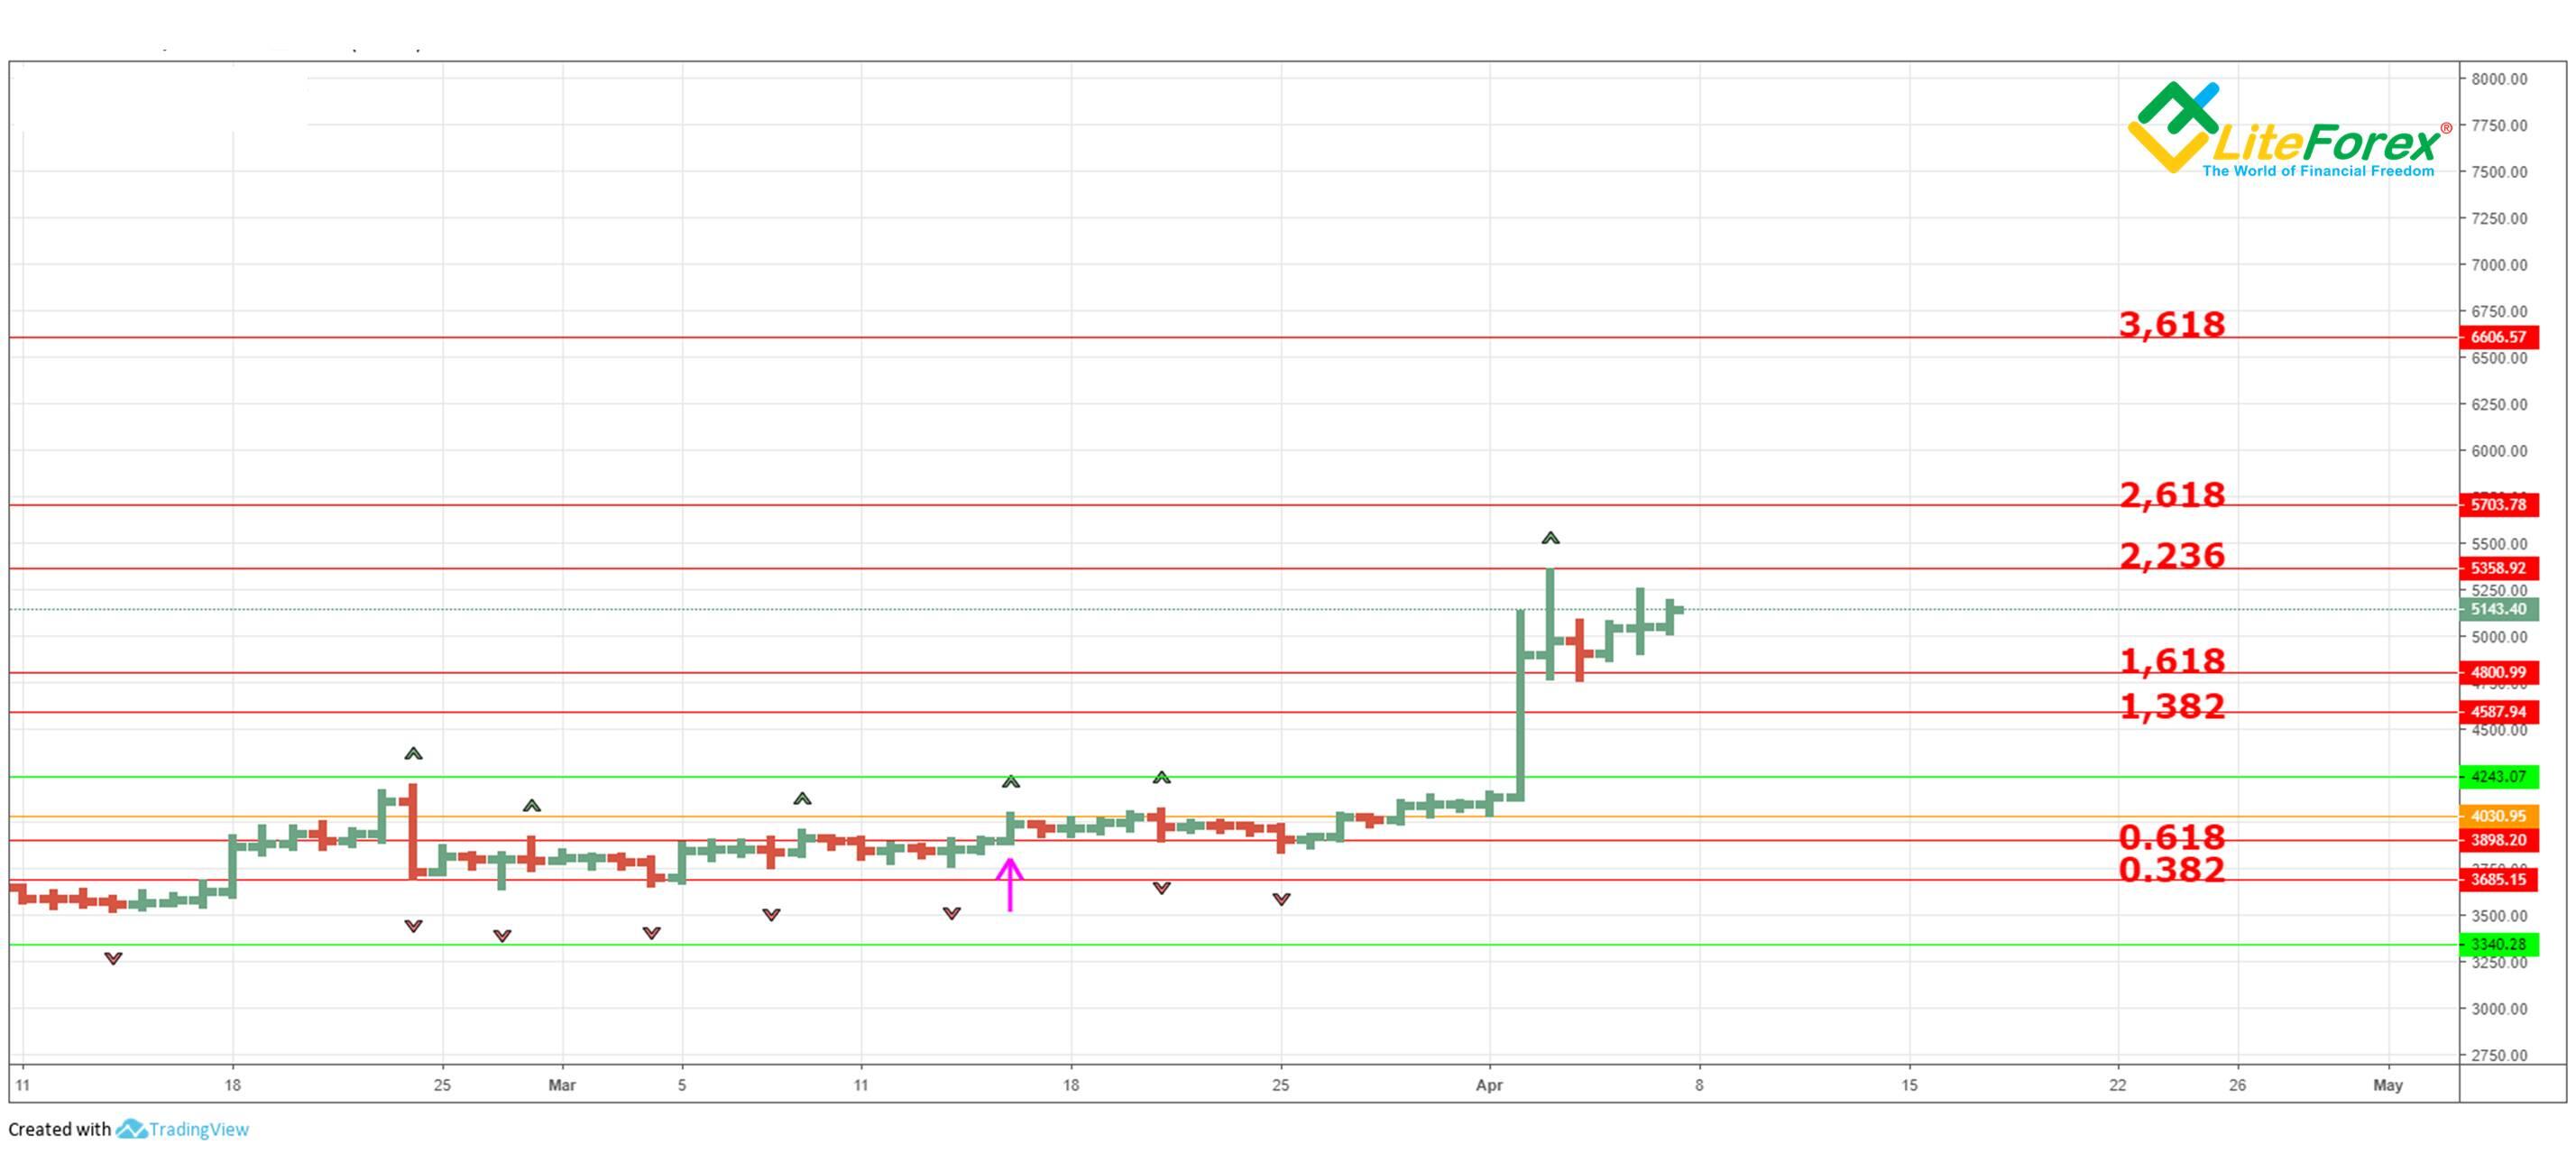
In addition, the previous bar is higher than the bar before it. This suggests that the first TD qualifier is not confirmed. Despite this, the price went higher, reaching the "magnet price". Next, it was trading in the corridor formed by the retracement level of 0.618 and the “magnet price”, which indicates the strength of this level. After its breakout, the price soared, reaching a level the TD retracement of 2.236. Thomas DeMark emphasized the importance of the “magnet price” level. Its breakout indicates the trend reversal and, of course, the beginning of a new one. Therefore, in the future we can see the market growth even higher and the price may test such BTCUSD TD retracement levels as 2.618 and 3.618, which correspond to 5700 USD and 6600 USD for 1 BTC respectively (see the chart below).
TD Qualifier 3
- Assuming an upside breakout of the TD retracement in a downtrend, determine the price bar prior to the upside breakout (X-1) and calculate the difference between this bar close and the smallest of the two following values:
- This bar low, or
- Previous bar close (X-2 close)
Then add this value to the closing price of X-1 and if the result of the calculation is higher than the relative level of TD retracement, then the correction will end soon;
If the result of calculations is below the level of relative TD retracement, then, the price will continue to grow after the breakout of the TD retracement level.
This qualifier, like the first one, is based on the concept of oversold market. Its implementation indicates an increase in consumer demand in comparison with the previous days.
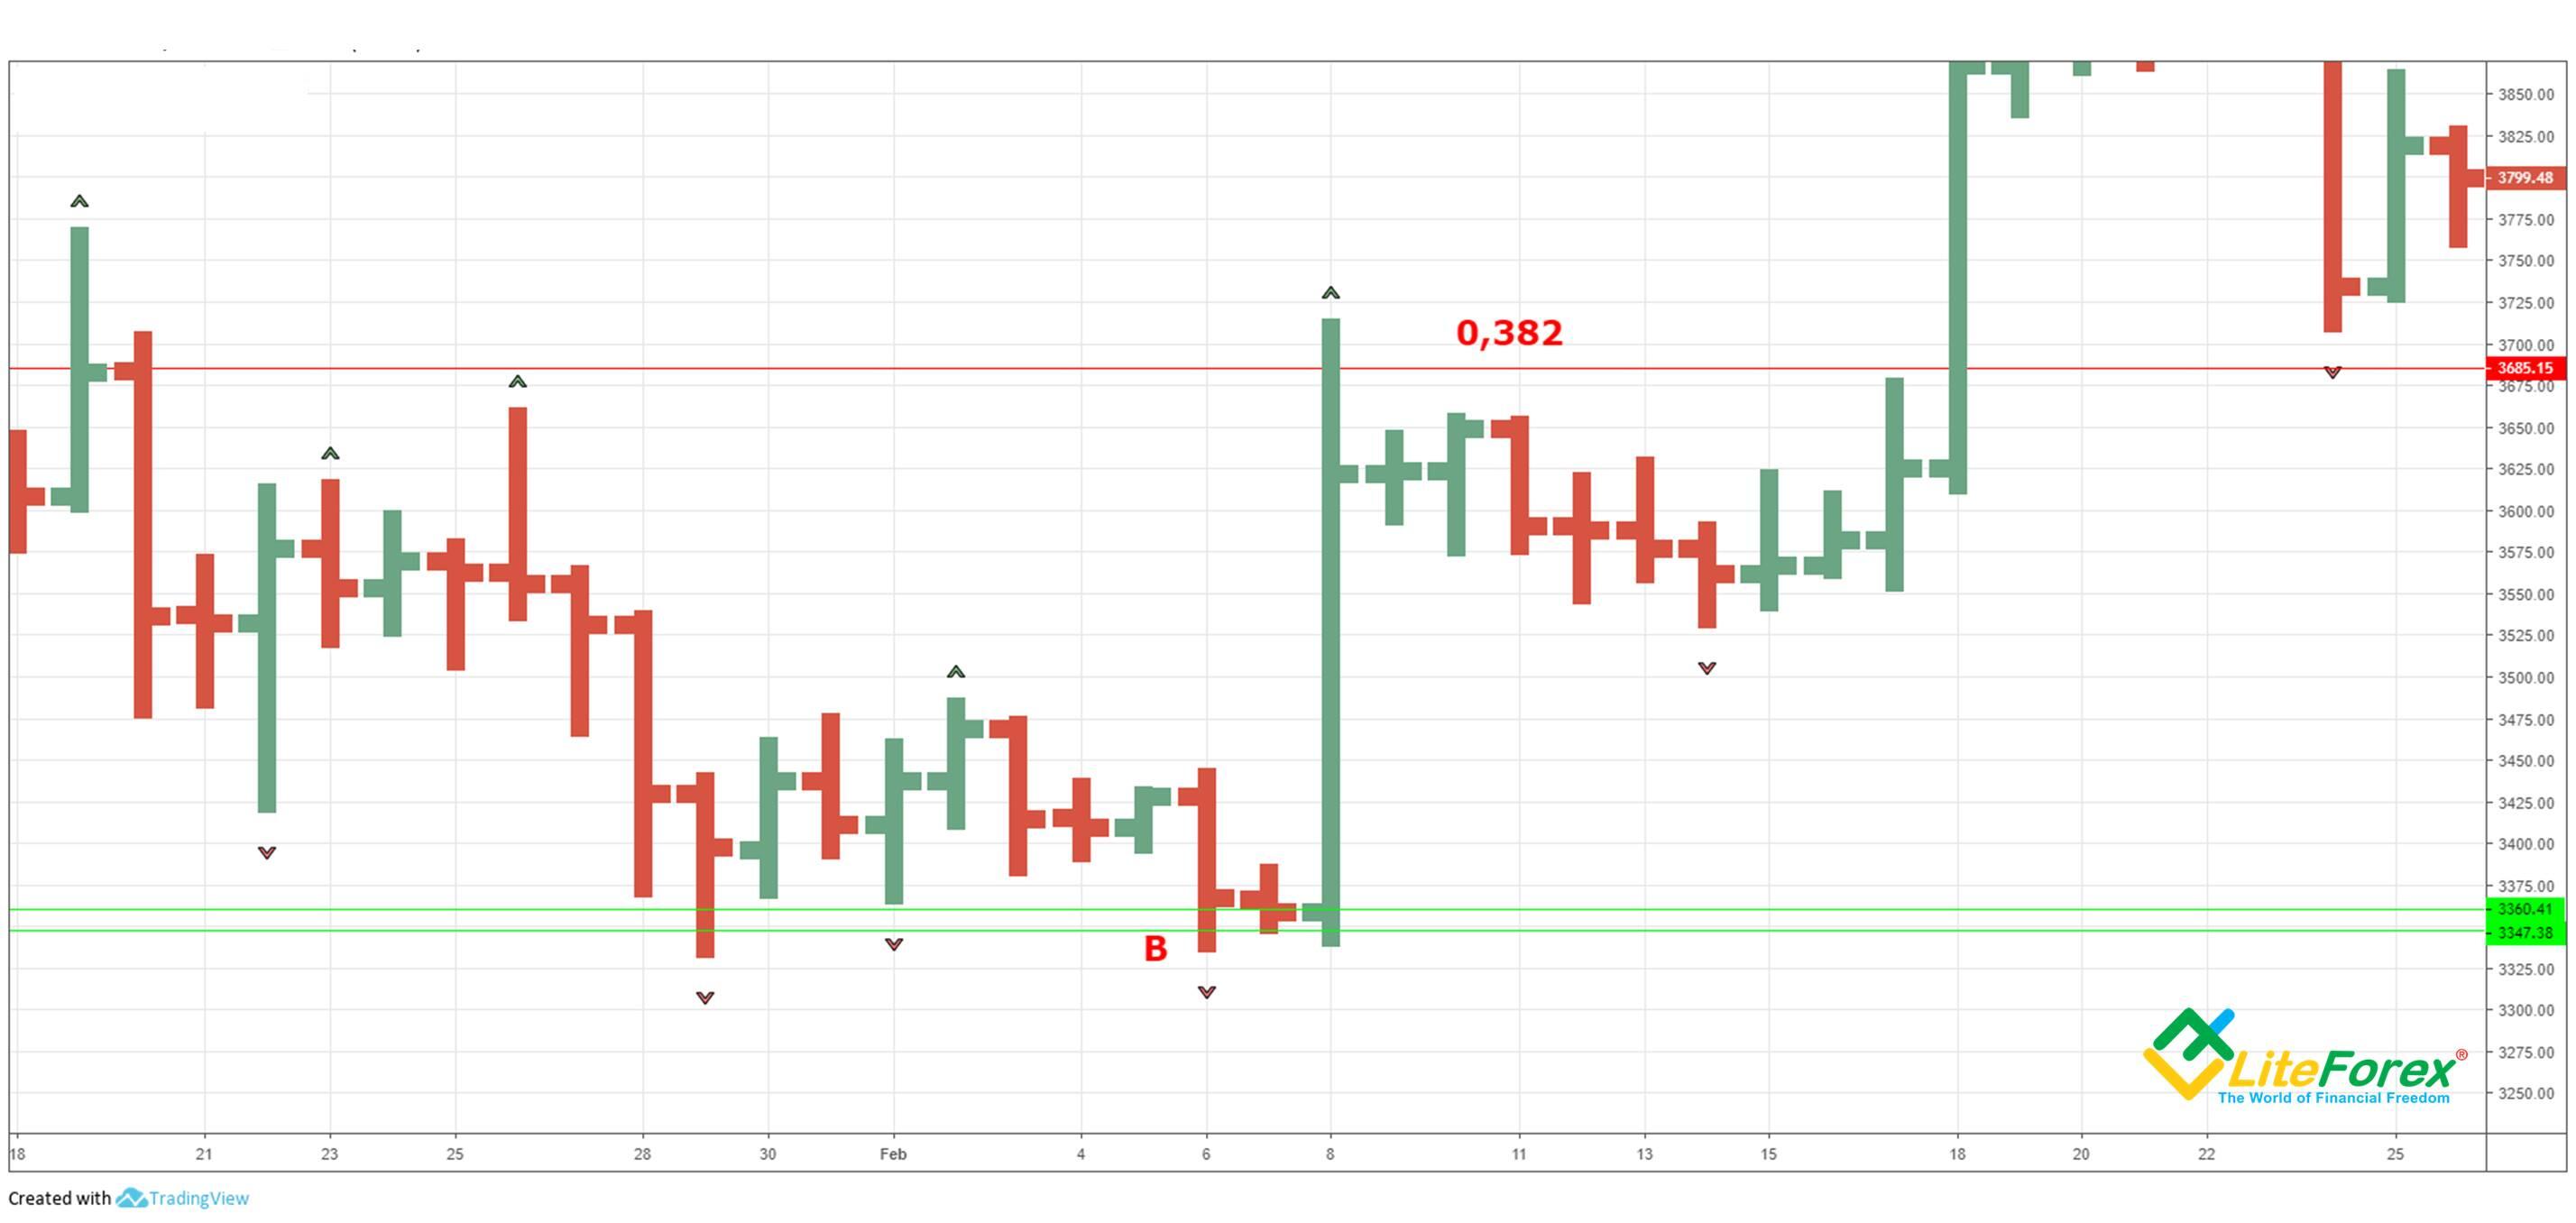
The above chart presents an example of the third qualifier. X-1 close the day before the upside breakout of TD replacement level 0.382 is 3360.41, and its low is 3347.38. If we find their difference and add it to the closing price of X-1, we get the following result:
3360.41+ (3360.41-3347.38) = 3373.44
This is far below the TD retracement level of 0.382, which is located at around 3685.15. Therefore, we can assume the further development of the corrective price movement to the level of 0.618, which was further proven.
The situation is similar when analyzing the expected downside breakout of the TD retracement in an uptrend. To do this, you need to determine the price bar before the downside breakout (X-1) and calculate the difference between the closing price of this bar and the largest of the two following values:
- This bar high or
- Prior bar close (Х-2 close);
Then you need to subtract this value from X-1 closing price and if the result of the calculations is lower than the relative TD retracement level, then the correction will end soon.
If the result of calculations is higher than the level of relative TD retracement, then, the price will continue declining after the TD retracement level breakout.
This qualifier, like the first one, is based on the concept of overbought market. Its implementation indicates an increase in supply compared with the previous days.
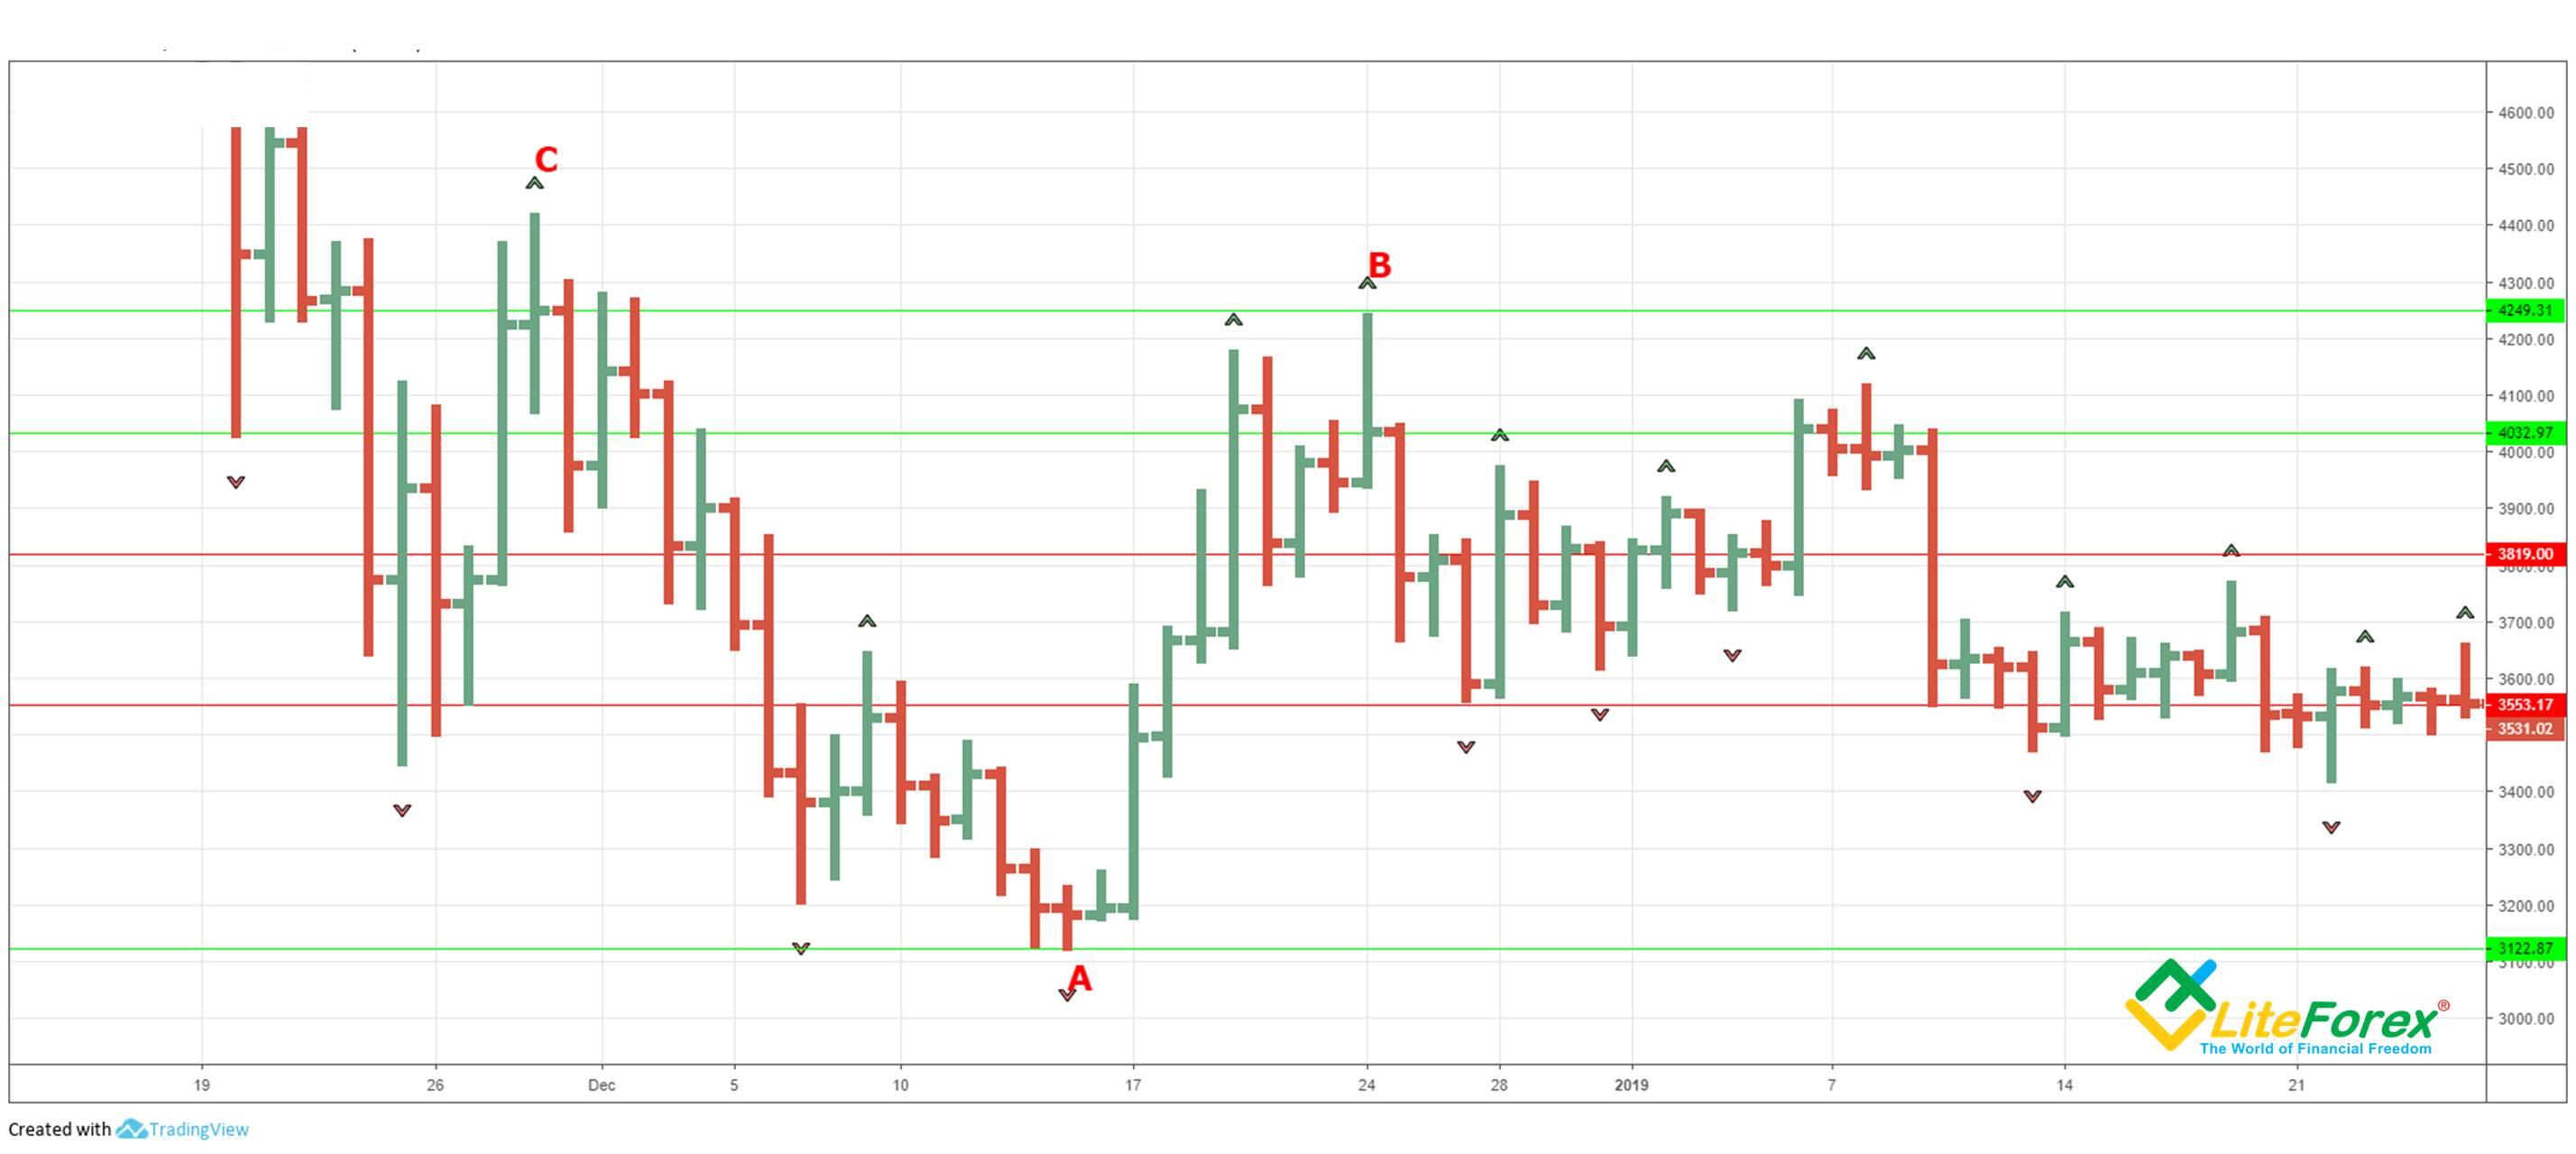
The above chart presents an example of qualifier 3 in an uptrend. X-1 close on the day before the breakout of the TD retracement level of 0.382 is 4032, its high is 4249. If you find their difference and subtract it from X-1 close, you will get the following result:
4032-(4249-4032)=3815
It is a little lower that the TD retracement level of 0.382, which is at 3819, which means a weak corrective movement. You see from the chart that the price, in fact, rebounded from TD retracement level 0.618 (3553 USD in the above chart) and the uptrend resumed.
TD retracement qualifiers work excellently, and you can safely use them in your trading system. However, Thomas DeMark also defined a number of conditions that signal that TD retracement breakouts are false.
Conditions that invalidate an upside breakout of relative TD retracement level
- Condition 1. If the X+1 bar open after a true upside breakout of the TD retracement level is lower than TD retracement level, you should exit the long trade at the opening price of this bar.
- Condition 2. If the X+1 bar open after a true upside breakout of the TD retracement level is lower than the breakout bar X close, and then, X+1 closes lower than TD retracement level, you should exit the long trade at the closing price of this bar.
- Condition 3. If X+1 high after a true upside breakout of the TD retracement level is lower than the breakout bar X highg, exit the long trade at the closing price of X+1.
If any of the following three conditions is met, then the intrabar breakout of the downward TD retracement line is true, and the probability of closing above the relative TD retracement level increases. (It is explained below)
Conditions, validating the downside breakout of the relative TD retracement level
- Condition 1. X-1 close one bar before the intrabar downside breakout of the relative TD retracement level must be higher than X-2 close two bars before the intrabar downside breakout.
- Condition 2. If the first condition is not satisfied, a true breakout can still occur if the market opens lower than the relative TD retracement level and goes on trading one tick lower than the opening level.
- Condition 3. To measure the supply, calculate the difference between X-1 close before the downside breakout of the relative TD retracement level and its true high (or the closing price of the previous bar X-2, if it higher than X-1 high) and subtract this value from the close of the X-1 price bar. The result must be higher than the relative level of TD retracement.
Assuming that the first condition is met, traders can open short positions during the intraday trading session, instead of waiting for a bearish confirmation based on the closing of the breakout bar. The meaning of this condition is that if the market closes higher before the downside breakout, then traders do not expect the price to go down and therefore are not set for it. They can even enter long trades, thereby increasing the likelihood of a subsequent price fall before closing.
The second price condition suggests that the balance of supply and demand shifted in favor of the bears, and that the resumption of sales increased the chances of closing below the lower relative level of TD retracement.
If neither the first nor the second condition is satisfied, one should resort to the third condition, which measures the sales pressure before the relative level of TD retracement. This condition can be used to determine the likelihood that the close will be successfully broken through.
The essence of the third condition is that the demand (sales pressure) at the breakout bar not only exceeded the supply of the previous bar but also has become strong enough to break through the relative level of TD replacement.
Following the rules described above, the Thomas DeMark TD replacement levels allow the traders to calculate the length of the likely corrective movement. In addition, using these levels, you can find signals for exiting the trades in time in case of unexpected trend reversals before other traders notice this. This advantage not only helps you reduce losses, but also allows you to exit counter trades.
Employing TD Sequential or TD Combo, TD-Wave, TD Trend lines and TD Retracement levels, you can already develop a simple but profitable trading system. But that will be explained in the next articles.
Subscribe not to miss the continuation!
I wish you good luck and good profits!
PS. If you agree with my ideas, write “+” in the comments; if you don’t agree, put “-”. If you liked the post, just write thank you, and don’t forget to share the post. It is easy for you and I will be very pleased :)
Stay informed on the latest cryptocurrency news, follow my posts on the blog.
Useful links:
I recommend trying to trade with a reliable broker here. The system allows you to trade by yourself or copy successful traders from all across the globe.
Telegram channel with high-quality analytics, Forex reviews, training articles, and other useful things for traders http://t.me/litefinance.

Price chart of BTCUSD in real time mode
The content of this article reflects the author’s opinion and does not necessarily reflect the official position of LiteFinance broker. The material published on this page is provided for informational purposes only and should not be considered as the provision of investment advice for the purposes of Directive 2014/65/EU.
According to copyright law, this article is considered intellectual property, which includes a prohibition on copying and distributing it without consent.

