


TD Range Projection: Projection of the future bar by DeMark
Dear friends!
I continue describing the collection of Thomas DeMark’s forex indicators.
In my previous articles, I have already explained such tools as
- TD Trend Factor and TD Propulsion (see here).
- TD Retracements (see here).
- TD Lines of demand and supply.
- TD D-Wave (see here).
- TD Sequential and TD Combo (see here).
- TD REI and TD POQ (see here).
- TD DeMarker 1 and 2, TD Pressure, TD ROC, TD Alignment (see here).
- TD Moving Averages (see here).
Today, I am going to deal with another very useful indicator that will help you to make your projections more accurate. Today we formula, conditions of application, properties, signals, theory and practice of application.
- The TD Range Projection is an indicator used to project and predict the next bar's high and low values (range). The calculation of the range or the high and low values of the next bar depends on the value of the open and close prices for the most recent bar.
TD Range Projection indicator
This indicator compares the current bar’s close with the opening price, high and low. This analysis is used to project the high and the low of the next bar in any market and in any timeframe. However, Thomas DeMark himself recommends applying this indicator to the analysis of the market situation on the daily charts.
When we compare the close of the most recent bar with its open, there can be fulfilled one of the three conditions:
- Close of the most recent bar is greater than the open.
- Close is less than the open.
- Close of the most recent bar is equal to the open.
The projected low and high are defined in the following way: first, you calculate the X parameter. For the three options, described above, there are the following formulas:
- If the first condition is met, then X = (2 * Current High + Current Low + Current Close)/2
- If there is the second case, then X = (Current High + 2 * Current Low + Current Close)/2
- If the third condition is met, then (Current High + Current Low +2 * Current Close)/2
Next, to calculate the projected high, we subtract the current low from X; to calculate the low, we subtract the current high from X.
I will as usual describe the example of the application of the indicator using the BTCUSD market.
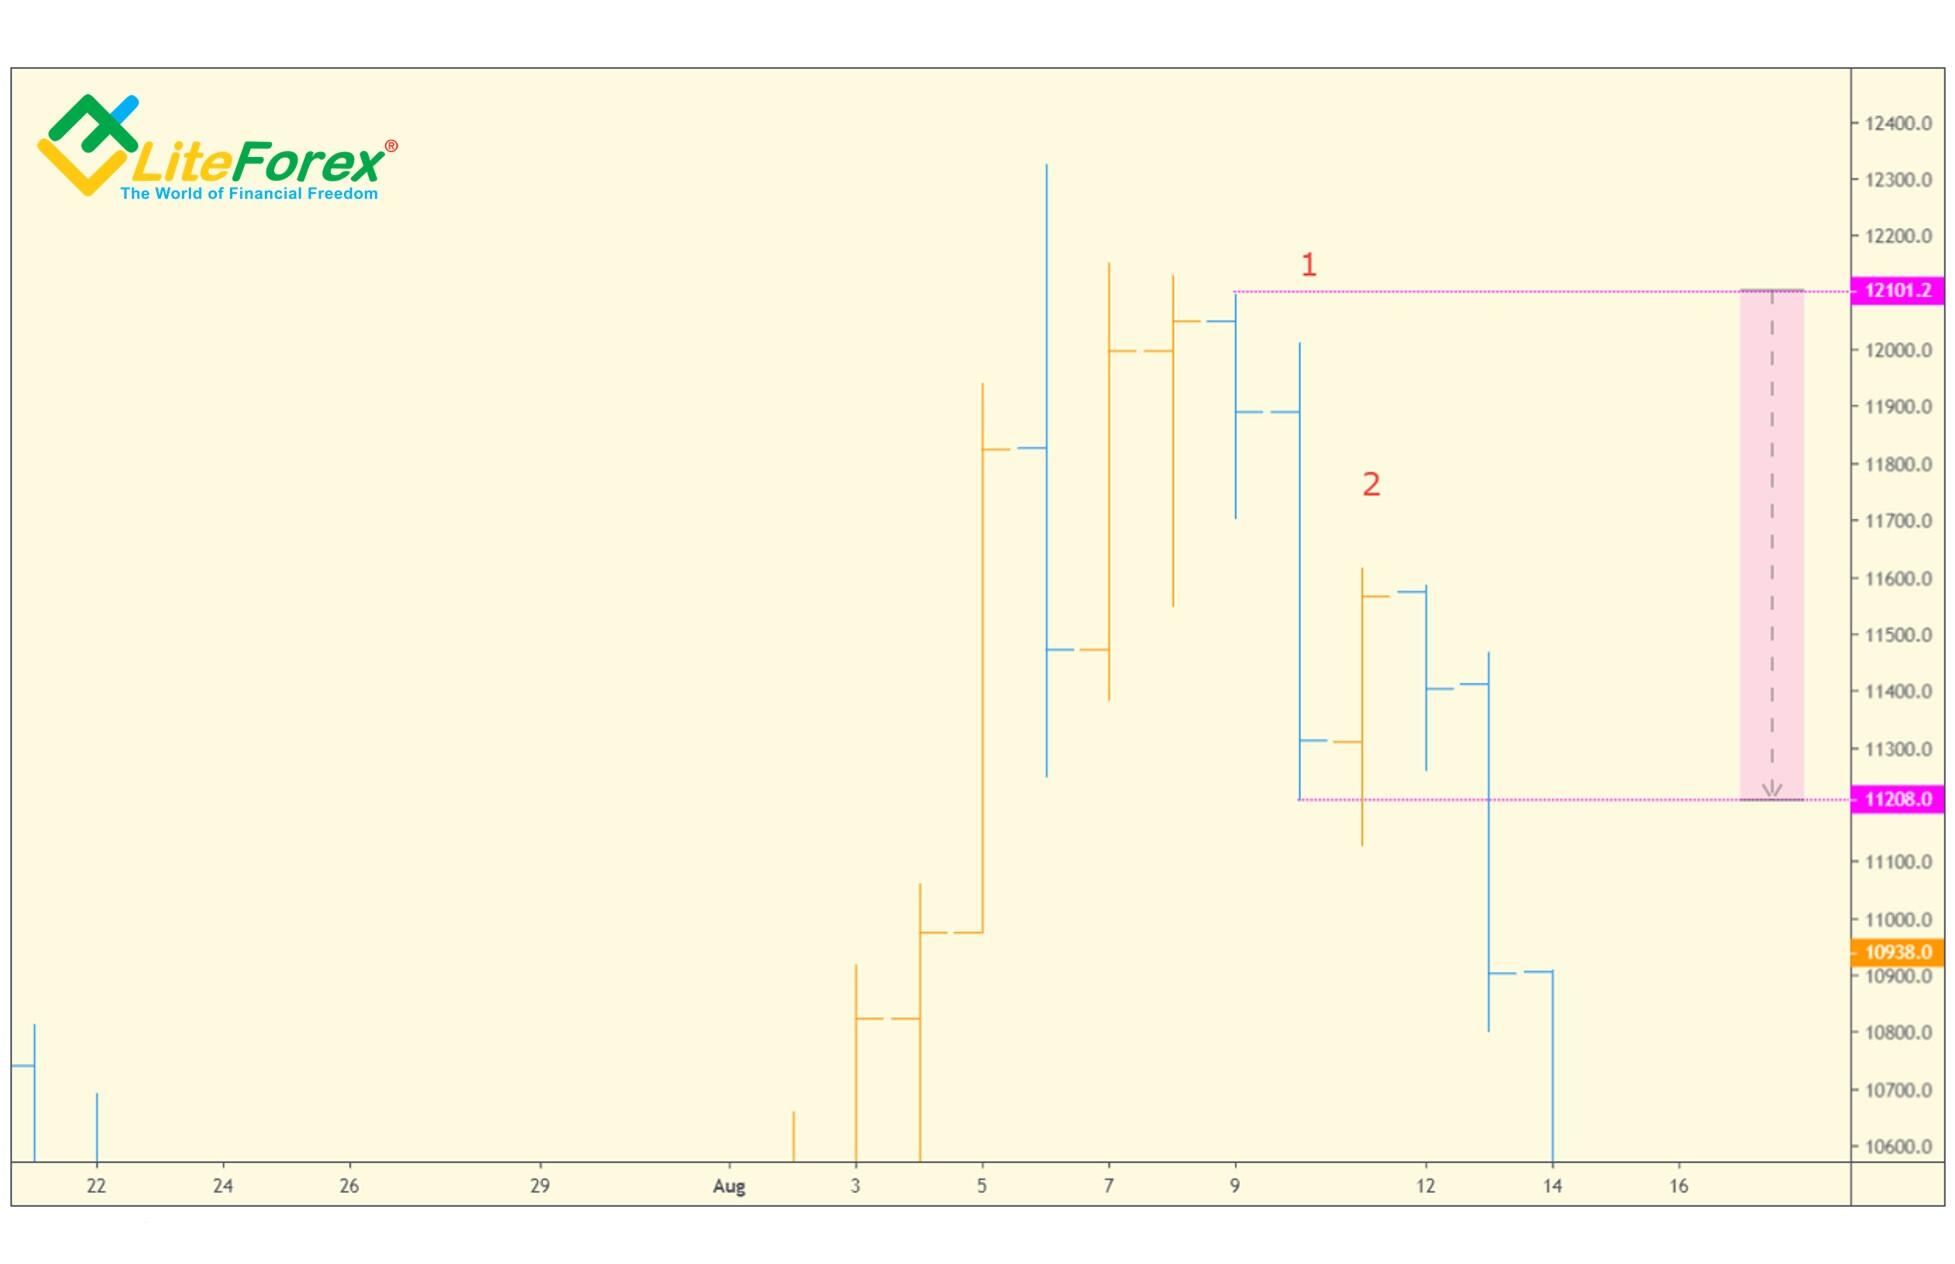
On the example of the given chart, I will try to calculate the lows for bar number 2. To do it, we take the high of the most recent bar number 1 at 11989 USD, its low at11146 USD, and its close at 11 269 USD. As the current close is less than its open, we will use the second condition from the list:
X = (11989 + 2х11146 + 11269)/2=22775
Correspondingly, the projected low and high will be:
Min = 22775 – 11989 = 10786;
Max = 22775 – 11146 = 11629.
The figure above clearly shows that the price of the next day (bar number 2) is in the range of values between the calculated low and high. But, as you might have guessed, this does not always so.
The market often opens below the projected low or above the high. Such case should not be treated as a failure of the forecast. This only means that the market was affected by the fundamental factors. In addition, such a situation is beneficial for the trader, because from the originally low or high value, the price will tend to the projected range in the short term. One may make quite a good profit from this.
To increase the accuracy of projections, Thomas DeMark introduced the concept of the Upside and the Downside TD Tolerance levels.
The TD Tolerance Upside level is calculated by multiplying the previous bar’s true range by 15% and adding it to the current open.
Similarly, the Downside TD Tolerance level is defined by multiplying the previous bar’s true range by 15% and subtracting it to from current open.
To understand how these levels are calculated, one needs first to understand what a true price range is. As you know, the price range is the difference between the price high and low during the same bar, therefore, a true range is the difference between the true high and the true low.
According to Thomas DeMark, a true high should be greater than the close two bars earlier.
And the true price low should be less than the close two bars earlier.
Therefore, if these conditions are not satisfied, then, for calculation, you consider the next bars on the left, for which this condition is true.
Now, knowing how to find out the true range, we can calculate the TD Tolerance levels. As I said before, they will help you to make your forecast more accurate.
To do this, you use one of the four rules, listed below, which is met on one condition, the projected bar must open at the range, calculated by the TD Range Projection.
- If price opens within the range and moves below the DownsideTD Tolerance Level before reaching the Range high, then it is likely to close in the range.
- If price opens within the range and moves above the UpsideTD Tolerance Level before reaching the range low, it is likely to close in the range.
- If the price reaches the Range high before reaching the Downside TD Tolerance Level, it is likely to close above the high indicated by the TD Range Projection.
- If the price reaches the Range low predicted by the TD Range Projection before reaching the Upside TD Tolerance level of the projected high, it is likely to close below the current low of TD Range Projection.
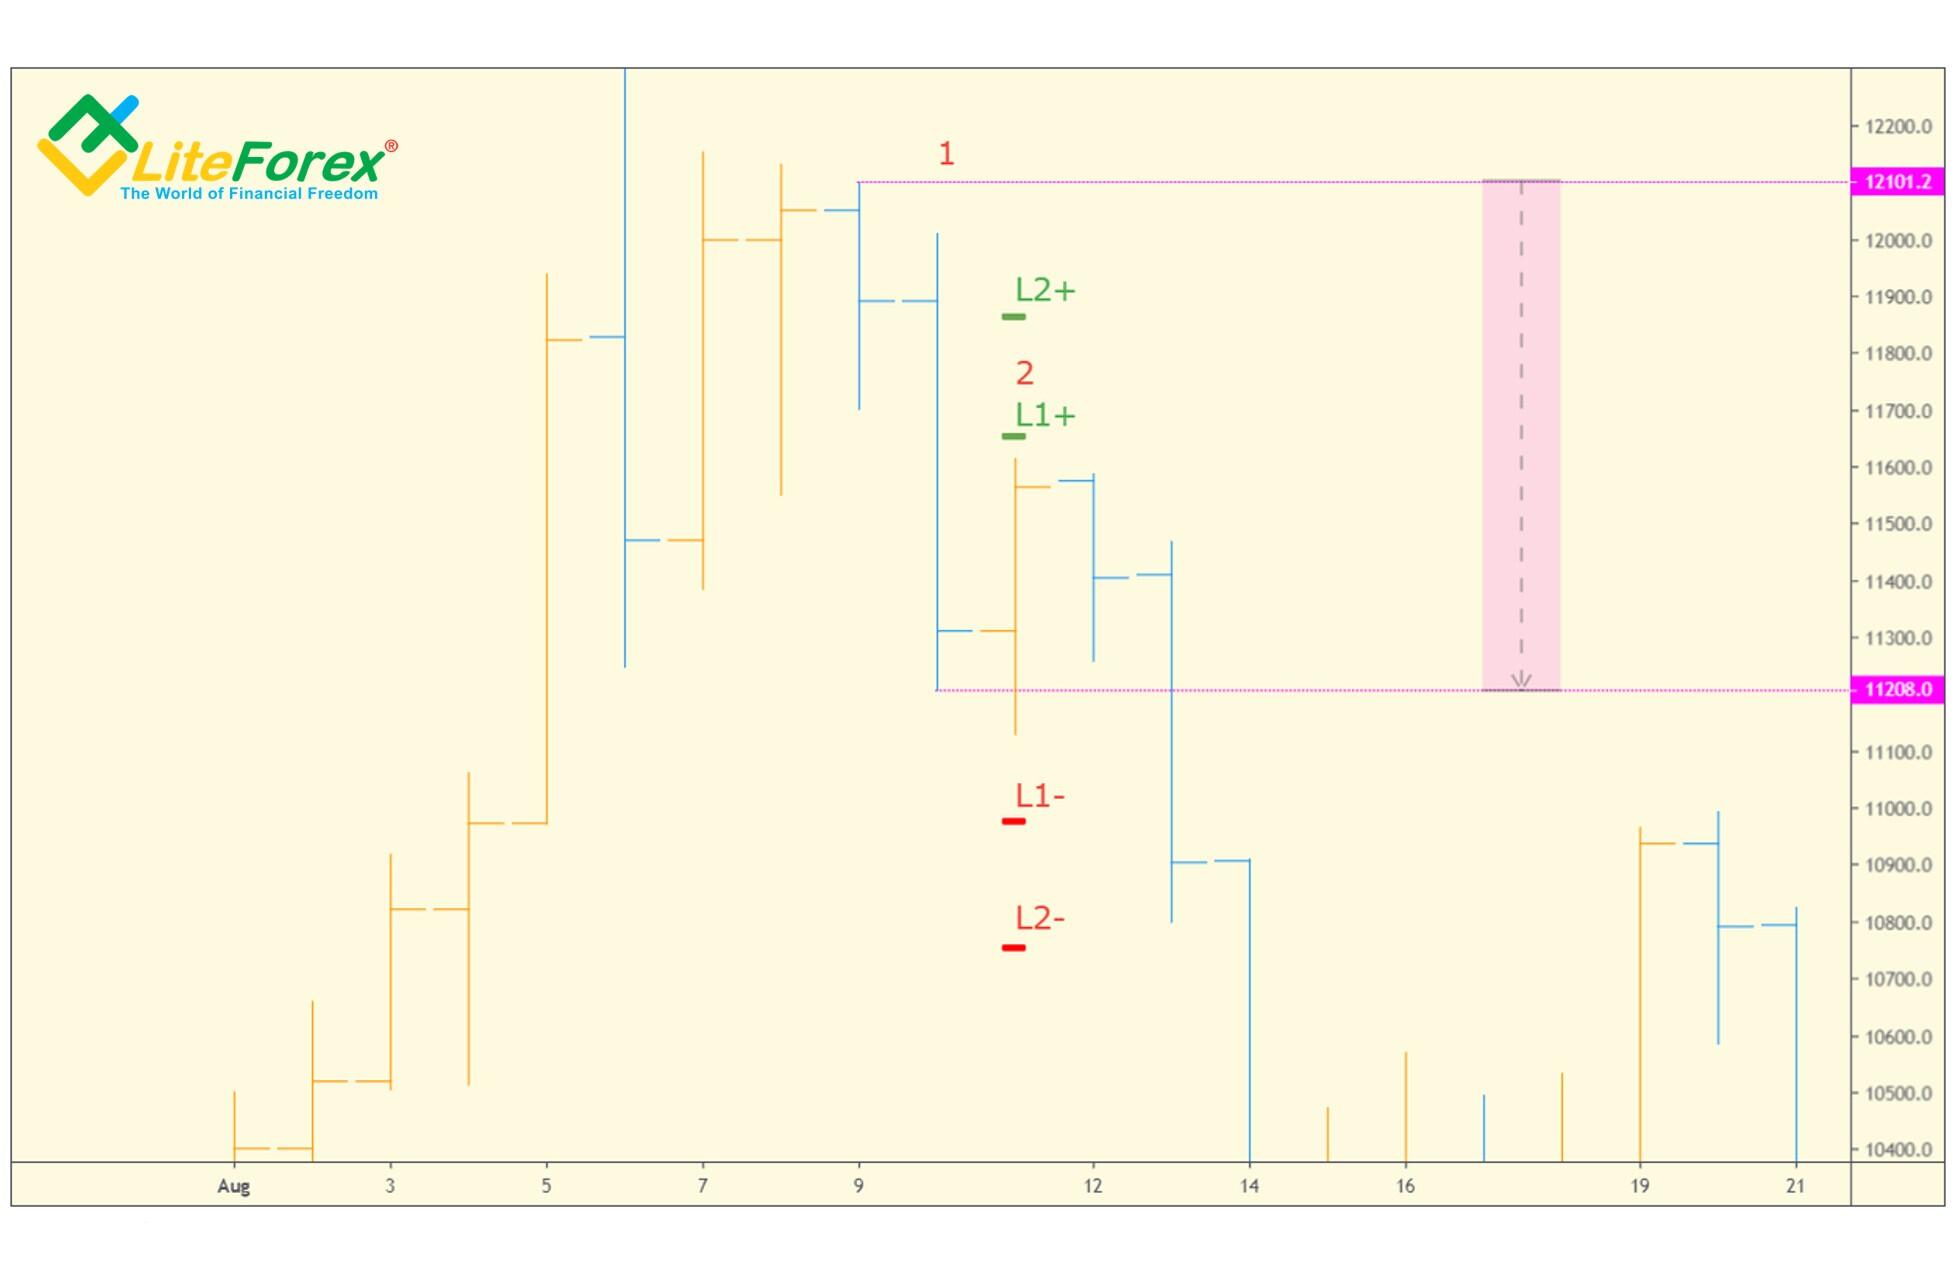
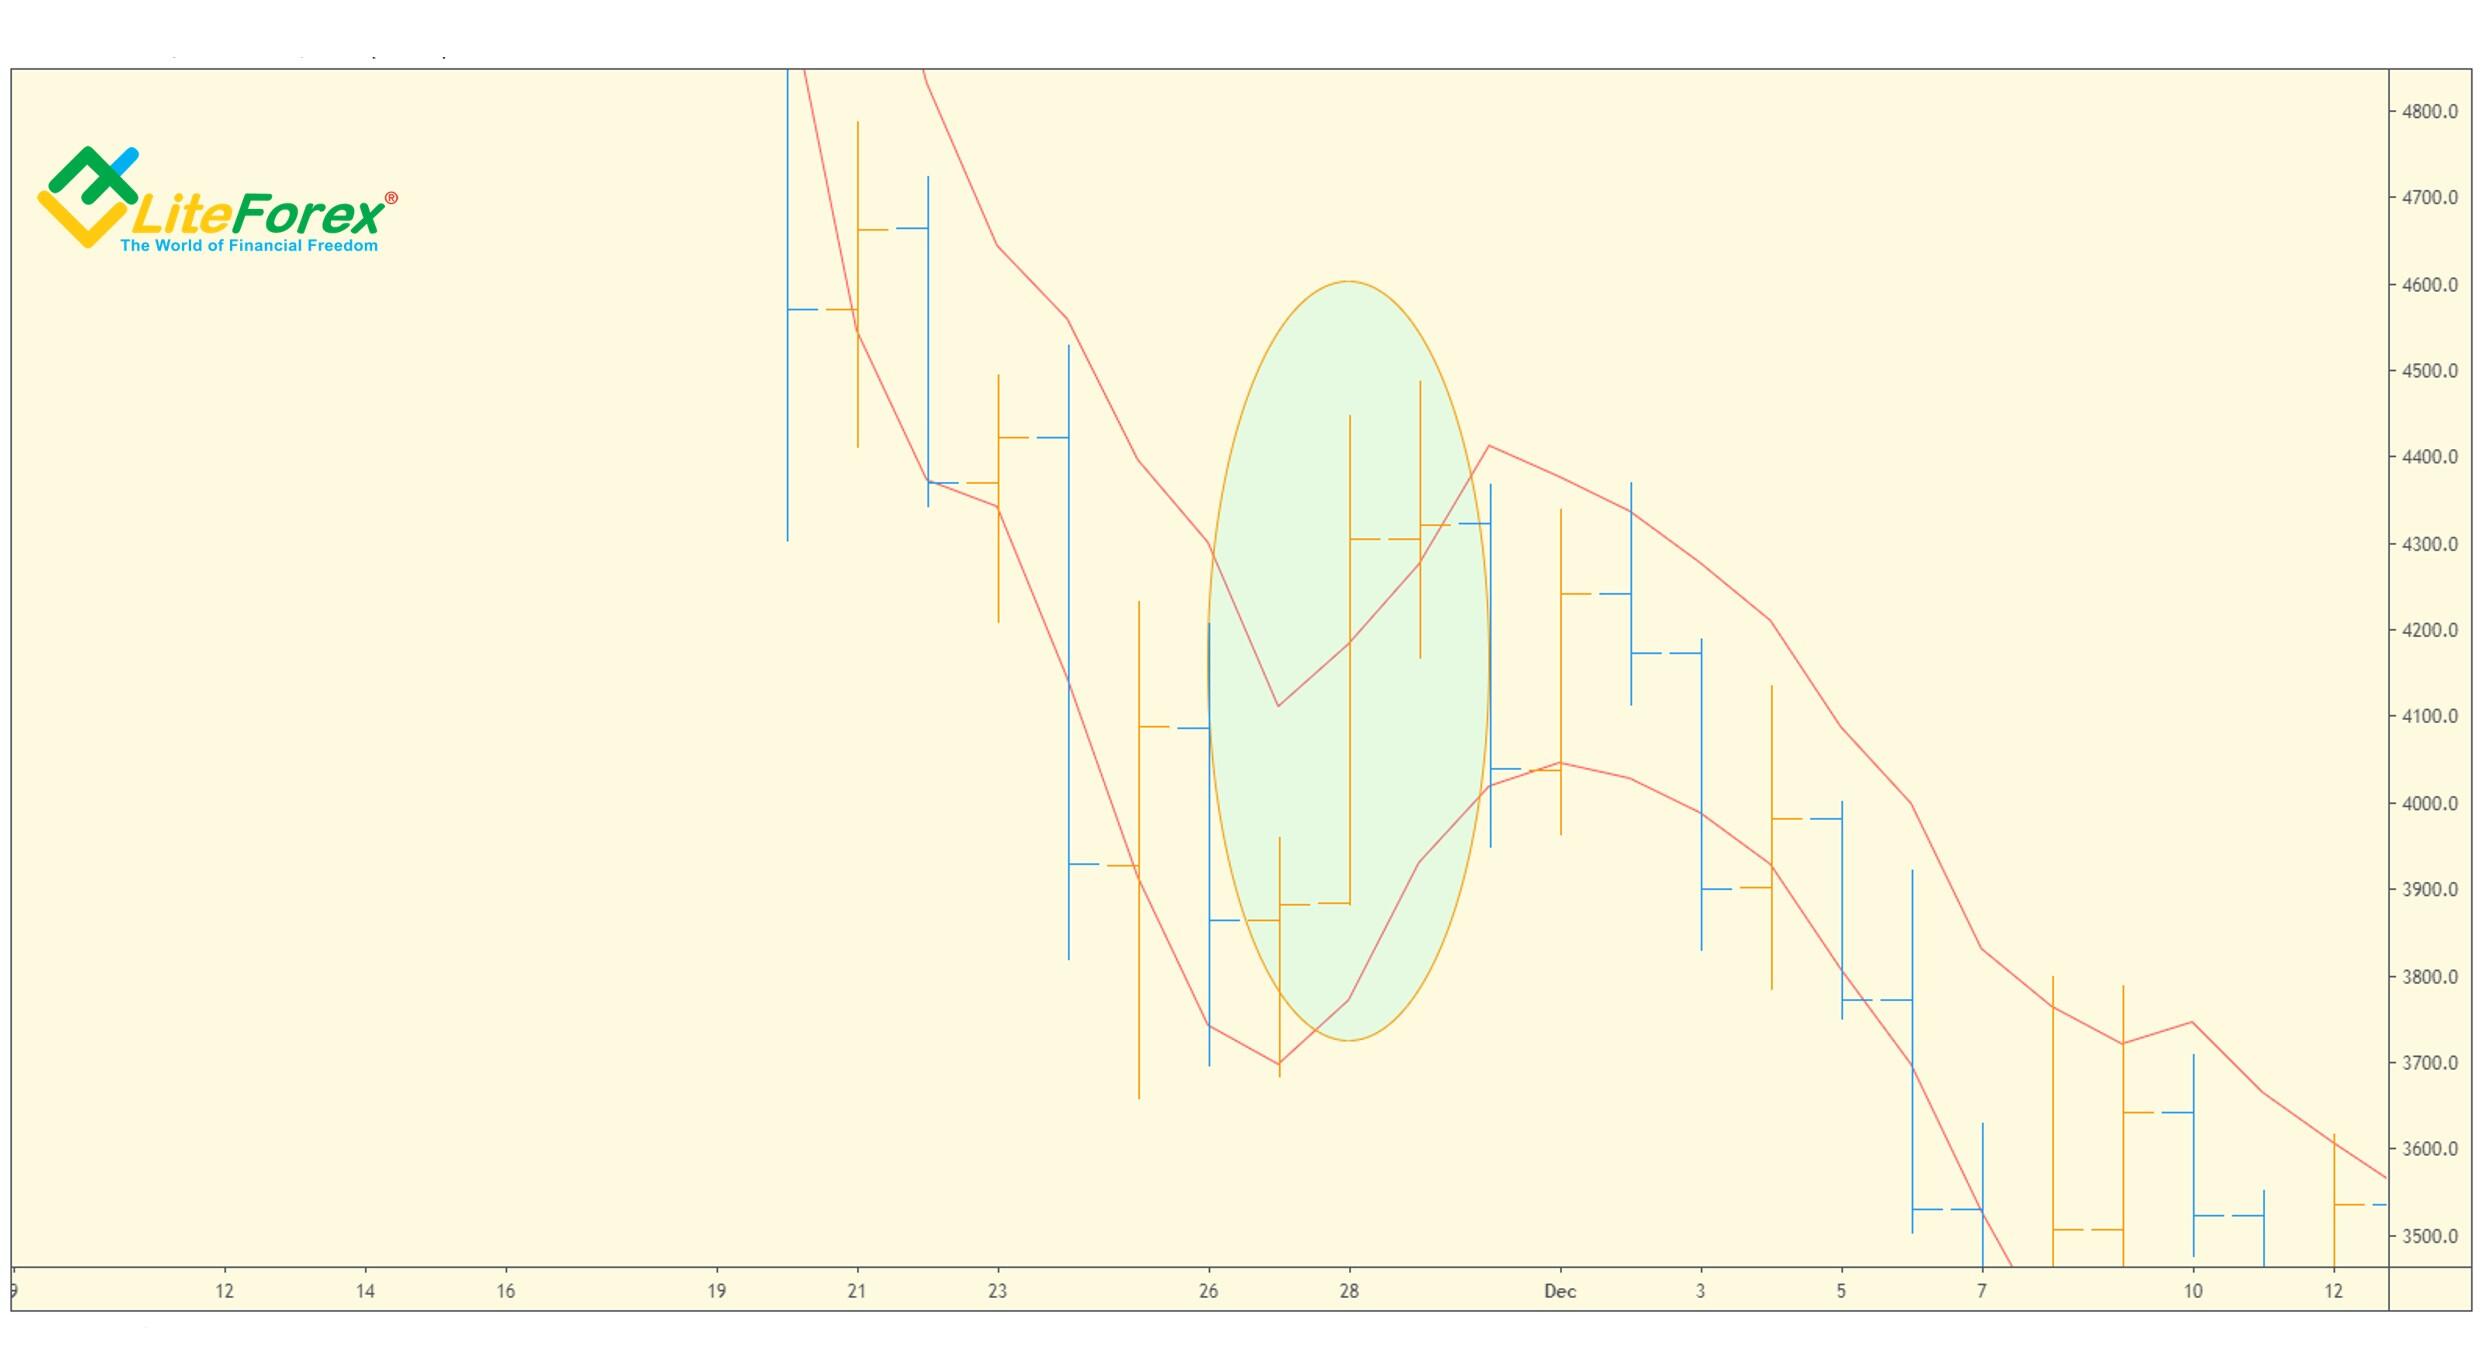
As an example, I will explain the case that was described at the beginning of the article. We have already defined the TD Range Projection for bar 2 (gray zone). The next step is to identify the next true range for bar 1.
The condition of the true low is met by the current low at 11208, the condition of the true high is met by the previous high at about 12101.2.
So, the true range of bar 1 is the difference between these two values = $12101.2 – $11208 = $897.2 (it is highlighted purple in the above chart).
Now, we can calculate the Upside and the Downside TD Tolerance levels:
First, 897.2 USD* 15% = 134.58 USD.
This value is added to the open level of bar №2 to calculate the Upside TD Tolerance Level, and it is subtracted from the open level of bar №2 to calculate the Downside TD Tolerance Level.
Therefore, we get the following levels:
Upside TD Tolerance Level = 11311 USD + 134.58 USD = 11455.58 USD
Downside TD Tolerance Level = 11311 USD — 134.58 USD = 11176.42 USD
All the defined ranges are marked in the above chart.
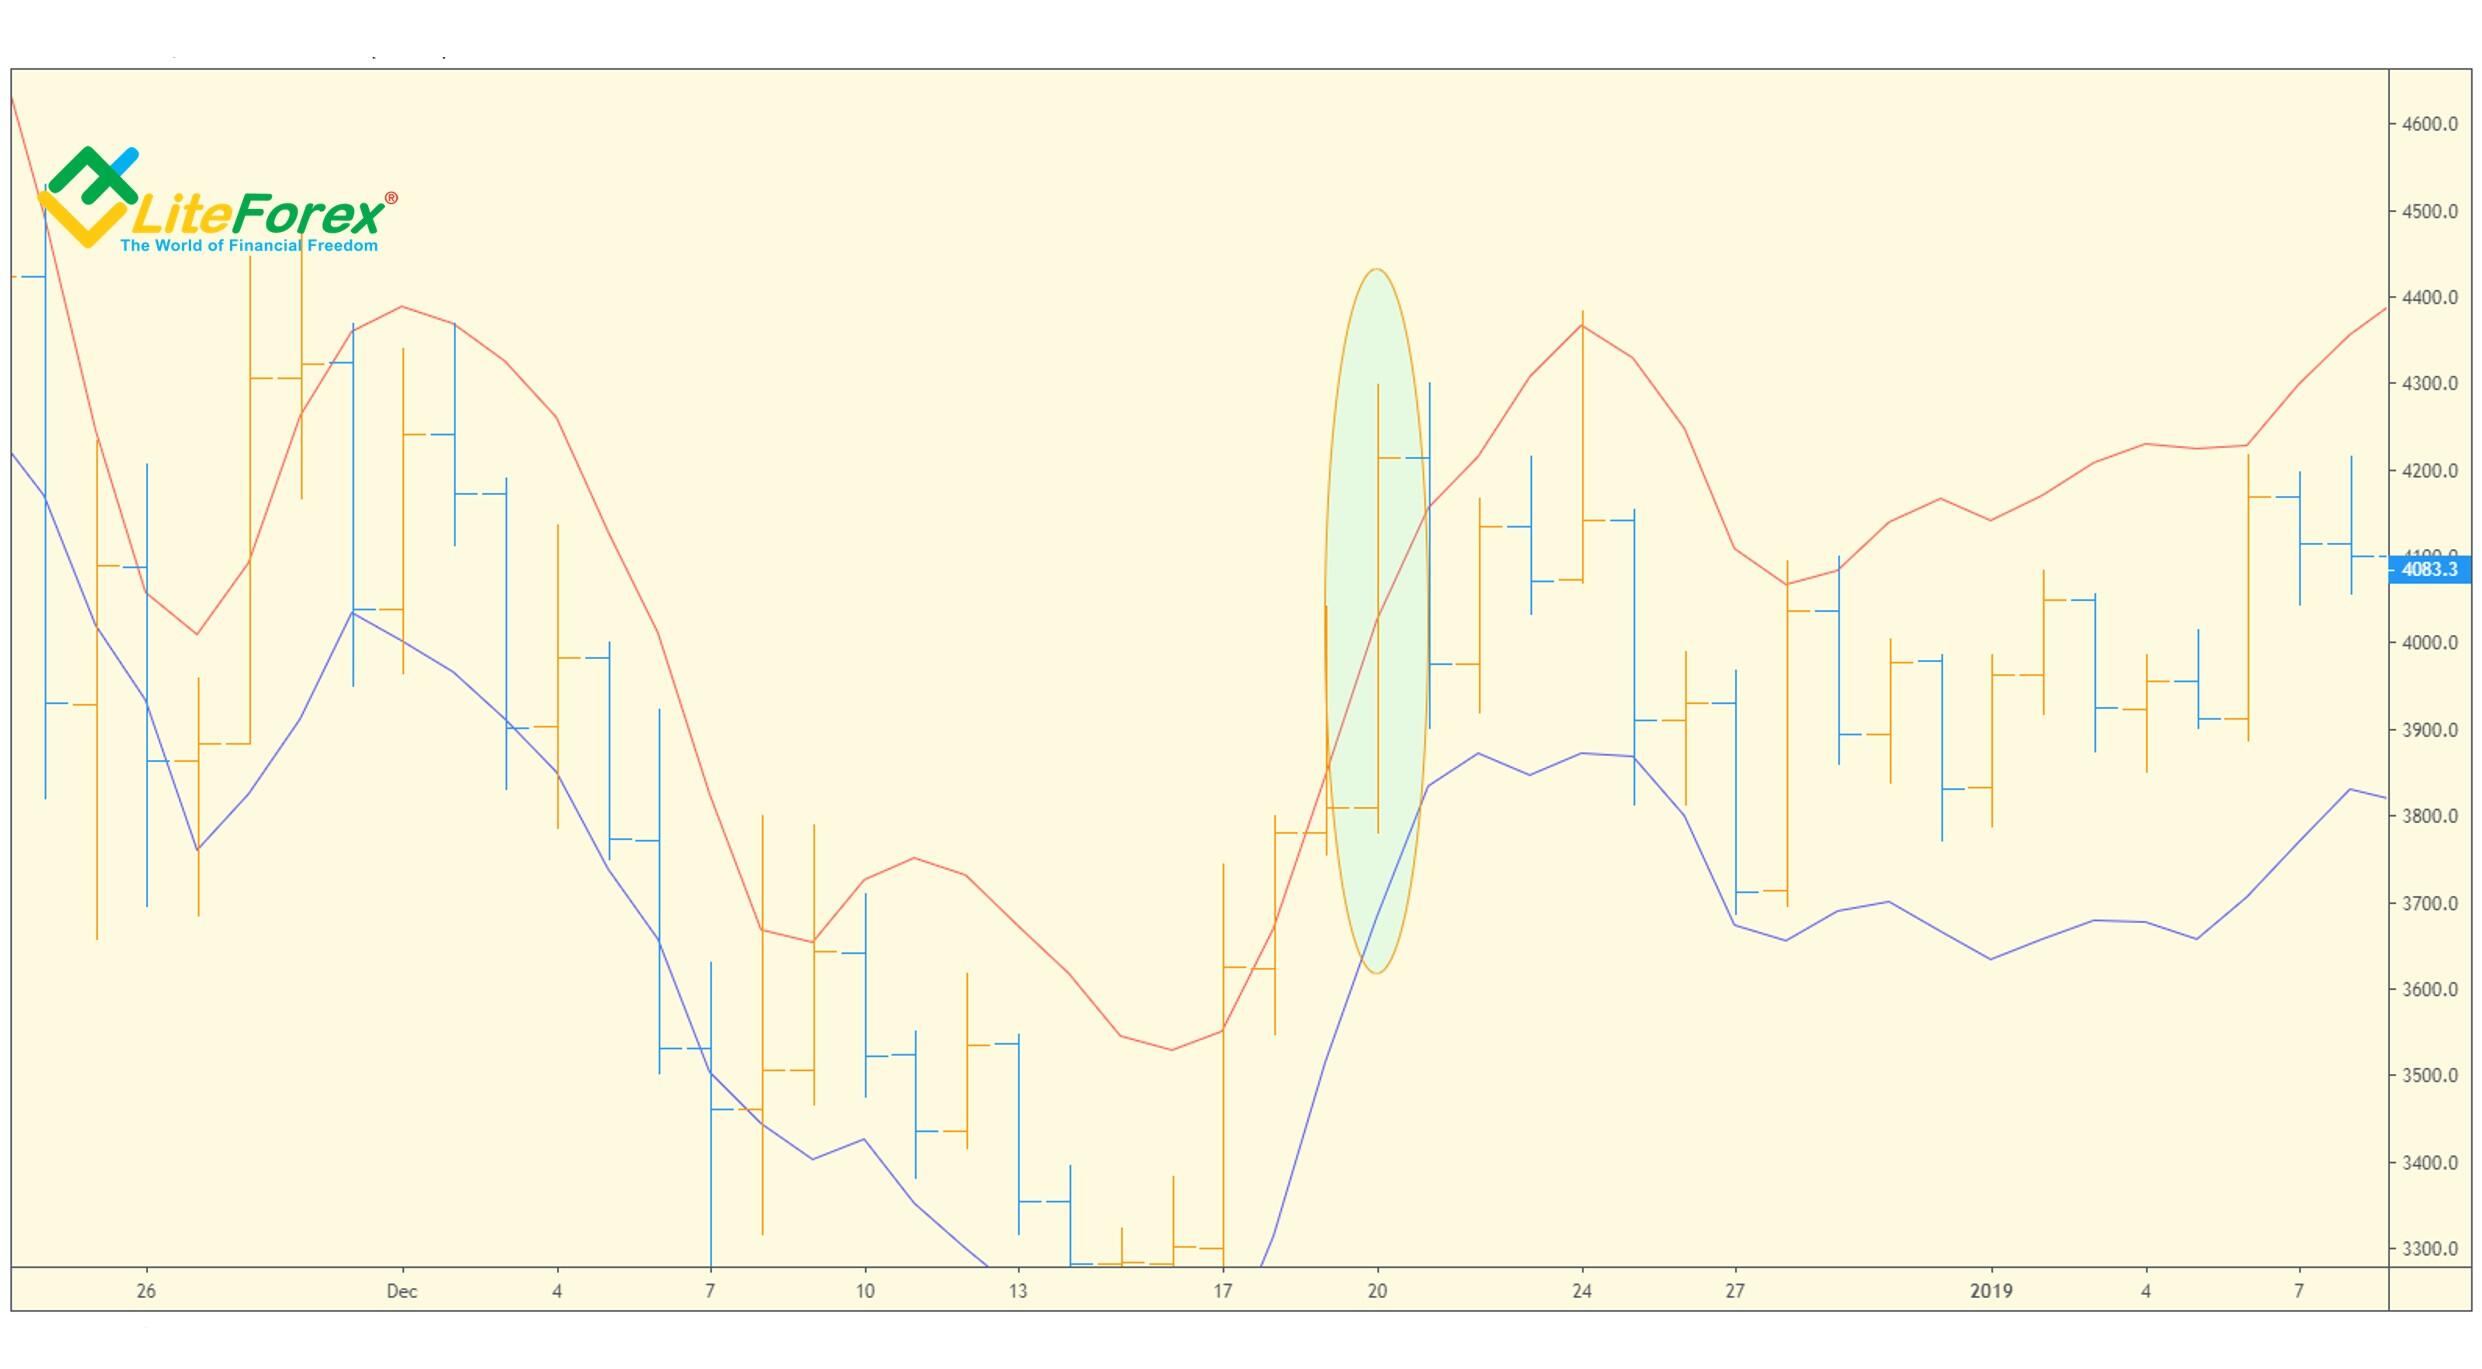
Next, to correctly analyze how the price worked out the TD Tolerance levels, we need to switch from the daily timeframe to the hourly one.
You see from the above chart, that the price broke through the downside level of the TD Tolerance, so conditions 2 and 3 are not met, and conditions 1 and 4 are relevant.
So, when day trading on August 11, we see that, in case of an upward correction, the price will hardly move higher than the high at 11629 indicated by the TD Range Projection. Therefore, when the price is moving close to this level, we can take the profit and enter a short trade, provided that there is a corresponding signal.
It is clear from the above chart that the price has basically worked out this scenario.
In general, as you see from the given example, the analysis of the TD Range Projection on the daily timeframe is rather suitable for day traders.
I, personally, as a trader, prefer middle-term and long-term trading strategies, so, I suggest using this indicator in weekly and monthly timeframes.
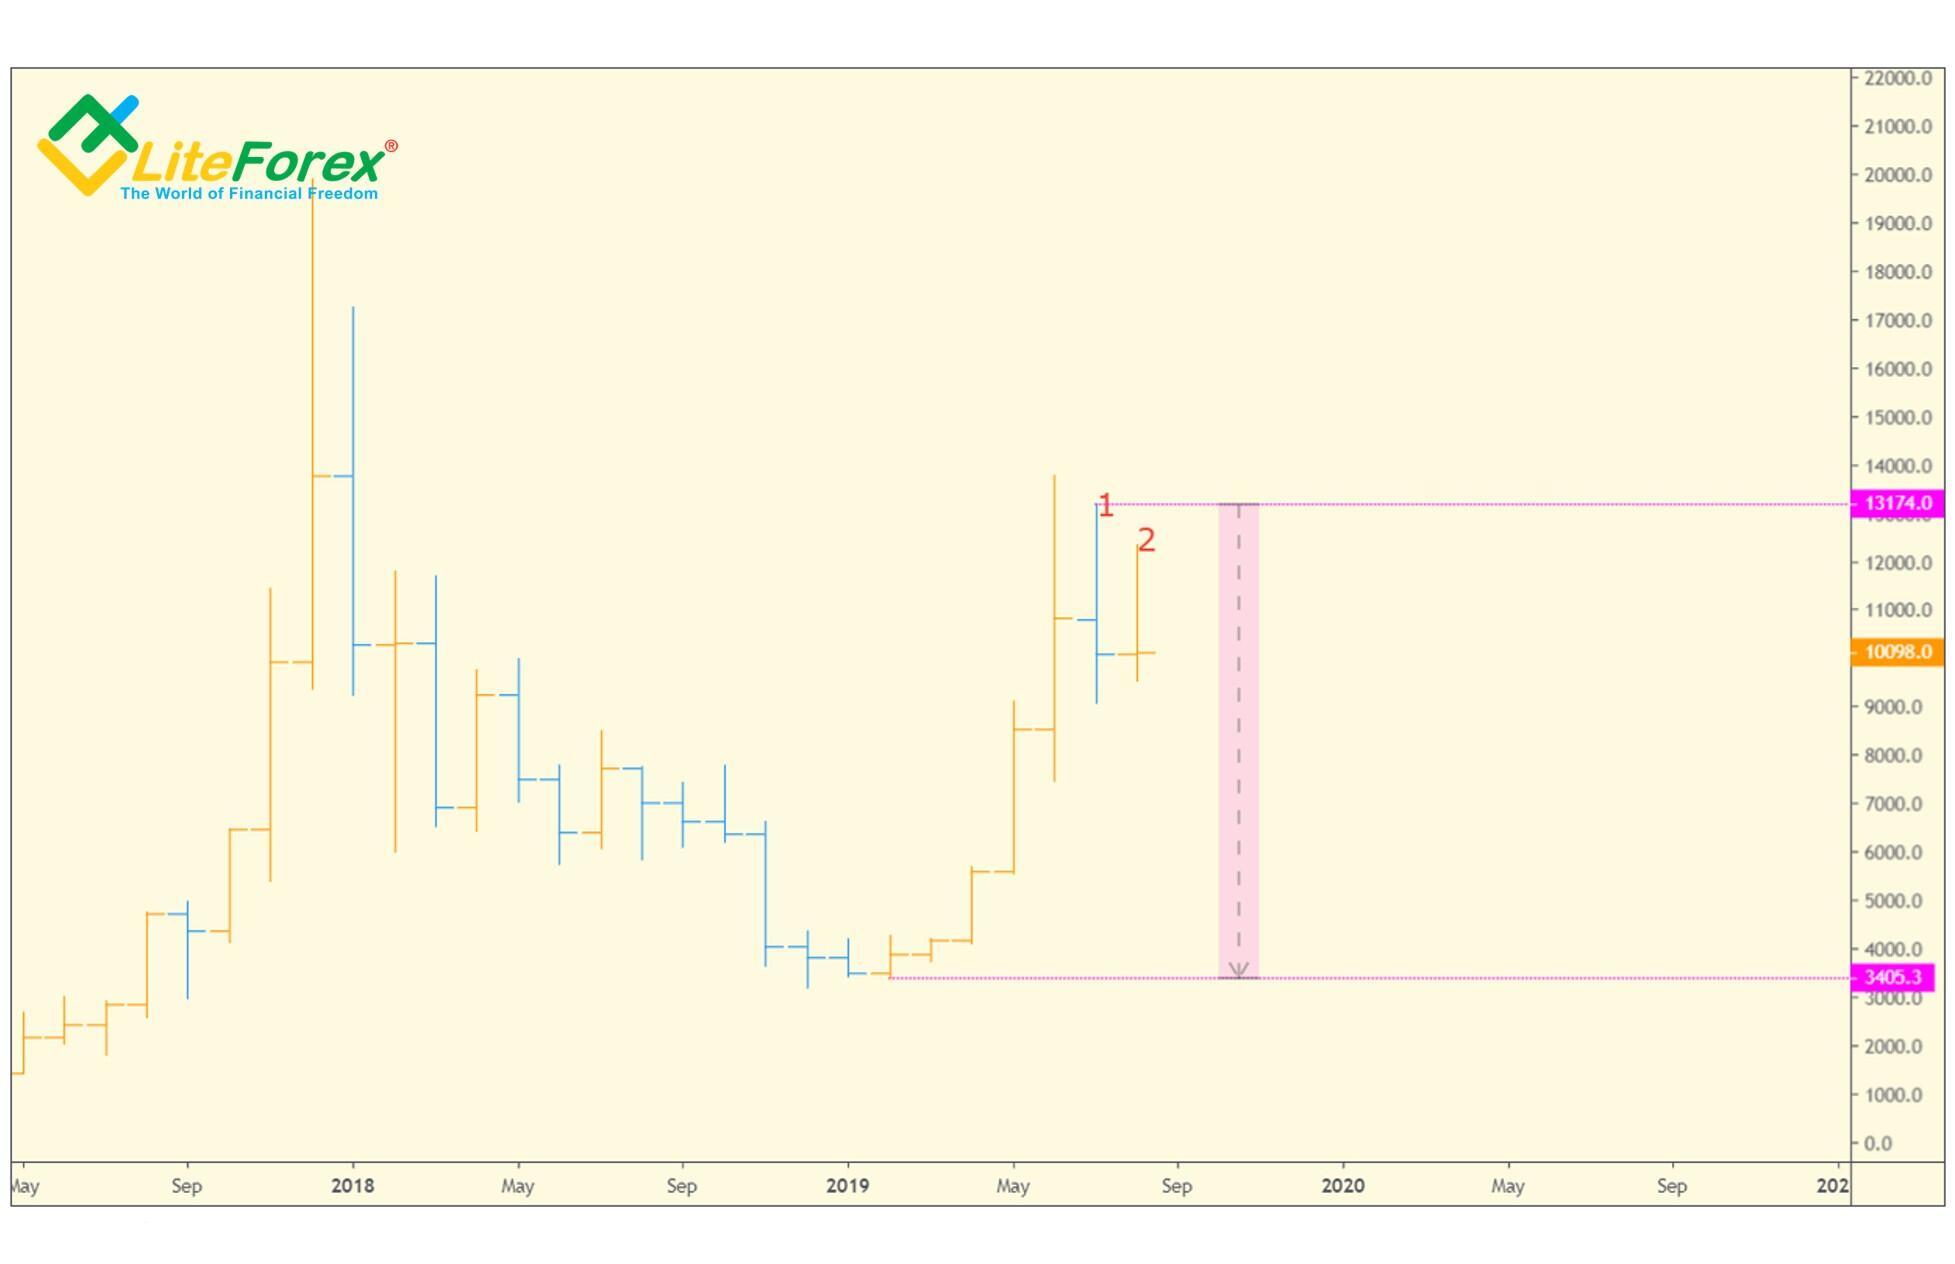
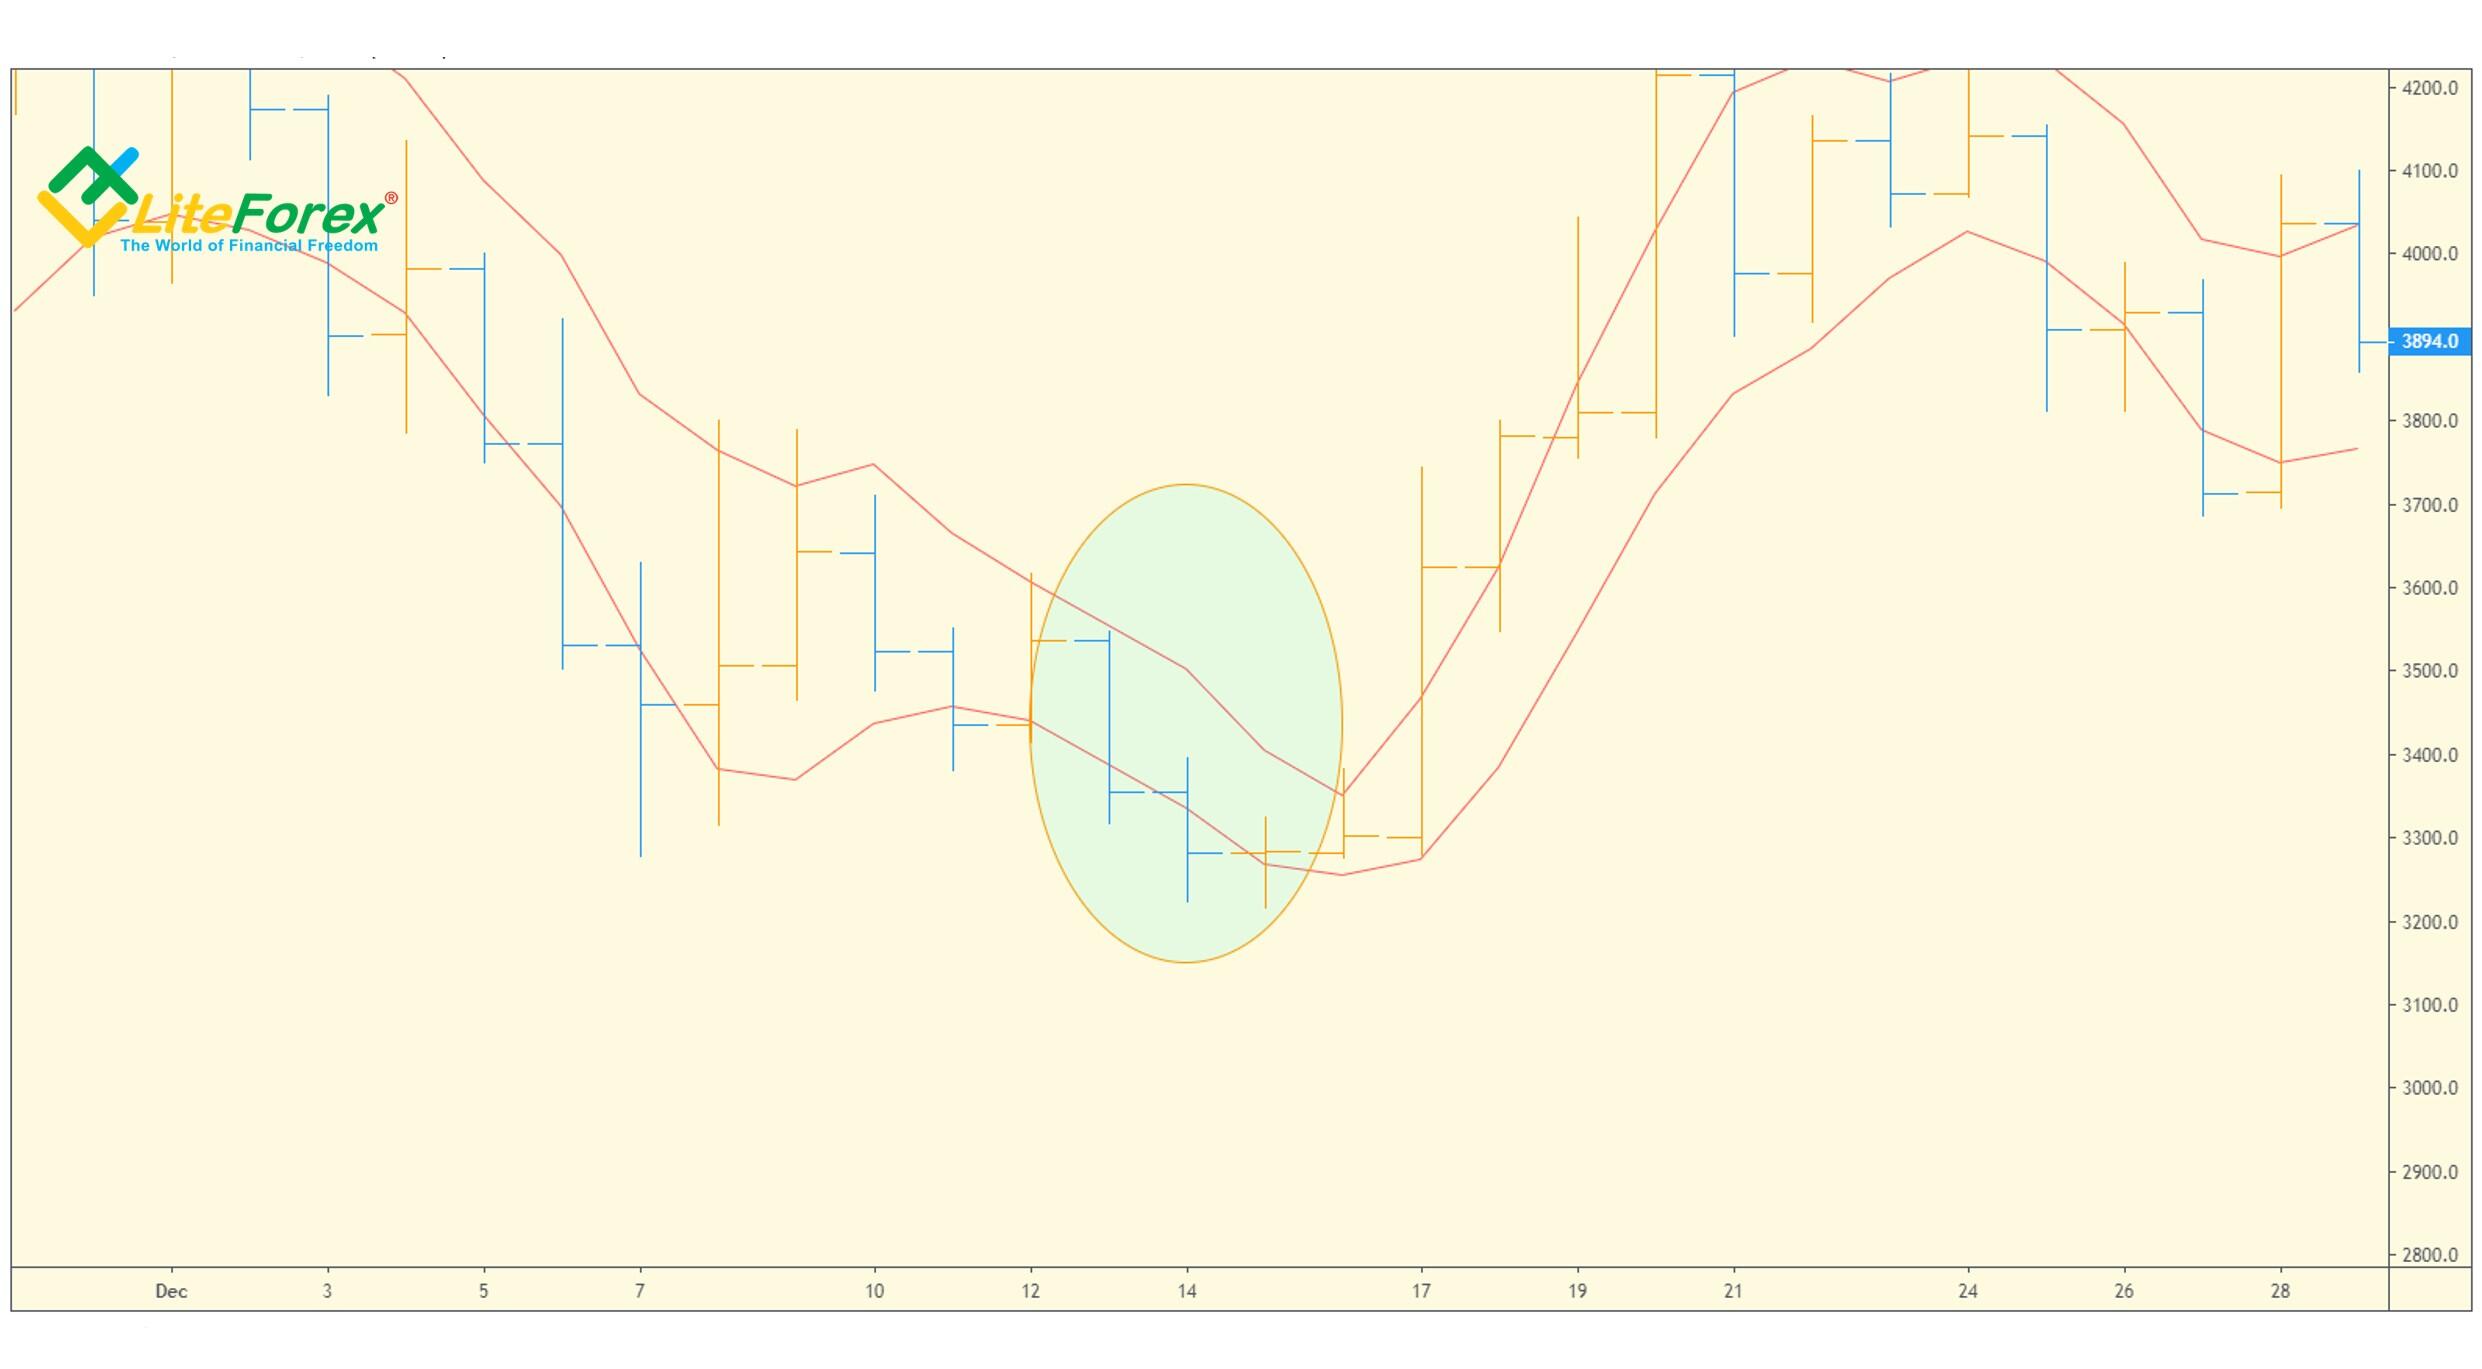
As an example, let us analyze the situation with the TD Range Projection and TD Tolerance on the BTCUSD monthly timeframe for the current bar number 2 (see the figure above).
Step 1. Define the TD Range Projection for bar №2
You see that bar №1 closed below its opening price, and so, the relevant relationship in this case is the condition 2, where X = (Current High + 2 * Current Low + Current Close)/2.
Therefore, you analyze the July bar and calculate:
High: 13174 USD
Low: 9084.7 USD
Close: 10088 USD
So, X = (13174 + 2x9084.7 + 10088)/2 = 20751.7
TD Range Projection Max = 20751.7 – 9084.7 = 11631 USD
TD Range Projection Min = 20751.7 – 13174 = 7541.7 USD
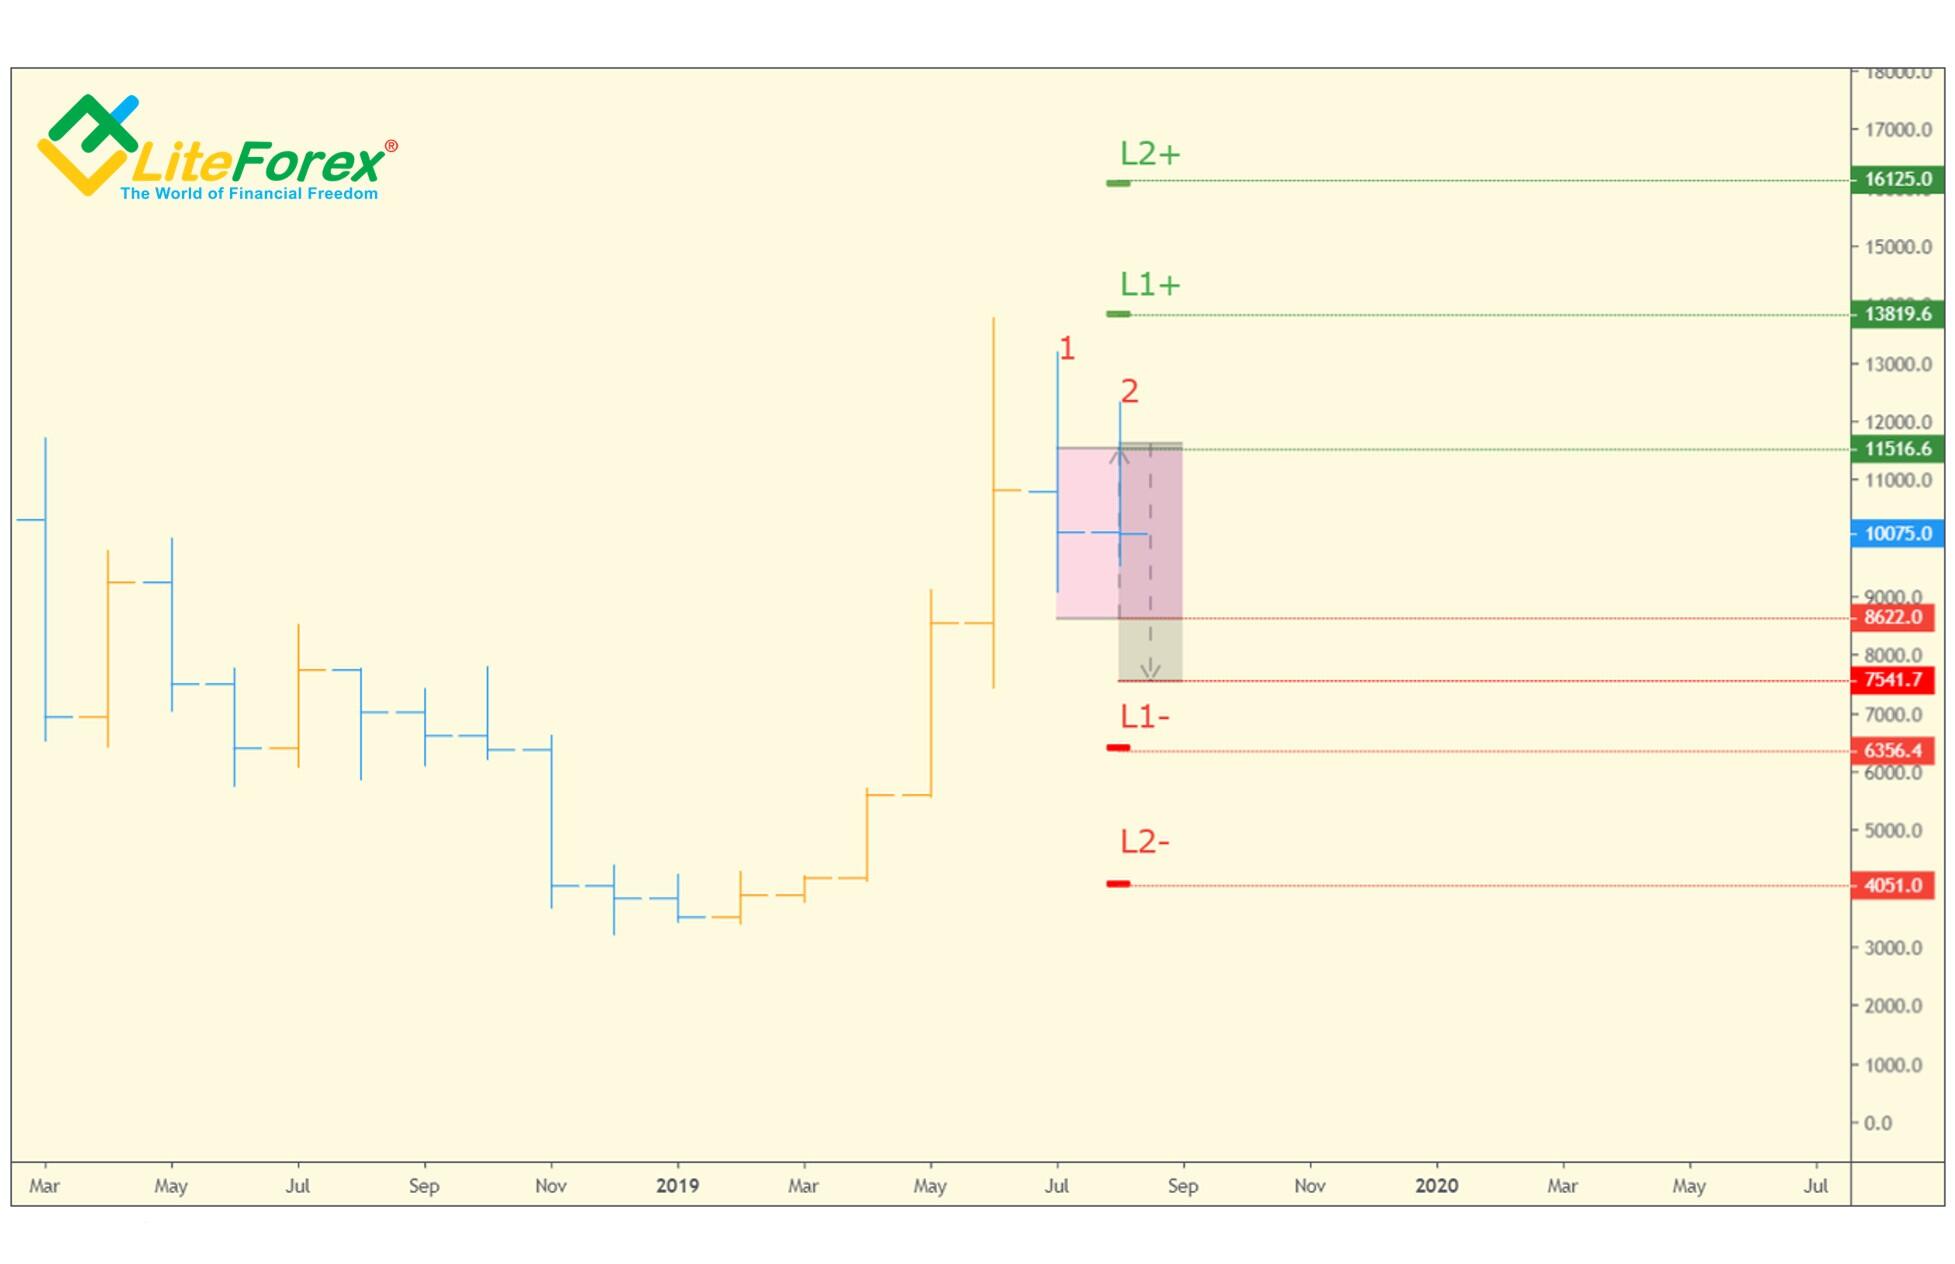
Step 2. Now, define the TD Tolerance levels.
First, you need to find out the true high and the true low of the range.
Therefore, we see that the true range for bar №1 is between 405.3 USD and 13174 USD and is equal to 13174 – 3405.3 = 9768.7
So, 15% of the defined range will be 9768.7 USD *15% = 1465.35 USD
Thus, adding this value to and subtracting it from the opening price of the August bar, we will know the Upside and the Downside limits of the TD tolerance.
As the August bar’s open is 10088 USD, we get the following values:
Upside TD Tolerance Level = 10088 USD + 1465.35 USD = 11553.31 USD
Downside TD Tolerance Level = 10088 USD — 1465.35 USD = 8622.69 USD
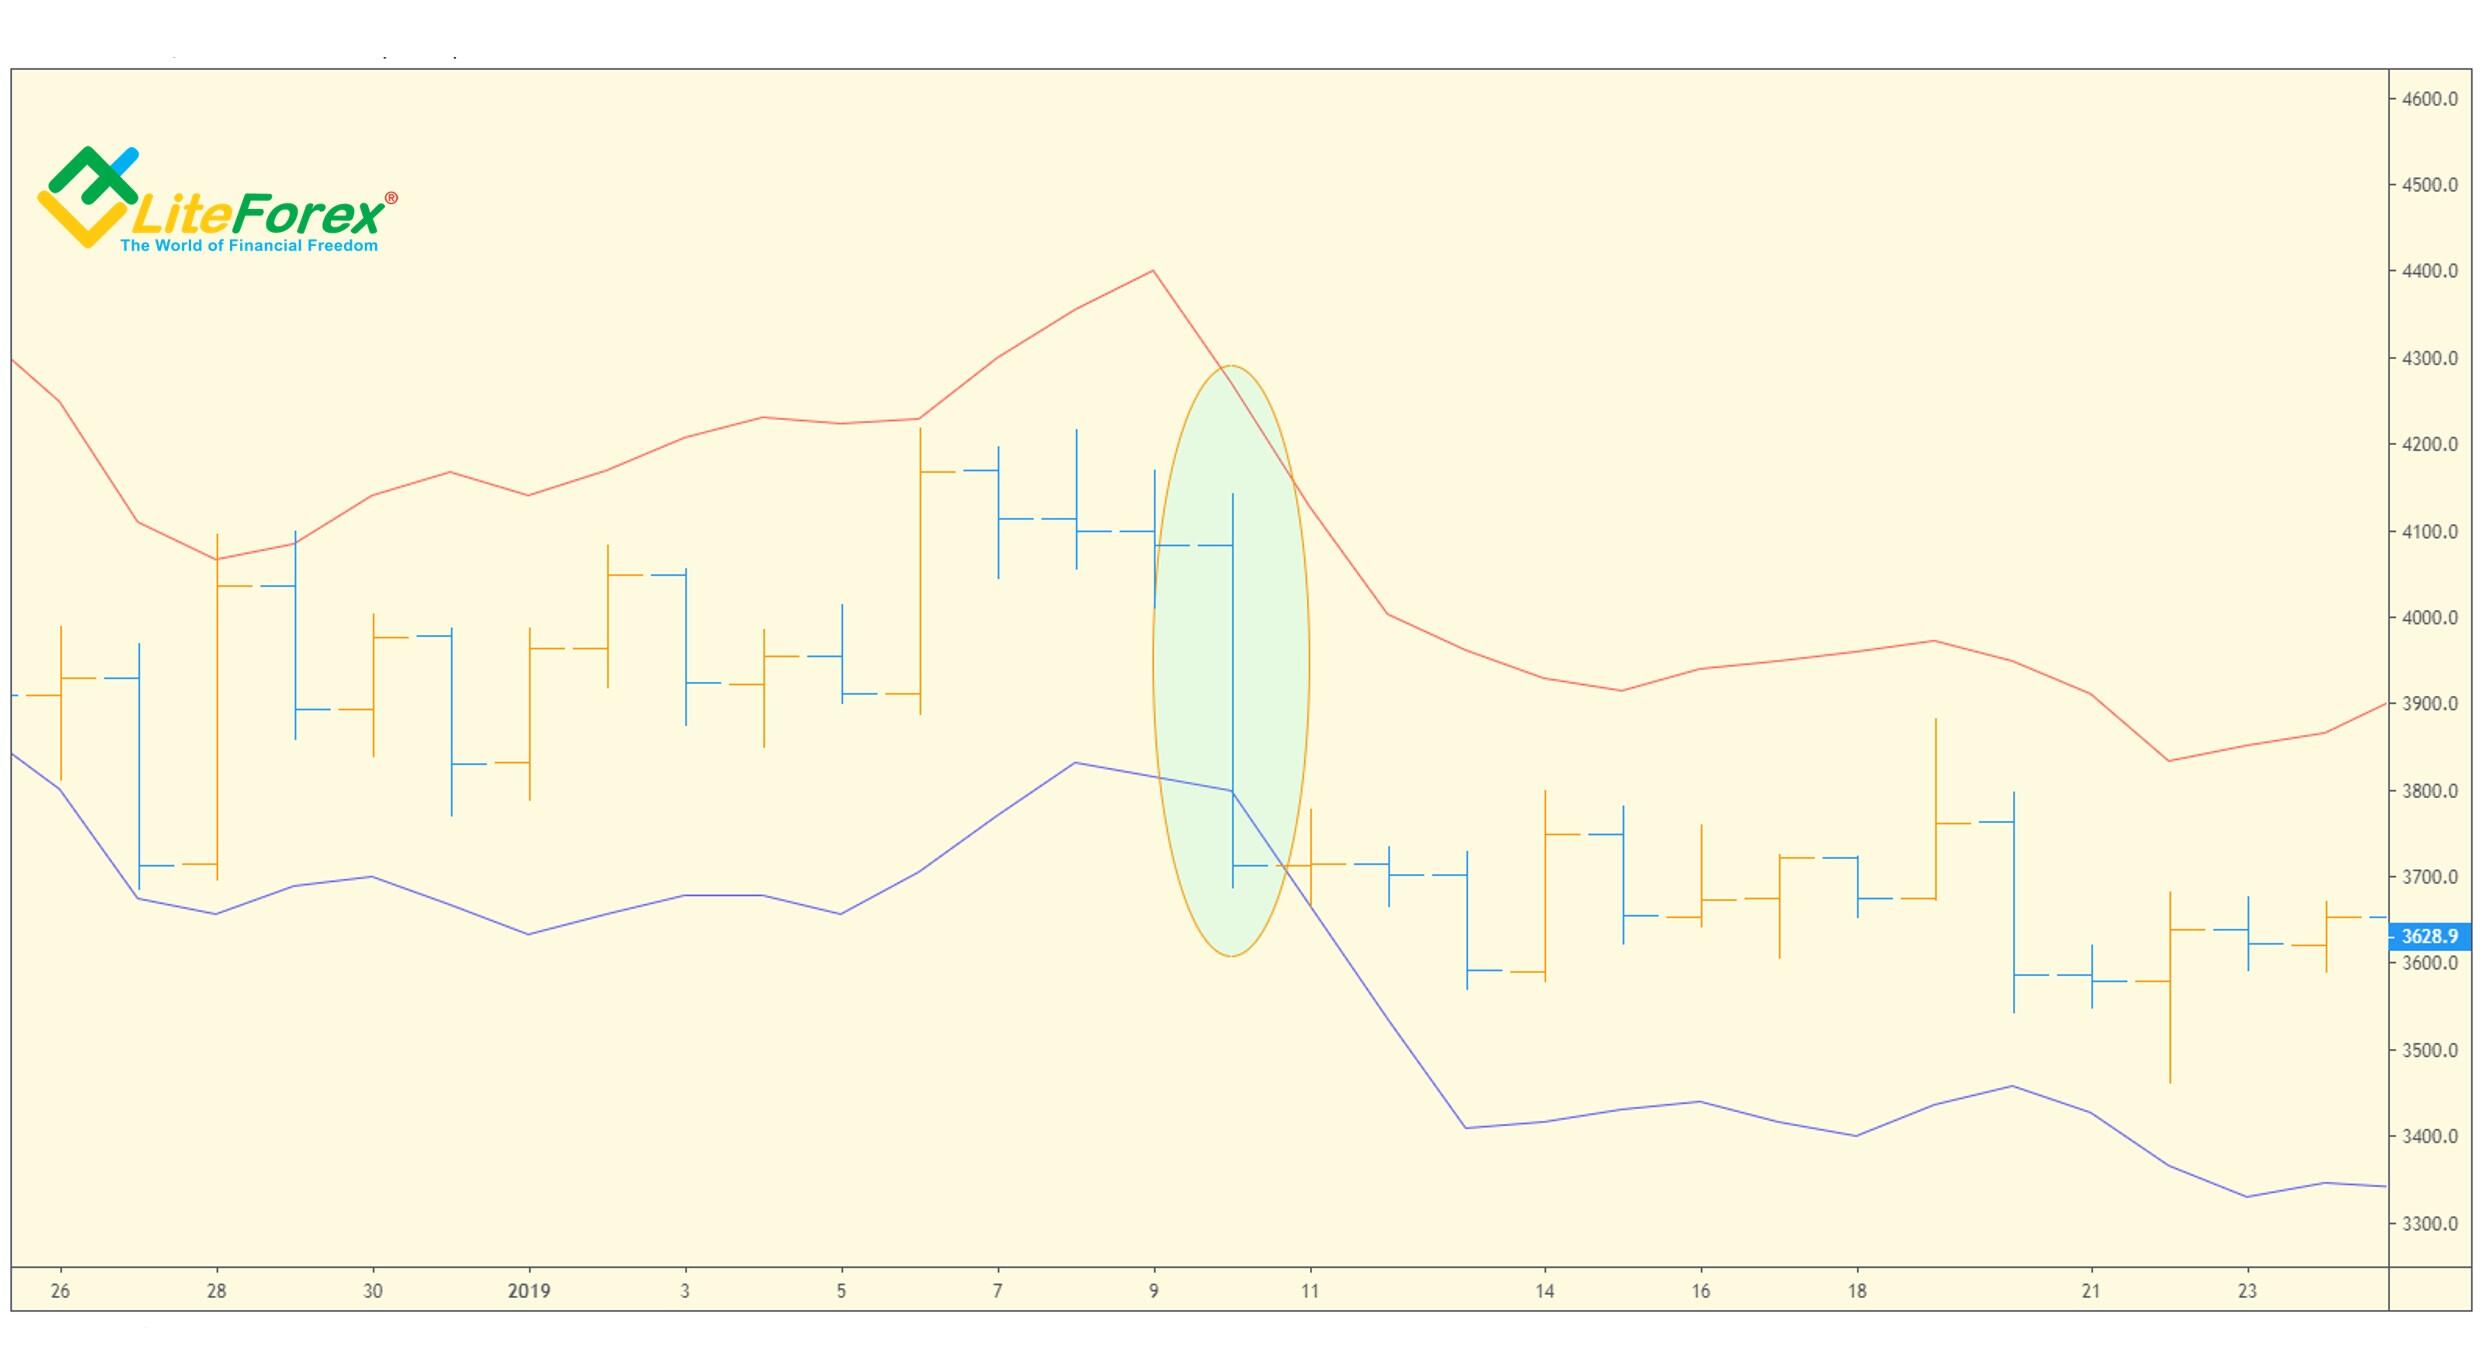
Finally, we have the following situation (see the figure above).
If we switch to the D1 timeframe, we will see that the price has broken through the Upside TD Tolerance level and the high of the Range Projection, which confirms the third condition, and so, the price is likely to close above the high of the Range Projection at 11631 USD.
There is not much time till the end of the month, and this situation is rather curious now. We shall see if the scenario will work out.
Next, I will continue describing DeMark’s technical tools and their application to the BTCUSD trading.
I will deal with this and with many other interesting tools in my next articles. Subscribe to the blog and you will not miss anything new!
I wish you good luck and good profits!
PS. If you agree with my ideas, write “+” in the comments; if you don’t agree, put “-”. If you liked the post, just write thank you, and don’t forget to share the post. It is easy for you and I will be very pleased :)
Stay informed on the latest cryptocurrency news, follow my posts on the blog.
Useful links:
I recommend trying to trade with a reliable broker here. The system allows you to trade by yourself or copy successful traders from all across the globe.
Telegram channel with high-quality analytics, Forex reviews, training articles, and other useful things for traders http://t.me/litefinance.

Price chart of BTCUSD in real time mode
The content of this article reflects the author’s opinion and does not necessarily reflect the official position of LiteFinance broker. The material published on this page is provided for informational purposes only and should not be considered as the provision of investment advice for the purposes of Directive 2014/65/EU.
According to copyright law, this article is considered intellectual property, which includes a prohibition on copying and distributing it without consent.