If something goes wrong in the market, look for an entry point
Forex trading looks like driving on the highway. Some speed up, some slow down; some stop at the roadside, some make a U-turn and start driving in the opposite direction.
So, every trader is familiar with such notions as “divergence” and “convergence”. The divergence between an asset’s price and the indicator may be considered to be a signal for opening a position. Different vectors of central banks’ monetary policies serve to seriously correct the investment portfolio.
Convergence is understood as a common direction of the price of assets, technical indicators, or monetary policies. Divergence means different directions. In most cases, divergence is an exception to the rule. Its occurrence demands that a financial instrument de regarded with more attention. It concerns both technical and fundamental analyses. Graphically, divergence manifests itself through different extremums.
Divergence in EUR/USD chart

In June, there were 2 rising maximums in EUR/USD’s daily chart while the MACD chart showed falling maximums. It shows that the bulls weren’t strong enough to continue the uptrend and short positions were supposed to be opened. The main currency pair reached a new trough at the end of July while MACD’s minimums were rising, on the contrary. The divergence gave the buyers a reason to attack.
If there’s a strong direct correlation between assets, the divergence in their evolutions is regarded as an anomaly and the right use of this anomaly allows earning money. The same applies to inverse correlation. If it occurs, convergence becomes an anomaly. Thus, everyone knows about the inverse correlation between the US dollar and gold. If the assets move in the same direction, then something is wrong.
Convergence between gold and the USD
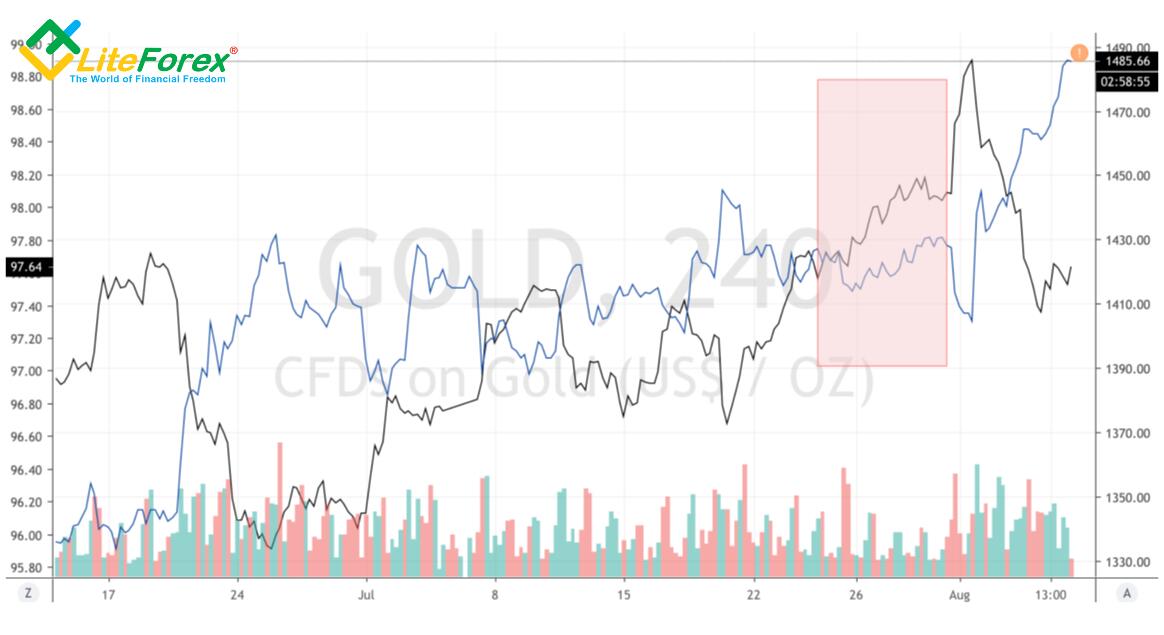
At the end of July, gold and the USD index started growing at the same time. The subsequent consolidation of the greenback weakened gold just for a short period of time. It clawed back lost positions fast despite the fact that the dollar continued its rally. One could conclude that big traders weren’t willing to sell XAU/USD. The conclusion proved to be correct, which allowed profiting from long positions in gold.
If divergence allows opening short- and medium-term trades in technical and cross-market analysis, then different vectors of central banks’ monetary policies give a reason for opening long-term positions. A typical example is the year 2015 when the Fed started the monetary policy normalization (by raising the federal funds rate) and the ECB decided to soften it by launching the QE program.
Dynamics of USD index and Effective Federal Funds Rate

The divergence between the monetary policies of the European Central bank and the Fed allowed the US dollar to soar to its highest since 2003. In the period from autumn 2014 to January 2017, the USD index grew nearly 30% and the investors got a clear idea of the prevailing market trend, which resulted in efficient trades.
Thus, the idea of “divergence” doesn’t come exclusively to technical analysis. Central banks and cross-market analysis use it too. A skilful use of different vectors of monetary policy and interrelated assets’ movements will boost your trading efficiency for sure.
P.S. Did you like my article? Share it in social networks: it will be the best "thank you" :)
Useful links:
- I recommend trying to trade with a reliable broker here. The system allows you to trade by yourself or copy successful traders from all across the globe.
- Use my promo code BLOG to get a 50% deposit bonus on the LiteFinance platform. Simply enter this code in the appropriate field when funding your trading account.
- Telegram chat for traders: https://t.me/litefinancebrokerchat. We are sharing the signals and trading experience.
- Telegram channel with high-quality analytics, Forex reviews, training articles, and other useful things for traders https://t.me/litefinance
Price chart of EURUSD in real time mode

The content of this article reflects the author’s opinion and does not necessarily reflect the official position of LiteFinance broker. The material published on this page is provided for informational purposes only and should not be considered as the provision of investment advice for the purposes of Directive 2014/65/EU.
According to copyright law, this article is considered intellectual property, which includes a prohibition on copying and distributing it without consent.