Learning to identify false and true breakouts
When quotes approach the diagonal line of resistance/support, traders follow the currency pair with more attention. A breakout may entail an impulse movement which can be used to our advantage. However, some traders prefer trading retracements and developing their own trading strategies. Anyway, we’d better have a set of rules at hand to be able to identify whether or not a breakout is false.
We have already discussed the Three touches strategy based on false breakouts of analytical lines. When it comes to a bearish trend, positions are opened at downward resistance line retracements. If a currency pair is controlled by bulls, we need to buy at upward support line retracements. A trader’s main goal is identifying the validity of a breakout. To reach it, the qualifiers of Thomas DeMark, the author of bestselling “The New Science of Technical Analysis”, may be used.
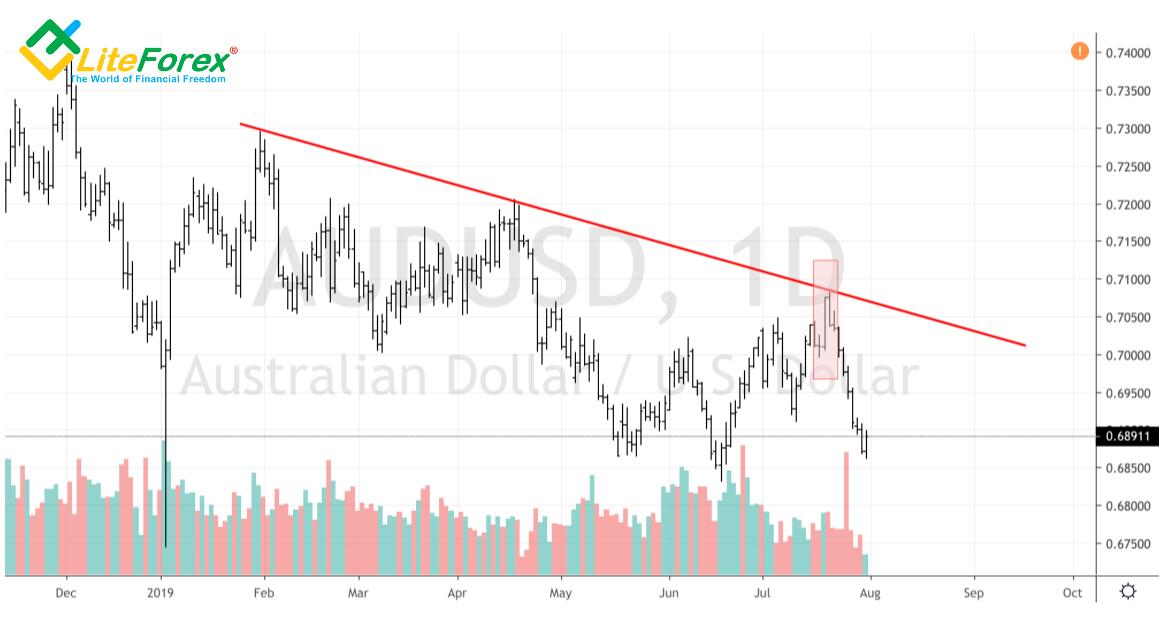
The first one is based on comparing the bar’s closing prices 1 and 2 days before the breakout. Diagonal resistance will hardly be broken if closing the day before the breakout was higher than 2 days before the breakout. The example of the Australian dollar shows that bulls seriously counted on assaulting the diagonal resistance after the active growth in June/July, but they spent all their strength just to approach it. In the end, bears took the initiative and realized the “Three touches” pattern using DeMark’s qualifier no. 1.
DeMark’s qualifier no. 1 in AUD/USD’s chart
Qualifier no. 2 is rarely seen at Forex because the market operates 24 hours. It’s based on a gap: the opening price of the breakout bar must be above the diagonal resistance line (below the diagonal support line). In this case, a breakout will be considered true.
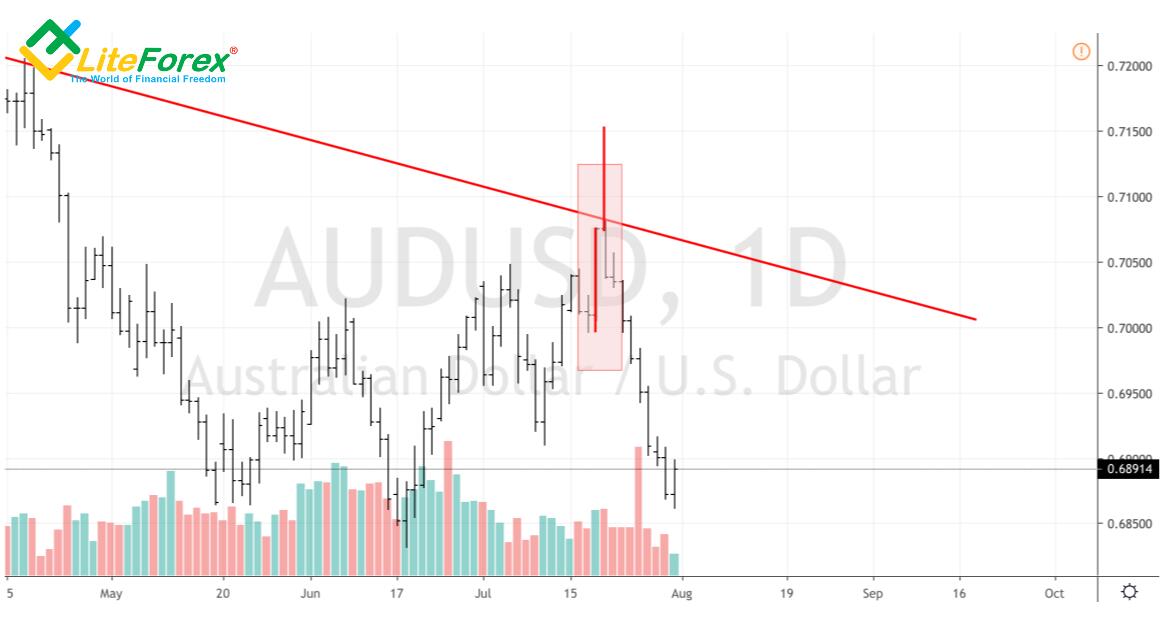
Qualifier no. 3 implies using a projection. Its value is calculated as the sum of the bar’s closing price the day before the breakout and the difference between this price and the low of the bar one or 2days before the breakout (the smallest one). If the projection can’t reach the resistance line, the upward breakout is deemed true. The same applies to assaults of diagonal support:
Projection = the closing price the day before the breakout minus the difference between this price and the high of the bar one or 2 days before the breakout (the biggest one).
The AUD/USD example shows a false breakout as the projection is above the analytical line. So, the trader could open short positions according to DeMark’s two qualifiers using the “Three touches” pattern.
DeMark’s qualifier no. 3 in AUD/USD’s chart
The “Three touches” strategy is not the only one which uses breakout qualifiers. Trading channels are quite a simple and efficient system. If false breakouts take place, the trader can enter the market at the retracement from the analytical line. If true breakouts take place, the trader can form positions at the breakout of resistance/support.
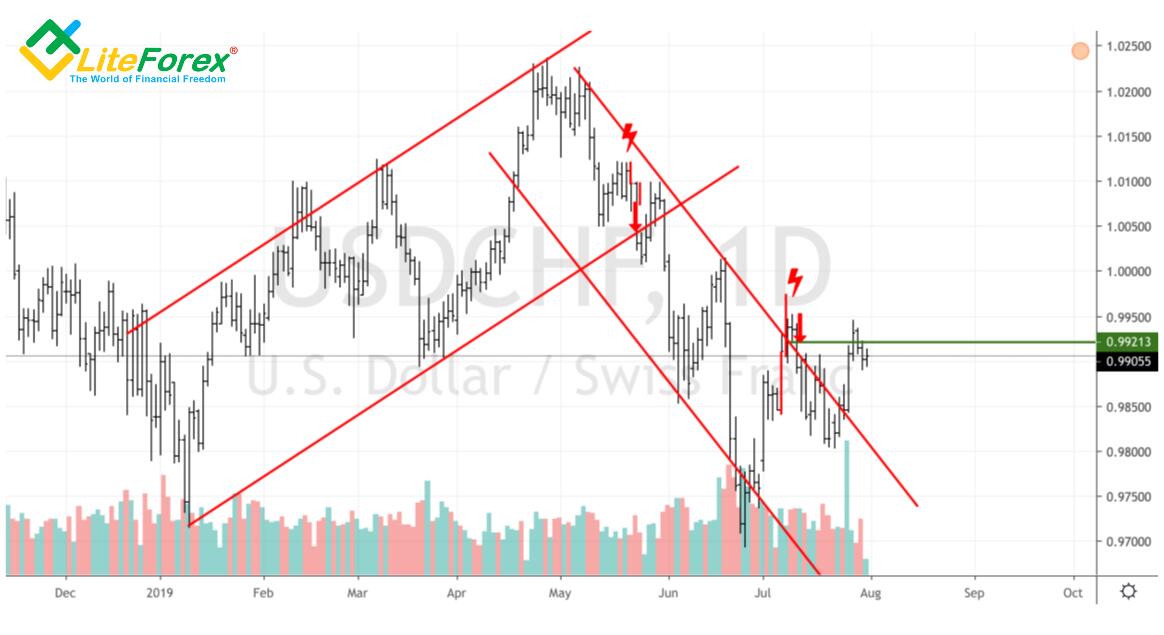
For example, a true test of the lower limit of the ascending trading channel in USD/CHF took place at the end of May. Using DeMark’s qualifier no. 3, the trader could open a short position with a stop order at the level of the previous accumulation. In July, the breakout of the upper limit of the descending trading channel turned out to be false, which allowed opening a short position after a Doji bar worked out. A protective order was worth placing at the maximum retracement level.
DeMark’s breakout qualifiers in USD/CHF chart
So, based on Tom DeMark’s research, we may construct our own trading systems to trade retracements or breakouts of resistance/support diagonal lines.
P.S. Did you like my article? Share it in social networks: it will be the best "thank you" :)
Useful links:
- I recommend trying to trade with a reliable broker here. The system allows you to trade by yourself or copy successful traders from all across the globe.
- Use my promo code BLOG to get a 50% deposit bonus on the LiteFinance platform. Simply enter this code in the appropriate field when funding your trading account.
- Telegram chat for traders: https://t.me/litefinancebrokerchat. We are sharing the signals and trading experience.
- Telegram channel with high-quality analytics, Forex reviews, training articles, and other useful things for traders https://t.me/litefinance
Price chart of USDCHF in real time mode

The content of this article reflects the author’s opinion and does not necessarily reflect the official position of LiteFinance broker. The material published on this page is provided for informational purposes only and should not be considered as the provision of investment advice for the purposes of Directive 2014/65/EU.
According to copyright law, this article is considered intellectual property, which includes a prohibition on copying and distributing it without consent.