Which direction of Forex analysis is the most efficient?
The fans of technical analysis adopted the principle “the price takes account of everything” which they use to counteract any kind of criticism. Why should one study the influence of fundamental factors on the currency rate if they are already reflected in Forex quotes? Why try to understand the position of central banks if the market knows what they think? If everything was that easy, any technical analyst could earn millions with no problems. In fact, different people interpret information in a different way. What’s more, who could guarantee that the data reflected in currency rates is true? For example, the market is now sure that the federal funds rate will be lowered in July, but will the Fed soften monetary policy in reality?
In no way am I calling you to give up technical analysis in practice! No way! This direction of market research is extremely important for making final trading decisions, defining targets and stop orders, and building a skilful risk management system. However, I think that only a wise combination of fundamental and technical analysis is a way to succeed. Macroeconomics helps us understand the background against which the markets are operating. A typical example is the current situation at Forex.
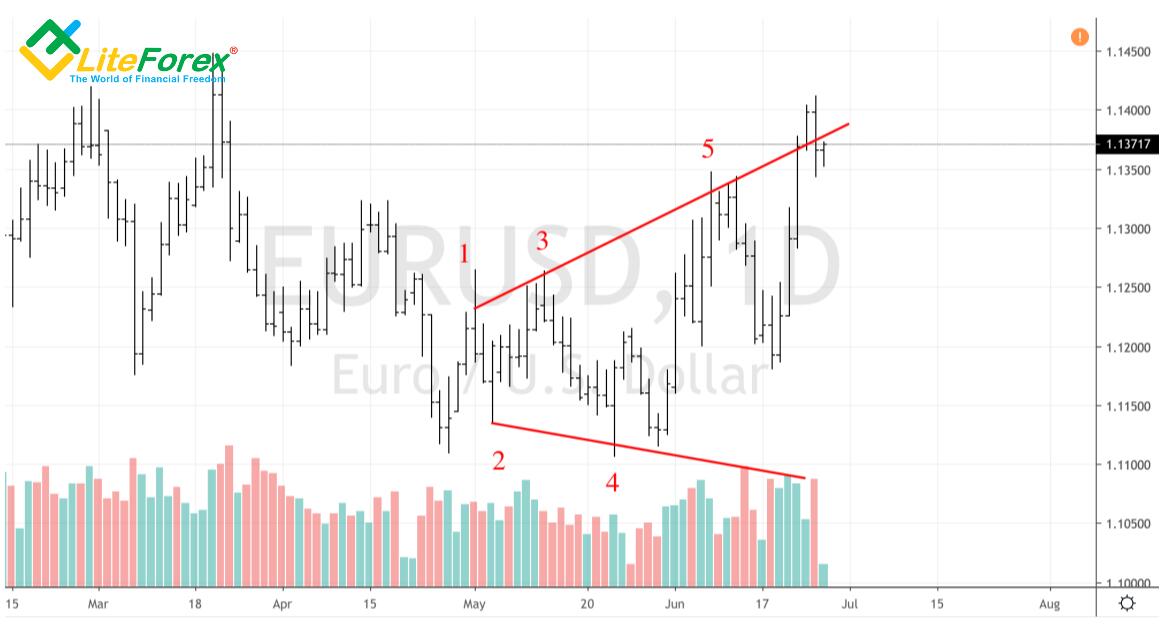
Fundamentally, the growth of Euro against the USD is linked to the Fed’s wider opportunities to soften monetary policy than the ECB’s. The federal funds rate is 2.5%, the ECB deposit rate is negative (-0.4%). Under such conditions, a trader should look for bullish patterns in EUR/USD charts. As I’ve already written, one of the most efficient patterns is Expanding wedge. It is a combination of raising maximums (points 1, 3, 5) and falling minimums (points 2 and 4). There’s a severe fight between bulls and bears in the market, and a common trader should use coyote tactics: wait for the winner and side with him.
Expanding wedge in EUR/USD chart
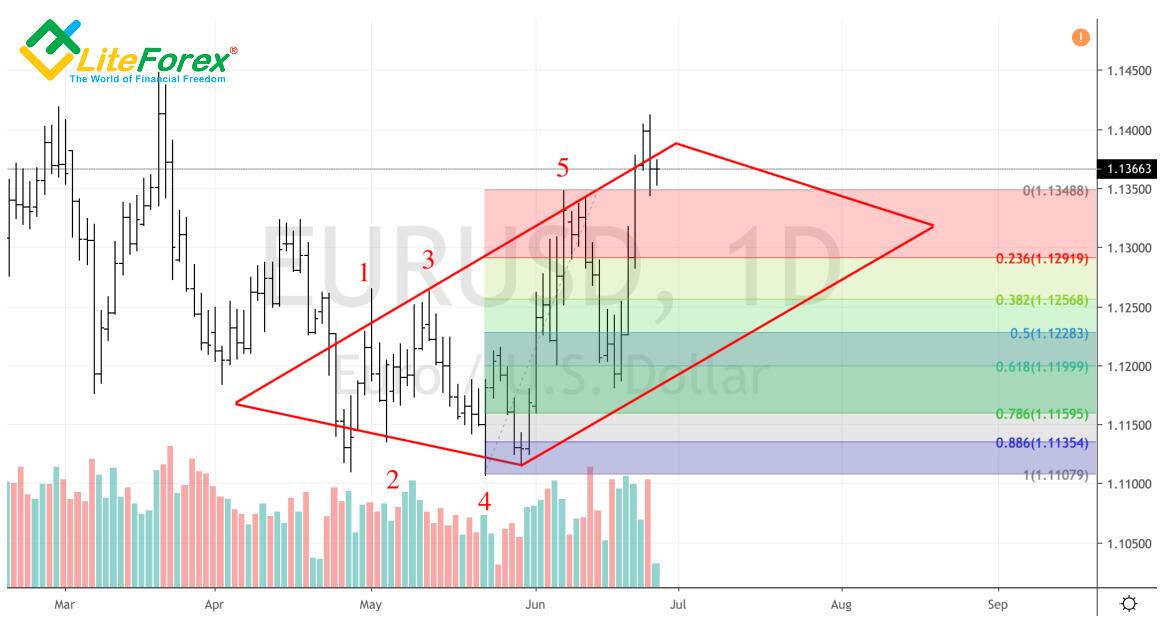
The theory says that a retracement which takes place after point 5 was reached is accompanied with lower trade volumes. It shows bears’ weakness. A trader needs to be more cautious: corrections to the levels 23.6%, 38.2%, 50%, and 61.8% of the wave 4-5 and a subsequent retracement are a reason to open long positions. Another confirming signal is needed and it doesn’t keep us waiting: the pattern of candlestick analysis called “bullish absorption” formed at the 61.8 retracement. The main advice is to buy at the return to the previous levels (50% and 38.2% of the wave CD). A protective stop-order is placed at the fluctuation minimum.
Strategy of work under Expanding wedge pattern

Technically, nothing can prevent EUR/USD from continuing its northern march. Fundamentally, further dynamics of the main currency pair will depend on a dialogue between Donald Trump and Xi Jinping at G20 summit in Japan. The US dollar is very likely to recover for some time. As a result, there will be consolidation and the “Expanding wedge” pattern will transform into Rhomboid Bottom. The traders familiar with the latter may have an opportunity to enter medium- and long-term long positions at the breakout of diagonal resistance.
Rhomboid Bottom pattern in the EUR/USD chart
So, fundamental analysis shouldn’t be given up because of the “price takes account of everything” principle. There are many aspects, invisible to a technical analyst’s eye. Only a wise combination of macroeconomic research and chart studying will allow staying in the market for a long time.
P.S. Did you like my article? Share it in social networks: it will be the best "thank you" :)
Useful links:
- I recommend trying to trade with a reliable broker here. The system allows you to trade by yourself or copy successful traders from all across the globe.
- Use my promo code BLOG to get a 50% deposit bonus on the LiteFinance platform. Simply enter this code in the appropriate field when funding your trading account.
- Telegram chat for traders: https://t.me/litefinancebrokerchat. We are sharing the signals and trading experience.
- Telegram channel with high-quality analytics, Forex reviews, training articles, and other useful things for traders https://t.me/litefinance
Price chart of EURUSD in real time mode
The content of this article reflects the author’s opinion and does not necessarily reflect the official position of LiteFinance broker. The material published on this page is provided for informational purposes only and should not be considered as the provision of investment advice for the purposes of Directive 2014/65/EU.
According to copyright law, this article is considered intellectual property, which includes a prohibition on copying and distributing it without consent.