Forex trading begins with basic concepts, and time frames are among the most important. Forex traders may notice that the same currency pair can perform differently depending on the chart. This is because each time frame represents a specific period of time covered by a single candlestick.
What is a time frame in Forex? It is an essential concept in market analysis. Market movements on a minute chart show more short-term fluctuations, while daily and weekly timeframes provide a clearer picture of the broader trend. Market noise can make signals harder to identify on shorter time frames, whereas long-term trends are generally more visible on longer ones. Technical analysis should account for the trading horizon, as support and resistance levels may differ across time frames.
Forex trading strategies are typically adapted to specific time frames. Scalping primarily uses short-term charts, such as the one-minute chart, while swing trading generally focuses on longer time frames, including the daily chart. Your chosen trading style should match the time frame, as risk management parameters and trade duration depend on it.
This article examines the most popular time frames, explores their characteristics, and determines which time frame is best for different types of Forex trading.
The article covers the following subjects:
Major Takeaways
A time frame is the period represented by a single candlestick or bar. For example, M15 shows 15 minutes of price movement, while D1 shows one day. The time frame influences both the type of analysis and the level of volatility displayed: shorter time frames reveal more short-term fluctuations and market noise, while higher time frames provide a clearer view of broader price movements.
Scalping (M1–M5) involves numerous short-term trades throughout the day. Day trading (M15–H1) implies opening and closing positions within the same trading day, without carrying them overnight. Swing trading (H4–D1) means holding positions for several days to several weeks, while position trading (W1–MN) suggests holding positions for extended periods, with less emphasis on short-term price fluctuations. Higher time frames generally produce fewer signals, but those signals are less affected by short-term market noise.
Which time frame is best for trading? Consider your trading style and how much time you can devote to market analysis. M15–H1 time frames are generally suitable for day trading, while H4 or D1 may be more appropriate if you can only check the charts a few times a day. Multi-timeframe analysis can also be useful. The higher time frame helps identify the overall market trend, while the lower timeframe can refine the entry point. Whatever approach you choose, backtest it on historical data.
For beginners, H4 or D1 can be a good starting point. These time frames have less market noise and don't require constant monitoring of short-term price movements. Shorter time frames, such as M1–M15, require more frequent attention and can make trading costs more significant. Start with a daily chart, learn to identify trends and key price levels, and practice on a demo account for two to three months. After that, you can move to H1–H4 time frames.
What Is a Time Frame in Forex?
What is a time frame in trading? It is the time interval represented by a single candlestick on a candlestick chart. For example, on an H1 chart, each candlestick reflects price changes over one hour. Forex time frames range from one minute (M1) to one month (MN). Most trading platforms offer standard intervals: M1, M5, M15, H1, H4, D1, W1, and MN.
Price movement looks different across time frames. A one-minute chart captures short-term market fluctuations and minor price swings, which can create significant market noise. An hourly chart filters out some of this noise but may still generate false signals. A daily chart provides a clearer view of the overall market direction, while a weekly time frame highlights broader market trends.
Technical analysis accounts for these differences. Technical indicators, such as the moving average, react more strongly to individual price fluctuations on short timeframes. On longer time frames, trading signals are generally less affected by short-term noise and may therefore be more reliable. Price action on H4 and D1 charts can help identify entry and exit points while reducing the impact of market noise compared with the M5 chart.
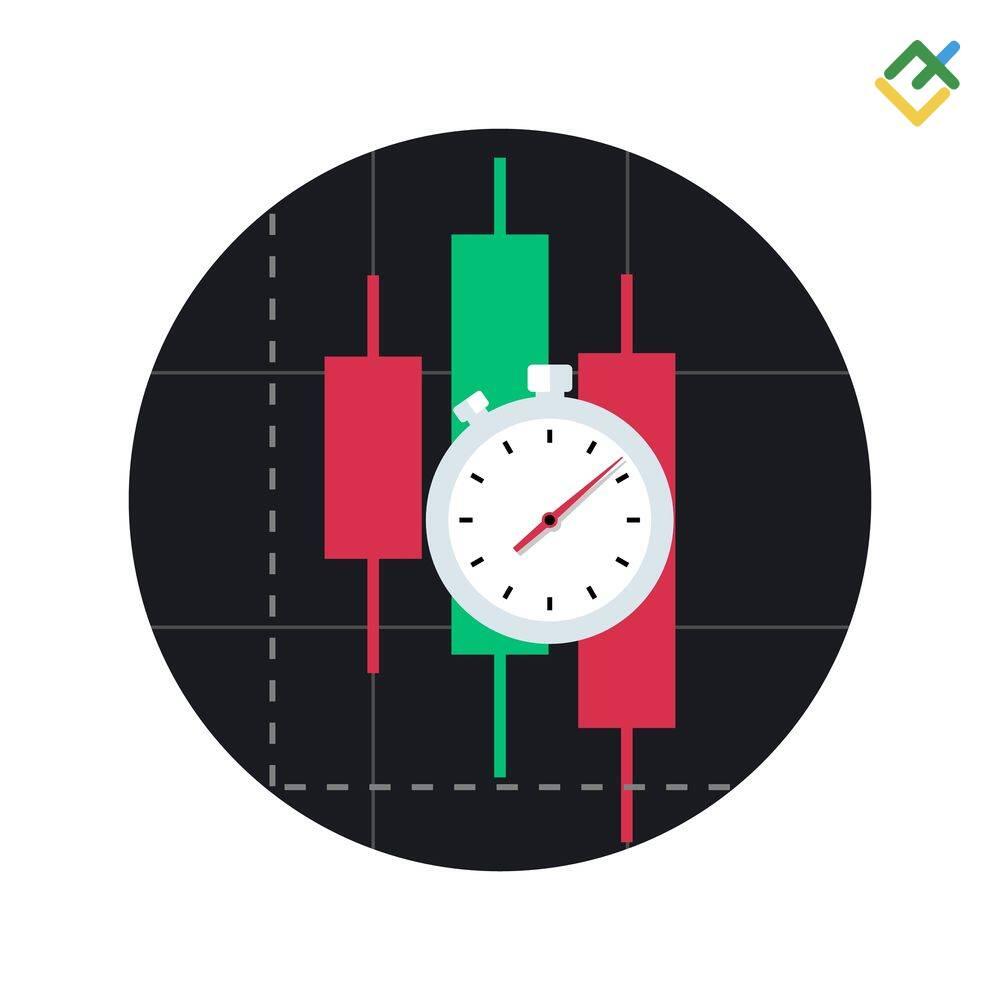
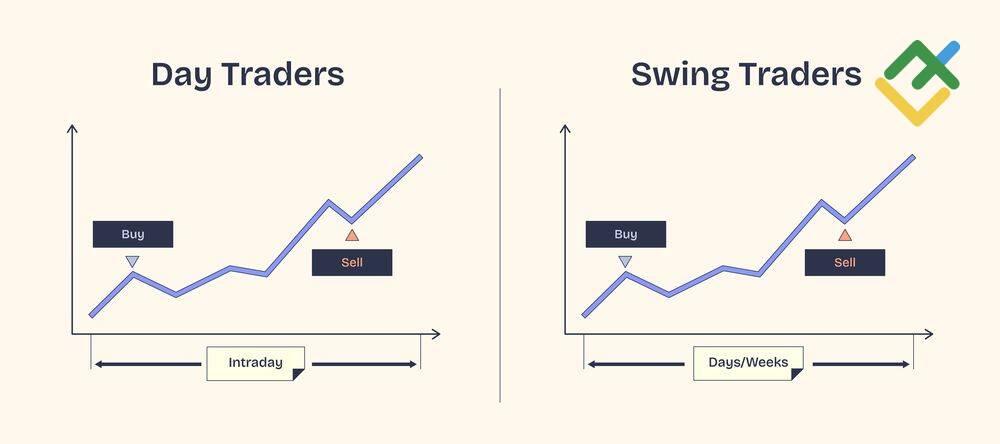
The choice of Forex timeframes affects trading decisions and trading outcomes. Day traders typically use M15–H1, swing traders focus on H4–D1, while position traders work with W1–MN time frames. Currency pairs can behave differently across time frames, and their volatility may change throughout trading sessions. Major currency pairs, such as EUR/USD and GBP/USD, can be traded across different timeframes, but available trading opportunities depend on the selected time frame.
Market analysis begins with choosing an appropriate time frame. While the H1 chart may show an uptrend, the D1 chart may display a downtrend. This reflects the different time scales of the Forex market. Therefore, your choice depends on your trading strategy, trading objectives, and psychology.
How to Choose a Time Frame by Trading Style
What is the best time frame to trade Forex for beginners? Determine your trading style and how much free time you have. Your trading style is the key factor: can you spend several hours in front of the screen, or are you willing to check the chart only once a day?
Active traders may find scalping on the one-minute chart suitable. However, market noise is high on the M1 time frame, and false signals occur frequently. Selecting precise entry points requires experience, as price action and technical analysis on short time frames are more susceptible to noise. Successful scalping requires strict discipline and effective risk management.
Swing trading is designed for holding positions for several days or longer. The 1-hour and 4-hour charts are commonly used for this strategy, as major trend direction is often clearer and support and resistance levels are less affected by short-term noise. Swing traders can use wider stop-losses while maintaining an appropriate risk-to-reward ratio. Reducing market noise is one of the key advantages of higher time frame trading.
Which time frame to use depends on your risk tolerance and how much time you can devote to trading. For most traders who balance trading with a full-time job, the H1 or H4 time frames may be suitable. The daily chart can help identify the overall trend, while the H4 chart can refine entry points.
Trading sessions also influence your time frame choice. The European session typically offers more trading opportunities than the Asian session. Since volatility fluctuates throughout the day, price movements can vary as well.
Multi-timeframe trading involves analyzing several time frames, but it is reasonable to start with just one. Experienced traders often master one time frame before using others. Whatever trading strategy you choose, test it on a demo account before committing real money.
Scalping: M1–M5
Scalping is a trading style that requires intense concentration. Intra day trades on the one-minute chart are typically opened and closed within seconds or minutes. Trading time frames from M1 to M5 involve high trading activity and sharp price movements.
Market noise is especially pronounced on the M1 chart. Price fluctuations of just a few pips can make technical analysis more challenging. Support and resistance levels and moving averages on short time frames can produce false signals. Scalping signals are often based on price action, but filtering market noise remains one of the main challenges of short-term trading.

Major currency pairs—including EUR/USD, USD/JPY, and GBP/USD—are well suited to scalping because of their relatively low spreads. Sufficient volatility is also essential for short-term trades. The most active trading sessions, particularly the overlap between the European and US sessions, tend to offer more trading opportunities. However, spreads and commissions can heavily affect trading results.
Risk management is especially important in scalping. Define the risk/reward ratio, profit target, stop-loss, and entry and exit points in advance. Effective risk management can help limit the impact of market noise on trading decisions.
Experienced traders recognize scalping as a demanding trading style. False signals and psychological pressure are common, making risk tolerance an important consideration.
Day Trading: M15–H1
Day trading is a trading style in which positions are closed before the end of the trading day. Active traders commonly use M15–H1 time frames: the hourly chart provides a clearer view of price movement while generating less market noise than minute-based charts. Day traders may execute several intraday trades during a single session.
Technical analysis on the H1 chart is generally less affected by market noise than on the M5 chart. Trends and support and resistance levels are often easier to identify. Moving averages, such as the 50- and 200-period MAs, can help determine trend direction, although they do not guarantee reliable signals. Price action on the hourly chart can also help identify patterns such as Double Tops and Head-and-Shoulders. A trading signal is generally stronger when it is confirmed by multiple factors.
What is the best time frame for day trading? For day trading, choose currency pairs with sufficient volatility, such as EUR/USD, GBP/USD, and EUR/JPY, particularly during the most active trading sessions. Market conditions and trading activity on the H1 time frame can change throughout the day.
Entry and exit points can be determined using support and resistance levels and price action. To fine-tune entries, traders may wait for an H1 candlestick to close, as intrahour price fluctuations can generate false signals. Define exit points in advance as part of risk management. The risk-to-reward ratio and profit target depend on the trading strategy and prevailing market conditions.
Day trading strategies may also incorporate a multiple time frame analysis. For example, experienced traders can identify the overall trend on the H4 chart and then look for entry points on H1. Multi-timeframe analysis can help refine trading decisions and filter out some false signals. Day trading suits traders who can devote several hours a day to monitoring the market.
Swing Trading: H4–D1
Swing trading involves trading in the direction of the dominant trend while holding positions for several days to several weeks. The main time frames are H4 and D1. Swing traders focus on a broader market direction and wait for suitable entry points.
What is the best time frame for swing trading? H4 and D1 are the most commonly used. Price movement on these time frames is less affected by minor fluctuations, making the overall trend easier to identify. Market noise and false signals are also less frequent than on lower time frames. On the daily chart, traders can use support and resistance levels, moving averages, and price action patterns to identify potential trading opportunities.
As a primary time frame, the daily chart helps determine the overall trend direction, while the weekly timeframes highlight longer-term market trends. The H4 chart can then be used to refine entry setups. Swing traders typically use wider stop-loss levels, taking into account the risk-to-reward ratio and profit target.
For swing trading, choose currency pairs that tend to exhibit stable trends, such as GBP/USD, AUD/USD, and USD/CHF. Market conditions on the D1 time frame are less affected by trading sessions. Fundamental factors may offer trading opportunities, while technical analysis helps identify potential entry and exit points. Risk management should account for potential drawdowns and risk tolerance.
Swing trading decisions do not require constant chart monitoring. Effective risk management helps limit potential losses in advance. Unlike day traders, swing traders focus on broader, longer-term trends. Market noise is generally less pronounced on the D1 time frame, making it easier to distinguish reliable signals from short-term fluctuations.
Position Trading: D1–W1–MN
Position trading is a long-term trading style in which position traders hold positions for periods ranging from several weeks to several years. They typically use daily, weekly, and monthly time frames. Long-term trends in financial markets are largely driven by macroeconomic factors such as interest rates, inflation, and central bank policies.
Technical analysis often plays a supporting role in position trading. Price movements on the weekly chart are less affected by market noise, making the trend direction easier to identify. Broad market trends can persist for extended periods, while the primary trend on the W1 chart is less influenced by minor price fluctuations.
Price fluctuations on the daily chart are analyzed in the context of the broader trend. Support and resistance levels and moving averages on the weekly chart can help assess the trend's strength. Market analysis also incorporates fundamental data and long-term market outlooks.
Risk management should account for trade duration and potential drawdowns. The risk-to-reward ratio, profit target, and overall risk management depend on the trading strategy, position size, and risk tolerance. Trading activity is typically low. Entry points may be identified on the daily chart, while exit points can be determined using the weekly chart and broader market conditions.
Position traders are less responsive to short-term Forex market volatility and focus primarily on long-term trends. Their trading decisions are guided by the broader market picture. For most traders, this approach requires patience, while trading results depend on the chosen strategy and the quality of risk management. Position-trading strategies generally involve holding a position as long as the fundamental factors supporting the long-term trend remain intact.
Best Time Frame to Trade Forex for Beginners
The best trading time frame for beginners is H1 or H4. The one-minute chart is more challenging due to high market noise and frequent false signals, while the weekly chart offers few opportunities for practice. The hourly chart allows you to combine a sufficient frequency of signals with a moderate level of market noise.

You can start with the H1. Technical analysis on the hourly chart provides enough signals for practice, and price movement gives you time to analyze. Support and resistance levels are clearly visible, and the moving average is less susceptible to market noise. Trades can last from a few hours to several days.
A beginner's trading style should not be overly complicated. Scalping requires experience, while day trading on the M15 chart demands high concentration. For a more relaxed trading approach, swing trading on the H4 time frame is a good choice. Use the daily chart to identify the overall trend, and the H4 chart for entry points. This multi-timeframe approach uses one chart for trend analysis and another for entry points.

Risk management is an essential skill for beginners. Define the risk-to-reward ratio, stop-loss, and profit target in advance, based on your risk tolerance. Consider market volatility and trading sessions.
Most traders choose a time frame based on their experience, trading style, and available time. Experienced traders often recommend testing different time frames on a demo account. A trading platform makes it easy to switch between time frames, while your trading results can help you determine which one best suits your strategy. Start with one time frame, test your trading strategy, and gradually explore others as you gain experience.
Conclusion
Choosing a time frame in trading is an important decision that affects your trading style, trading frequency, level of market noise, and psychological pressure. Most traders focus heavily on indicators, but the time frame also determines the context for technical analysis.
The best time frame depends on your experience, trading style, and chosen strategy. Beginners may find it easier to start with higher time frames and gradually move to lower ones as traders gain experience. Risk management and risk tolerance should also be aligned with the chosen time frame. Because price movements appear on different scales across charts, the interpretation of a trading signal can vary significantly. Experienced traders often recommend testing different approaches on a demo account.
A multi time frame strategy involves using several time frames, but beginners may benefit from mastering one before adding others. Don't focus solely on volatility and trading frequency—discipline and consistency are equally important for sustainable trading results. Choose a suitable Forex time frame, test your strategy, and refine your approach to make more informed trading decisions.
What is Time Frame in Forex FAQs
There is no one-size-fits-all choice—the right time frame depends on your trading style. M1–M5 are suitable for scalping, M15–H1 for intraday trading, and H4–D1 for swing trading. Your chosen time frame should match your schedule, strategy, and risk management approach.
A multi time frame analysis examines the market across different time frames. Higher time frames (D1 and H4) help identify the overall trend, the medium time frame (H1) helps pinpoint potential entry zones, and the lower time frame (M15) can confirm trading signals.
A time frame is the period represented by a candlestick, such as one hour or one day. A trading session is a period of activity associated with a specific market, such as the Asian, European, or US session, and can affect market liquidity and volatility. These are two distinct concepts.
The choice depends on your trading style, so there is no single "most popular" time frame. Many experienced traders use multiple time frames—for example, D1 to identify the overall trend, H1–H4 for market analysis, and M15 to refine entry points.

The content of this article reflects the author’s opinion and does not necessarily reflect the official position of LiteFinance broker. The material published on this page is provided for informational purposes only and should not be considered as the provision of investment advice for the purposes of Directive 2014/65/EU.
According to copyright law, this article is considered intellectual property, which includes a prohibition on copying and distributing it without consent.