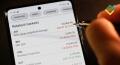
The S&P 500 stock index displays the state of American large businesses, taking into account the current banking exchange rate of the US dollar. The stock ticker is SPX.
The index includes 505 of the most valuable American companies whose shares are publicly traded on the stock exchange. The list is carefully filtered and updated regularly, so the movement of the price of the index differs from the movements of “pure” instruments, such as corporate securities and currencies. Does it make trading the S&P 500 easier? Let’s find out.
The article covers the following subjects:
Why Trade the S&P 500 Index?
The main feature of a market index is smoother price movements due to the fact that shares of poorly performing companies are replaced by shares of more successful ones. As a result, we get smoother rate movements instead of the standard ups and downs characteristic of other instruments.
Therefore, the instrument is more suitable for traders who prefer non-rollback movements. And less so for those who prefer to make money on volatility, which is typical, for example, for gold and WTI oil.
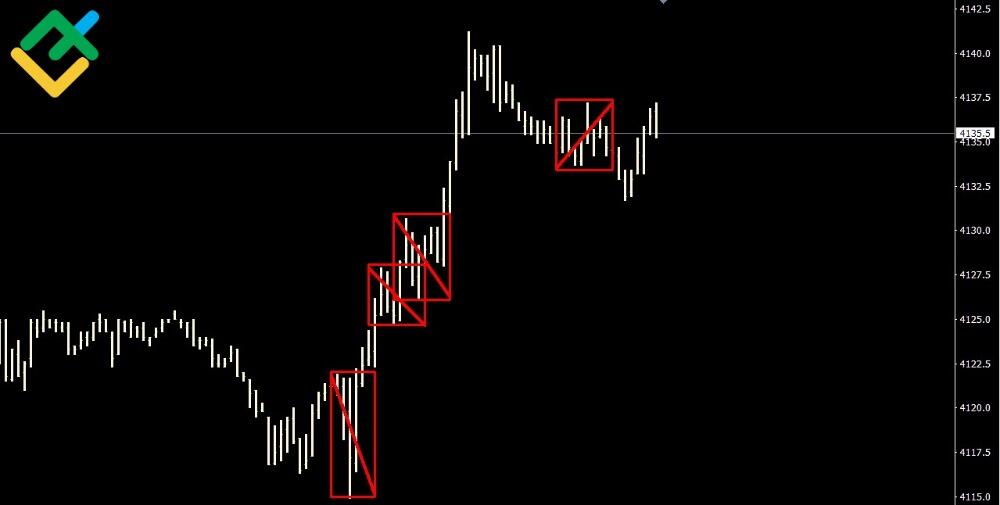
Rollbacks in SPX (M5 timeframe):
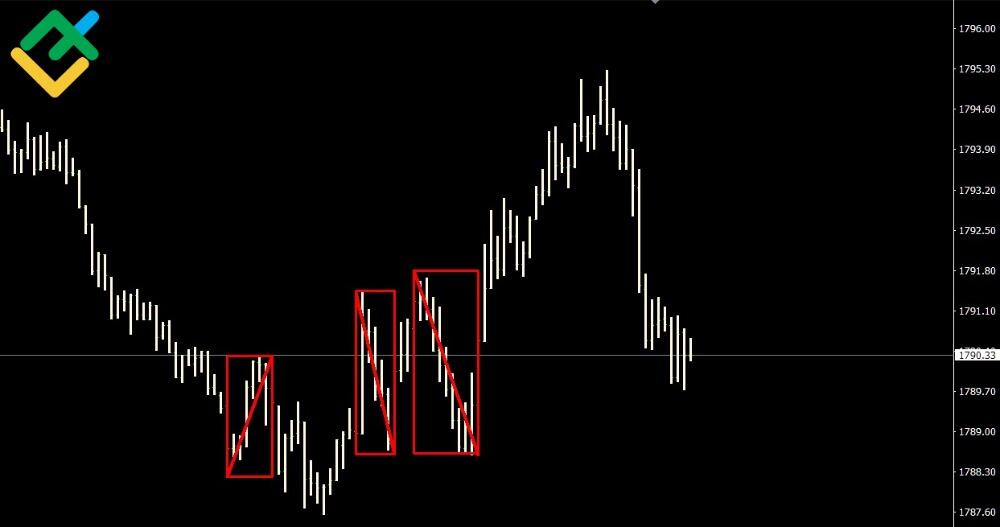
Rollbacks in gold (m5 timeframe):
Let's say you want to invest, but you don't want to pick the stocks yourself. In the case of stock indices, in particular the S&P 500, the list of companies is made up by stock market pros. Based on certain criteria, they decide which stocks will be included in a particular index.
Investing in indices already implies diversification. In the case of the S&P 500, you distribute your capital among 500 different companies. Even if some of them do not live up to expectations, the financial result will be smoothed out due to the success of the others. It should be noted that the largest capitalization does not guarantee the eternal growth in the value of shares. The process is influenced by many factors, so the index can both rise and fall.
Despite all the advantages, the S&P 500 index is not the Holy Grail. You can see this in the chart. It is also sensitive to negative economic effects, like any other financial instrument. When investing in the index, you should not be deceived by its global upward dynamics and try to buy more when it falls. After a 43% drawdown in 2000, the S&P 500 recovered within 7 years, and after a 56% drawdown in 2007, within 6 years. The coronavirus pandemic also had a significant impact: in 2020, the index lost 32% in value but quickly recovered.
With chaotic buying, you may happen to have insufficient deposit to sit out the loss and patience for a long-term holding of the position.
How is the S&P 500 Calculated?
The list of companies included in the S&P 500 index is formed by Standard & Poor's, a market research company. The main competitors are Bloomberg and Factset.
Private, insufficiently liquid, undercapitalized and financially unstable companies are not included in the index:
the minimum trading volume must be at least 250,000 shares per month;
minimum market cap - from $6.1 billion;
the company must have been profitable for the previous year.
The index is more influenced by the strongest companies.
The list of companies included in the S&P 500 index is updated quarterly. The company indicators are revised on the second Friday of March, June, September, and December. On these days, a new structure of the index is determined, which comes into force on the third Friday of the corresponding month.
Unlike the Dow Jones index, the S&P 500 is calculated not only by stock prices, but also by capitalization:
Price of S&P 500 = (a1+a2+...+a500) )/D,
where a = (market price of the company's shares) × the company's share in the index
(a1 is the performance of company No. 1, etc.)
D is the divisor chosen so that the index is not affected by changes in the S&P 500 list or indirect corporate events within companies, such as stock splits.
Some of the most influential participants in the index are Apple, Microsoft, and Amazon.
For example, Apple's share is 7.1%. The company's current share price is $155.35. Therefore, apple = $155,35 × 0,071 = 11,03.
Then we need to multiply the remaining 499 companies in the same way.
The downside of the calculation is that the top 50 S&P 500 companies make up more than half of its value. In the case of the Dow Jones index, the degree of influence of companies is limited only by the value of shares.
How to trade S&P 500 Index
These are the recommendations for S&P 500 derivatives, as SPX itself cannot be used for trading and investing.
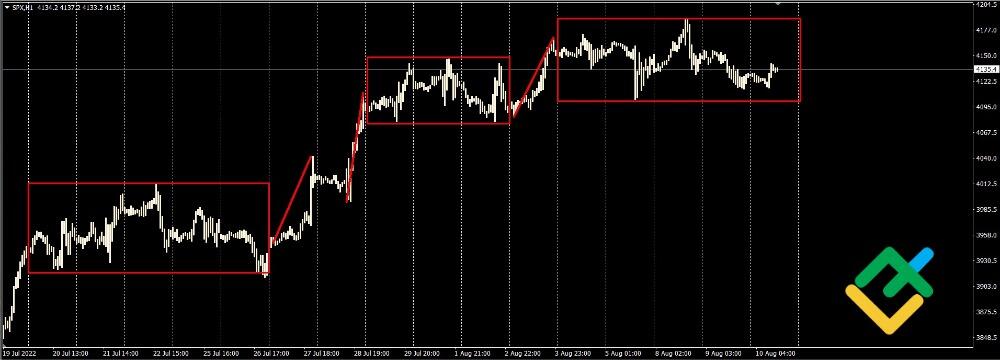
SPX trades flat most of the days of the year. Therefore, it is better to trade intraday in the counter-trend, and use higher timeframes for trend trades.
In 20 days, only 3 days were on trend:
In intraday trading, it is better to conclude trades in liquid time. When holding a position for more than a day, the time period doesn’t really matter, but it is better to work with limit orders. This should be one of the rules of the strategy you are using. A market order in illiquid times can eat up a significant part of the profit.
SPX usually has significant commissions and/or margin requirements, so it is not recommended to open a large number of trades when trading intraday, and also try not to keep several positions open at the same time.
It is not recommended to buy on a globally bearish trend and sell on a globally bullish one, even in counter-trend trades.
S&P 500 Trading Hours
The S&P 500 index trades on weekdays during the US session from 9:30 am to 4:00 pm EST, as the shares of its component companies are traded during the hours of the US stock exchanges NYSE and NASDAQ.
Its derivative financial instruments - options and futures - are traded on the US stock market (CBOE and CME exchanges respectively) also from Monday to Friday 23 hours a day, from 5:00 p.m. until 4:00 p.m. next day.
The American session is the best time for both intraday and longer-term index trading, as liquidity and volatility are at their highest during this period. High liquidity narrows the spread, while high volatility increases the earning potential of price movements.
Trading Styles
Different traders choose different trading styles. It is important to determine the style that suits your individual characteristics.
Scalping
Scalping is a type of short-term trading. The duration of the position ranges from several seconds to several minutes. Unlike classic trading, scalping stop loss is usually greater than or equal to take profit.
Derivatives like futures and contracts for difference (CFDs), which are traded almost around the clock, are better suited for scalping the S&P 500 index.
S&P 500 CFD chart, European session. The spread is only 3 pips:
With a narrow spread, you can scalp even outside the American session.
The general recommendation for scalping is to only trade during liquid times. Movements are small, so the size of the spread significantly affects the result.
Intra-day
Intraday trading involves 0 to 5 trades per day. Why not 10 or 20? Because traders are limited by the size of intraday price movement, and, as a result, the size of take profit.
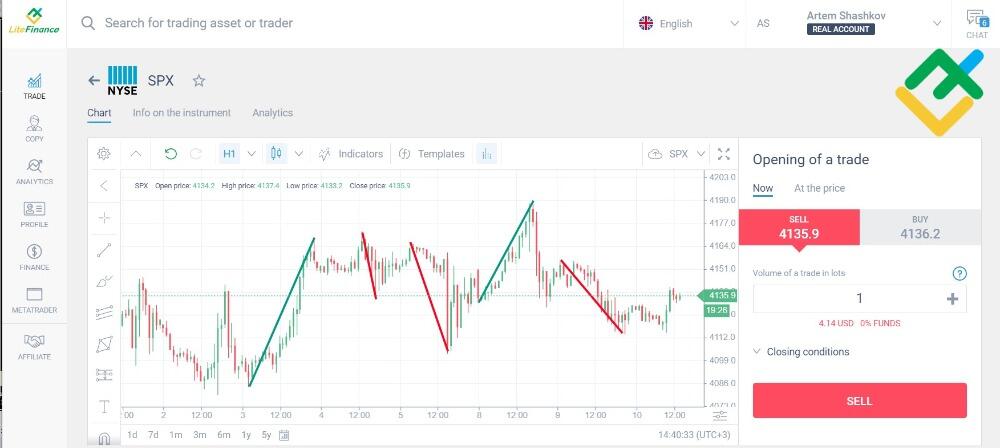
In the screenshot, I highlighted the largest movements for the last 5 days. The longest one occurred on August 3 and amounted to 847 points. And the average length of intraday movement is about 600 points:
For this reason, market entries must be selective. These will be places or moments that allow you to reasonably reduce the stop loss and give an increased probability of a positive outcome. However, frankly, this doesn’t happen a lot, so 5 trades per day is a bold and extremely unlikely assumption.
Within the day, you can trade any instruments related to the S&P 500: shares of its component companies, futures, options. The only criterion is your preference and the only recommendation is to only trade during the American session when the biggest price moves occur.
Swing trading
In swing trading, open positions are not closed within one trading day. The duration of positions can range from several days to several months.
Thus, the potential of your trades is not limited by the size of intraday movements, which allows you to set stop loss orders of a larger size.
The best instruments, in my opinion, are futures and options that are traded 23 hours a day.
Since stocks included in the S&P 500 are traded only during the American session, gaps will appear in their charts: the opening price of the next session will regularly differ from the closing price of the previous one. During the non-traded period, the amount of supply and demand for the shares will change, which is only displayed in the price chart the next day. This can result in stop losses being triggered at a worse price than planned. For this reason, it will not be possible to correctly assess the ratio of profit and risk in advance. Therefore, swing trading stocks is a riskier option than intraday trading.
S&P 500 Technical Analysis
S&P 500 is a "flat" instrument. The peculiarity of its price movements is that they occur according to the scheme “impulse - accumulation - impulse”.
The general recommendation is to use flat entry options:
"false breakout". Enter after the price returns to the range. The goal is the opposite border. Enter a short position upon a false breakdown of the upper border, and a long one upon a false breakdown of the lower border;
"upon breakout of the border." Enter after a weak rebound from one of the boundaries of the flat expecting that the boundary will be broken and the price will go into momentum. Enter a short position when rebounding from the lower border. Enter a long position when rebounding from the top.
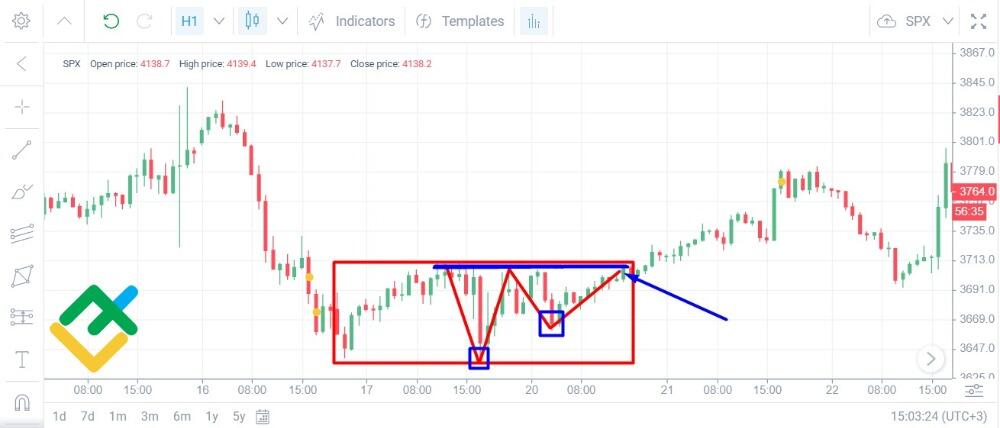
Entering short after a false upward breakout:
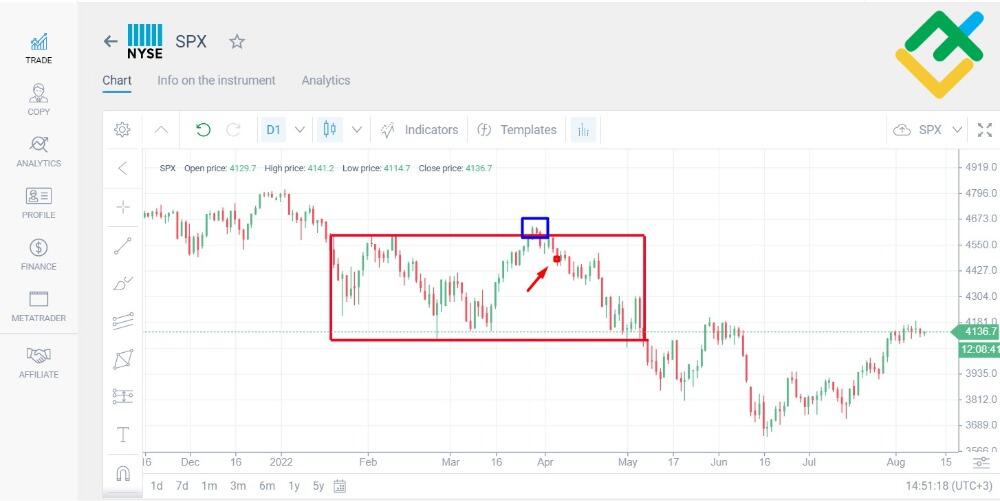
Test entry. After the second bounce from the upper level (marked in blue), the price does not update the previous low. On the 3rd approach to the level (marked with a blue arrow), a buy trade is opened:
Also, flat indicators can be used: RSI, Stochastic, Macd and others. You can start with the classics: a sell signal when overbought, and a buy signal when oversold. It is recommended to work in the direction of the trend on higher timeframes. Counter-trend signals should be ignored.
An example of two buy entries using the RSI indicator (14):
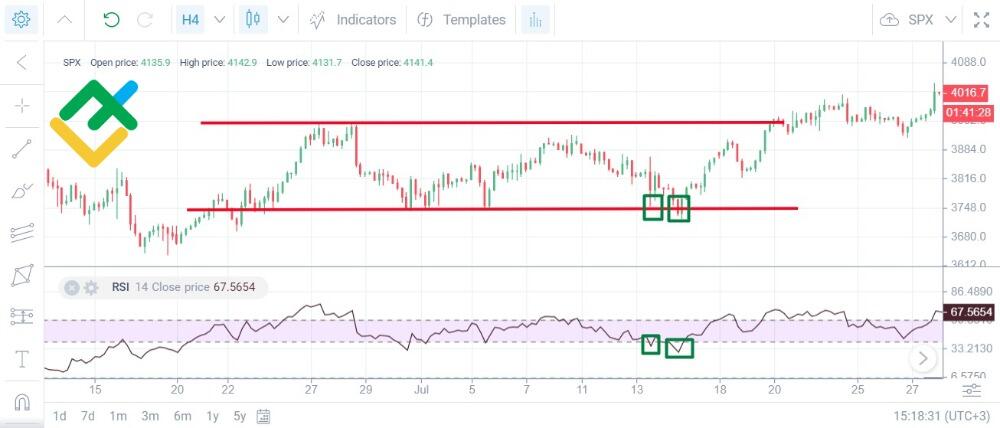
When the price approached the lower border of the flat, the indicator pointed to oversold - its value was below 40. Then the price bounced upwards from the flat border and at the same time RSI left the oversold zone (above 40). The first buy trade would have been closed by stop loss, and the second would have reached the target - the price had reached the opposite border of the flat.
I would recommend using trend strategies when trading instruments related to the S&P 500 only when swing trading on timeframes from H4 and higher. For trend trading, the Heiken Ashi indicator is suitable, as its price candles reflect the direction of the trend more consistently.
Also, for medium- and long-term trades, as additional information, you can track the VIX indicator, which is an index of S&P 500 volatility expectations based on option prices. During periods of uncertainty, investors begin to insure purchased shares by buying options. The more they are in demand, the higher their value increases and the more the VIX grows. Therefore, when the VIX is high, it is better to refrain from buying both US indices - both the S&P 500 and the Dow Jones.
One of the popular option indicators is the put-call ratio. The more pronounced the downtrend in the market, the more the general public uses put options, as they expect prices to fall further. The indicator reaches peak values at the moments preceding the change of the downtrend to the uptrend. Thus, a high ratio is a buy signal, and a low one is a sell signal.
How to Trade S&P 500 Futures?
The S&P 500 index futures (ticker - SP) are an exchange instrument that is traded 23 hours a day. The main difference from CFDs is that futures have a contract expiration date. The duration of each contract is approximately 1 quarter, i.e. 3 months. After its expiration, the exchange rate difference can be transferred to the parties and the actual delivery of goods can be carried out. The underlying asset of the S&P 500 futures is an index, not a commodity, so only the exchange rate difference is taken into account, since there is nothing to deliver.
From a trading point of view, futures are less convenient than CFDs:
you need to track the end date of the current contract and switch to a new one in time. If you choose a contract that has not yet begun, there will be no liquidity. In turn, CFD is a perpetual instrument;
CFD trading requires a smaller deposit. The margin requirement for opening a CFD trade is less than that for futures;
more leverage can be provided for CFDs than for futures trading.
But futures also have their advantages:
exchange spread is usually lower than that of CFDs, where the spread is set by the broker;
trading transparency. Futures are traded on the exchange, so the order can be seen in the order book. It is also possible to analyze trading volumes, since all orders of traders are accumulated within the exchange. CFDs are traded on the OTC market without the ability to track the order volumes of other traders.
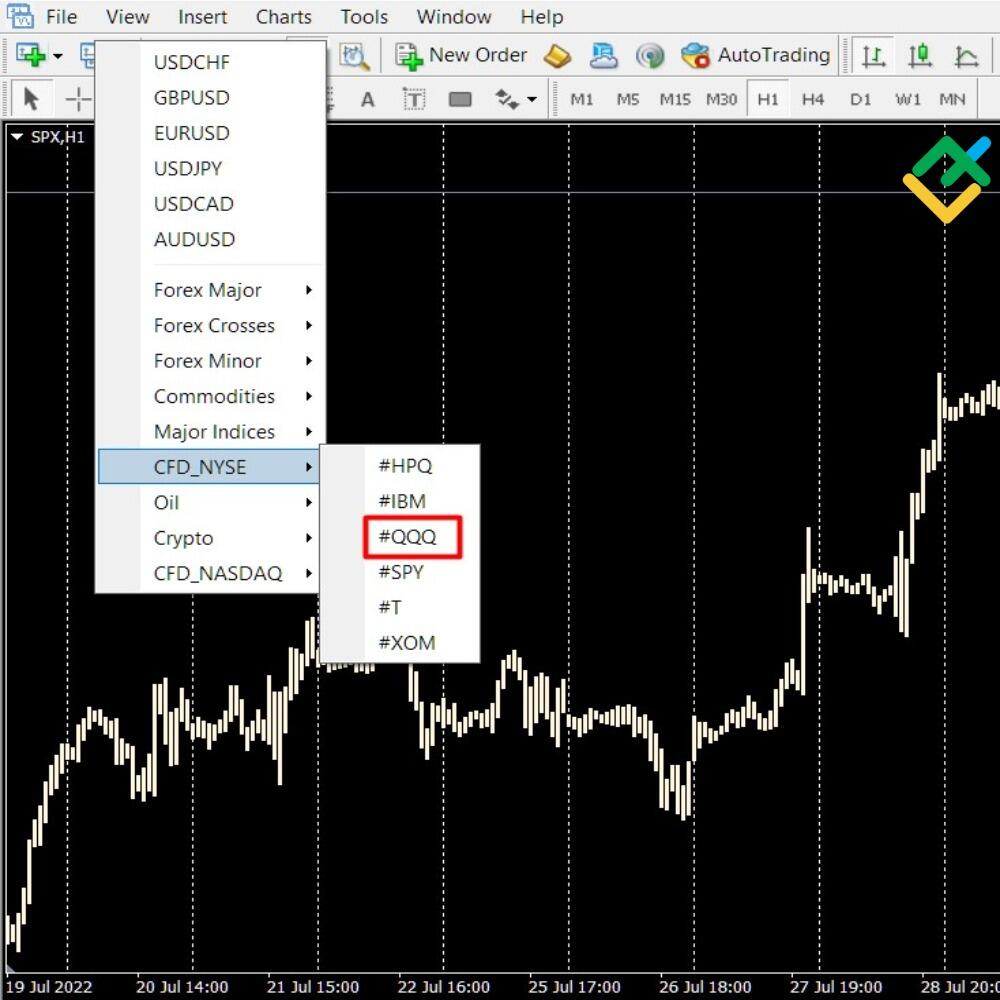
Metatrader has CFDs not only for stocks, but also for index funds (ETFs). For example, Invesco QQQ Trust Series:
If you have chosen futures as your trading instrument, you need to open a brokerage account with a stockbroker. Before concluding trades, make sure that the amount of your deposit is enough not only to buy/sell, but also for the initial margin, otherwise the broker will not execute the order you have placed.
Futures are best traded during the period when the underlying instrument is most liquid. For example, the most liquid time for the S&P 500 index will be the American session, since the shares of the index companies are traded only during the working hours of the NYSE and NASDAQ stock exchanges. Therefore, it is at this time that the index will show the largest price movements and the smallest spread. This means that the S&P 500 futures will provide the best opportunities for earning.
During the release of important news regarding the US economy, volatility increases and liquidity decreases. As a result, there is a specific risk - the stop loss execution price may be worse than planned. Therefore, when intraday trading, it is better to refrain from opening new positions or closing existing ones during this period.
For the analysis of futures on the S&P 500, you can use the same tools as for the underlying asset. They have a direct correlation, so futures are the same flat instrument.
How to Buy S&P 500 Index Funds
Imagine that some investor bought for their portfolio 500 shares of the companies included in the S&P 500 index. The total value of the shares is $1 million. Next, this investor decides to divide their portfolio into 1 million shares, each of which they call a “share” and sell to anyone for about $1. Thus, by purchasing even 1 share, the buyer becomes the owner of a share of all 500 shares. This is the essence of the operation of index investment funds, which are called ETFs.
The S&P 500 Index Fund allows you to invest in the stocks of all companies included in the index without having to buy each of them individually. Investing in an exchange-traded fund requires less money than buying even 1 share in each of the 500 companies in the index.
In the case of buying shares of each of the 500 companies, the investor needs to make at least 500 trades, each with a commission charged. When investing in ETFs, the commission is paid once a year and is approximately 1% of the investment.
What Funds Should You Invest in?
Index funds are the most balanced and low-risk among ETFs, so the expected return will not be high. The main investment advice is to try to keep costs as low as possible.
The main criteria for choosing index funds are liquidity and commission.
Liquidity must be high, so the investor can buy and sell ETFs without significant losses on the spread. Signs of high liquidity: tight spread and high daily trading volume - the more the better. Funds from large issuers, such as banks and large investment companies, have high liquidity. As for the size of the commission, it’s pretty straightforward: the lower it is, the better.
ETFs can either pay dividends on shares or reinvest them. Choose what you prefer: regular payments or a potential increase in investment capital.
Invest in ETFs only after you have compared the performance of the funds with the indices they are based on. The more the fund returns match the index, the better, as the investor can expect a more predictable result.
The most popular index ETFs are:
Invesco QQQ Trust Series (ticker - QQQ) - based on the NASDAQ index;
- SPDR S&P 500 ETF Trust - based on the S&P 500. SPDR is a trademark of Standard & Poors.
SPX trading key takeaways
Copy trading is a new investment approach
You can start your Forex journey with profits even if you haven't got any trading experience yet. Copy professional traders’ operations onto your accounts.
The S&P 500 index has smoother price movements, as some stocks included in it are smoothed out by others. As a result, it usually rises and falls in steps (flats), rather than impulses. Since the index consists of US stocks, it will have the most liquidity and volatility in the US session.
General recommendations:
The priority is flat indicators and/or types of entries (after a false breakdown or before a potential breakdown of the flat border).
It is better not to trade during the release of important news regarding the US economy due to the specific stock risk. Price spikes in the peak of volatility can knock out the stop loss due to spread widening during this period.
It is better to trade intraday at a liquid time for the index.
The index derivatives (futures, CFDs, options) have all the necessary conditions for short-term, medium-term and long-term trading.
Do not place a stop loss beyond the flat border. Most likely it will get knocked out. It is better to wait for a false breakout and put a stop loss behind it.
The SP 500 is not at its peak of volatility right now. Therefore, when trading intraday, do not set unreasonably large take profits - the price simply does not have the potential for large movements.
SPX trading FAQs
The index itself is not a trading instrument. You can only invest in a derivative instrument based on the S&P 500 index, such as futures or CFDs. The minimum condition is that the amount of your deposit must exceed the amount of funds required to secure an open position.
Look up the list of companies included in the S&P index. Then open an account with a broker that provides the opportunity to trade shares of the companies you need. The next step is to make a deposit and place the desired type of buy order.
If you are investing in an S&P 500-based ETF, the amount must at least cover the cost of 1 share and management fees. When investing in futures and options, the amount must exceed the margin and allow trades with a risk of no more than 1% of the capital.
The S&P 500 ETF is suitable for investors with small capital - the cost of 1 share fluctuates around $1. In the event of an increase in the price of the index, the investor will be able to receive income from investing in ETFs equivalent to the size of his investment, but minus the manager's commission.
S&P 500 futures can be traded 23 hours a day on weekdays. Register with a futures broker, make a deposit and place a buy or sell order during the trading period. The deposit amount must be greater than the margin requirement for the S&P 500 futures.
Depending on the instrument, the amount will be different. There are ETFs based on the S&P 500 with a minimum investment of $1 or more. The minimum amount to invest in S&P 500 stocks or S&P 500 futures will be equal to the market price of each of these instruments.
Yes and no. To trade SPX derivatives, you will need access to exchange provided by the broker. But you can buy shares of any funds that include shares of companies from the S&P index. You don’t need a broker for this.
The SPX index is currently trading at 7 594.4 USD on 01.06.2026.
Since the beginning of 2022, the S&P 500 has been in a downtrend globally. Analysts predict a further fall before the end of the year due to recession risks.
Price chart of SPX in real time mode
The content of this article reflects the author’s opinion and does not necessarily reflect the official position of LiteFinance broker. The material published on this page is provided for informational purposes only and should not be considered as the provision of investment advice for the purposes of Directive 2014/65/EU.
According to copyright law, this article is considered intellectual property, which includes a prohibition on copying and distributing it without consent.