MyFxBook is a platform that is used as an online automated analytical tool for your forex trading account. There are many flaws, but MyFxBook has been so far the only full-featured web service where a trader can conduct a full mathematical and statistical analysis, and an investor is to get acquainted with the trading performance of traders with a lower risk of dealing with scammer. MyFxBook has other interesting functions that turn the service into a full-fledged analytical tool. From this review, you will learn about the platform capacities, learn how to connect an account and analyze trading activity on it; I will also describe the drawbacks of My Fx Book.
The article covers the following subjects:
- What is MyFxBook?
- How a trader can use MyFxBook app
- How an investor can use MyFxBook app
- How to use MyFxBook
- 1. How to connect MyFxBook to MT4
- 2. How to analyze an account trading performance with MyFxBook
- 3. Ways to recognize fake and real accounts on MyFxBook
- Advantages and disadvantages of MyFxBook
- Conclusion on using MyFxBook
This article aims at helping the readers make up a general opinion about this service MyFxBook com. If this overview becomes a user manual for the platform, add it to shortcuts and write what else should be included. I will extend it according to the wishes of my readers!
What is MyFxBook?
What programs do you use except for the platform? I’m sure most traders use calculators to calculate the lot size or stop out, the economic calendar. As you develop your trading skills and become a more advanced trader, you start keeping trader journals, employing various programs for creating or testing Expert Advisors and indicators, scripts for the platform. At some point, there comes a need for a single tool that would combine multiple basic functions often used by the trader, so that it can replace a dozen of more specified programs. This tool is called a monitoring service.
Account monitoring service is a platform that allows you to manage multiple forex accounts and analyze your trading activity. It also provides an access to analytical materials enables you to publish your account statement. The fully functional services of this class are not numerous. One of the most famous is FX Blue, who tester for MT4 I described in the previous overview. It has all the most necessary functions, but in terms of functions, capabilities, and visual design, it is not as convenient as a less popular monitor, MyFxBook.
The idea to develop MyFxBook appeared in 2007. It took about 2 years to launch its first version. Users get access to the service in 2009, but it didn’t become very popular at that time. The problem was the lack of full functionality and the main idea of the platform. Originally, MyFxBook was designed as an analytical tool suitable only for MT4 and MT5. Only in 2014, the developers got the right idea of what such a service should be like. Having received a license (support) from the Cyprus regulator CySEC, MyFxBook was recognized by traders. In the same year, the functions of copying transactions were added, the analytical part was improved.
MyFxBook is a platform that combines the functions of a trading platform, trader journal, supplemented with advanced analytical tools, forex analytics and forum. There is everything for comfortable trading, analyzing your trading systems and accounts, sharing ideas with other traders. Advanced traders optimize their forex trading systems and track their trading performance, investors and managers find each other, and MyFxBook provides a guarantee, security, and transparency of the mutual interaction. It supports such trading platforms as MetaTrader 4 and 5, cTrader and others, the full list is on the official website.
How a trader can use MyFxBook app
- It is a kind of business card of an account manager. My Fx Book is a brokerage independent platform that ensures the interests of its users. A trader can make their pages publicly accessible and show their audited trading results (sending the password to the investor, public access), where potential investors will see all the statistics without the possibility of interfering with the trade. An investor can get a backtesting report from MT4, but in terms of security and reliability, MyFxBook outperforms.
- You can analyze your account with its advanced statistical analysis. There are much more capabilities of sorting, statistically analyzing different kinds of performance data than in MyFxBook the MT4 tester. The matter is if a trader is willing to study it or he/she will accept the capabilities of MetaTrader.
- You can save statistics for earlier periods. There are situations when, based on your account type, MT4 saves only a few months of the trading history. In MyFxBook all the history since the account was connected is saved.
- Trader community. MyFxBook connects the clients of over 100 brokers, it is a kind of social platform, forum. I sure everyone will find there something interesting.
There also supplementary tools like calculators, simulators and many others. I will describe the tabs in detail further. You don’t need registration to see the trading statistics.
How an investor can use MyFxBook app
- Investors get an access to hundreds of forex trading systems (both manual and algorithmic), can subscribe to trading signals, take part in the discussions on any topics. This is an international platform where you can find many investment options.
- MyFxBook tracks fake accounts and conducts a thorough verification of its users. Investors can ask for an investor’s password and thus get access to detailed information on a trading account. Investors decide on their own how to use this information. For example, you can assume the strategy type based on particular equity changes, you can evaluate the risk level, or analyze the trading performance.
How to use MyFxBook
Myfxbook is a service, which performs all analytics of your trading activity automatically. You only need to provide a service with data of reports from the terminal. The analytical section looks like a forex trader profile, but there are much more indicators.
MyFxBook functions and capabilities (except for the account monitoring that will be described in a separate part):
- Economic calendar. It is in the Home tab in the top dashboard. It is a standard calendar that can filter the events based on dates, importance and the trading asset. You can’t filter the events according to the news type (for example, only the releases or only the news of a central bank)
- MyFxBookcalculators. There are five calculators: Fibonacci Calculator, Margin Calculator, Pivot Point Calculator, Pip Calculator, MyFxBook Position Size Calculator. They are also found in the Home tab.
- Autotrade. It is an account mirroring service where you can copy traders who connected their accounts to MyFxBook. There is a separate tab in the main menu. The copying is launched in a common way. Investor registers an account with the broker that is MyFxBook and enables automated copying. You can first test the signals copied on a demo account. To become the provider of trading activity, you must have drawdown of no more than 50%, have an account with Myfxbook with at least 3 months history, conduct at least 100 trades for three months and have an account balance of at least $1000 for the last 3 months of trading. Copied traders mustn’t use employ Martingale or Grid trading, but I don’t think anybody supervises this condition.
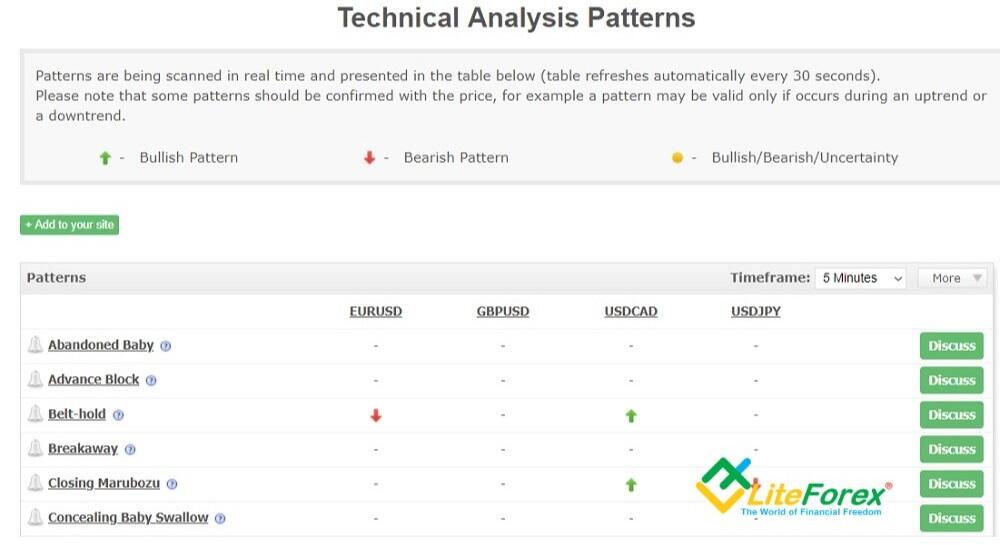
- A set of tools for market analysis (the Market tab). There are some useful options: analysis of forex currencies volatility in real-time, where you can set different filters, data on the liquidity and the correlation of currency pairs to each other. There are some ideas on trading technical patterns for 4 major currency pairs, MyFxBook tracks more than 30 patterns and informs a trader about them (table is updated every 30 seconds).
- Forex brokers spreads. The information is in the Brokers tab. This tool allows you to compare the spreads on a particular instrument, offered by different brokers connected to the MyFxBook network. It will be useful to those who trade with "sensitive" strategies, where the spread covers most of the profits.
In the main menu, there is the Systems tab. It provides the list of all trading systems registered on the platform. This menu will be of interest most to investors, who can set different filters to look for a suitable forex strategy.
Other sections of MyFxBook are a forum (communication is mainly in English), trader community that also contains general statistics on the transactions performed on the platform, contests.
1. How to connect MyFxBook to MT4
In general terms, the procedure looks like this. You, as a trader, have a real account opened with a broker. The broker should be the partner of MyFxBook (otherwise you won’t be able to synchronize your account with the platform). You register and login MyFxBook, get access to your profile and add your account. You will trade with your broker and your trading statistics will be automatically shown in MyFxBook when you synchronize your account. Investors can see your portfolio. Both the trader and the investor can analyze whatever they want by means of MyFxBook statistical analysis.
In practice, it looks like this:
- You register on the website. Here, everything is as usual: you enter your email, password, confirm the registration with the letter that you receive on your email. You don’t need any additional verification as on FX Blue.
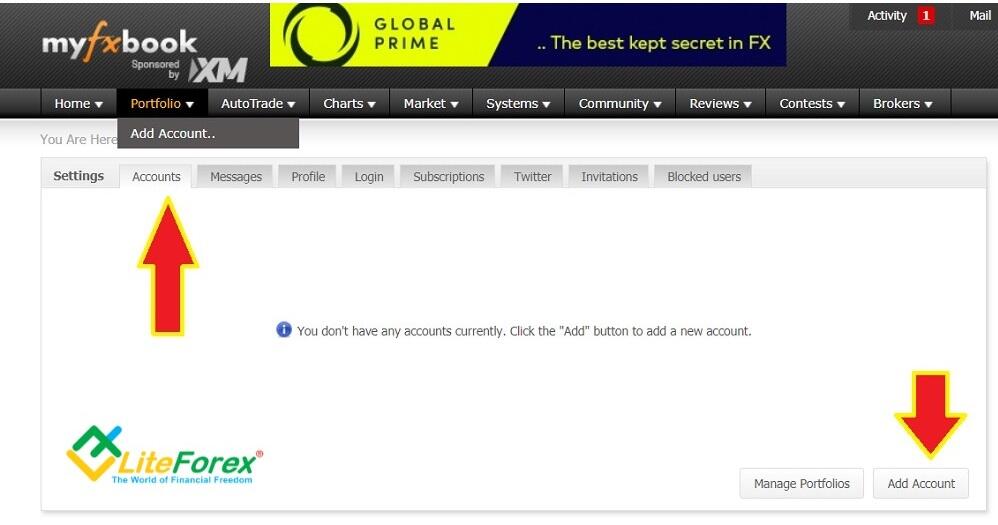
- After MyFxBook sign up, enter the Portfolio ->Accounts section in the top menu and click on the Add Account button.
Everything is clear with a list of trading platforms offered, I’ll only specify a few points.
- MT4 (EA) - the data are sent from the account to the server by means of an Expert; MT4 (Publisher) – the connection is set up by means of FTP report;
- MT4 (Auto Update) – MyFxBook connects to the account by itself using the investor’s password. According to the option chosen, follow the instructions, entering the data or installing the apps.
- The simplest method is to choose MT4 (Auto Update), it will take you about 15 minutes. You only need to follow the directions. The monitoring is updated automatically, doesn’t matter if the MT4 is switched on or not (if the trader is online or offline).
- A more complicated method is using MT4 (Publisher), but it is recommended. Select the Metatrader4 platform (Publisher) and specify everything necessary to be filled in (you may not indicate an investor’s password, but in this case, your trading history will not be confirmed). Go to the Settings page once again, look for our new account and remember its number. Open the MT4 terminal and click on Tools -> Options -> FTP. In the FTP server box, enter ftp.myfxbook.com, the FTP path is left blank, in the FTP login box, enter the account number assigned by MyFxBook. Click OK and that’s it.
If you have any problems with the account registration and attaching it to the platform, write in the comments. Now, you can use your profile to enter your personal details, subscribe/manage subscriptions, share your monitoring details with the Public, block users, and so on. I won’t go too far into details on the profile functions, everything is clear based on the menu sections. I would rather deal with monitoring sections in more detail.
2. How to analyze an account trading performance with MyFxBook
Let us study the account analysis from the point of view of a potential investor. I will take a random account as an example and analyze all the statistics presented. To do it, click on Community →Strategies and select any strategy. You don’t have to register.
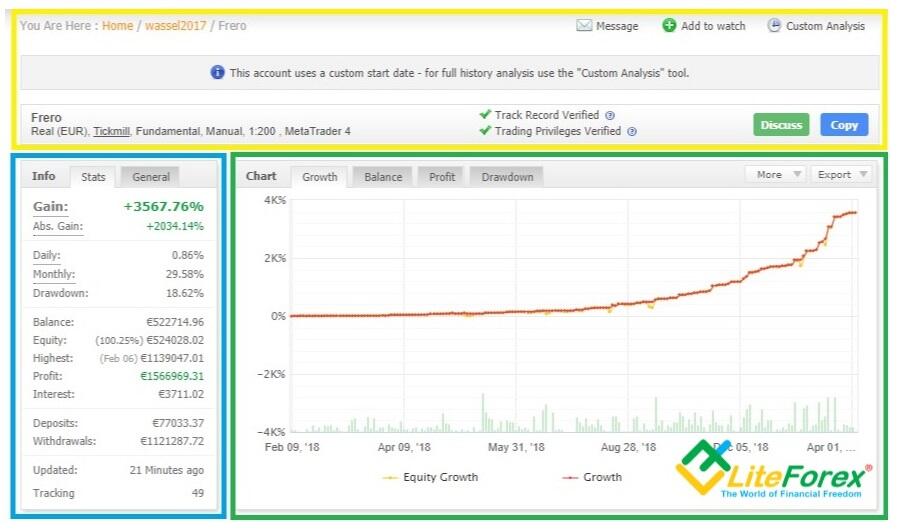
2.1. General information block (yellow box)
It displays the information about:
- Account type (real, cent or demo);
- Broker;
- Type of analysis applied and the trading method (in this case, trading is conducted manually, according to fundamental analysis, i.e. without any Expert Advisors).
- Leverage
- Trading platform
And here, there is an obvious flaw. For example, I could not find a history of changes to this information. A trader will hardly change the trading platform, but the leverage size is surely not a constant value. And if this is the maximal leverage, what does this information suggest to the trader?
Next comes the information on the trader data verification. In will describe it in more detail below in the part about how to distinguish a real monitoring report from a fake. The Copy button allows you to automatically copy trades of the given trading strategy. You just need to open an investor account with any broker supported by MyFxBook.
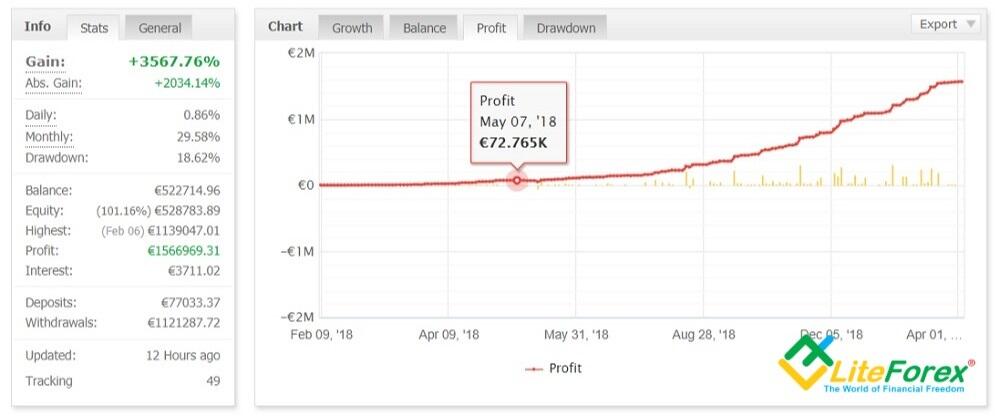
2.2. Statistical data block (blue box)
- Gain – profit as a percentage, including reinvestment, made since the start of trading, regardless of the withdrawal or topping up of the account. Abs. Gain is a simple deposit increase without regard to reinvestment.
- Drawdown – maximal drawdown during the entire trading history. The formula to calculate the current drawdown is the current/maximal equity values ratio.
- Balance – current funds on the account
- Equity – the result (current amount) of all positions, including opened. If the value is over 100%, it means that the positions currently open are yielding profit, if it is less than 100%, it means that the current trades are losing. If the value is 100% (equity=balance), there are no positions open at the moment.
- Highest – maximal funds that have ever been on the account (the date is in brackets).
- Profit – the total yield of closed positions for the entire period (total result).
- Interest – total swap costs
- Withdrawals – total amount withdrawn from the deposit
- Updated – the time of monitoring update. In theory, it should be automatically updated at least once in a few hours, or even a few times in an hour. If it hasn’t been updated for a longer time, it means that there are either problem with the account synchronization or the trader switched the monitoring of the main account (changed the settings). Both situations should put the investor on the alert.
- Tracking – the number of MyFxBook users who added this monitoring to Favorites, that is, expressed more detailed interest in it.
2.3 Chart block (green box)
Not everyone can easily understand numbers. Charts are more convenient for perception, as they visually present statistics on the historical period. There are four types of charts in MyFxBook:
- Growth. It shows statistics for balance and equity in percentage points. In theory, they should be equal, but you see yellow zigzags in the above screenshot. It means that there are sometimes losses because the trader may hold the positions for too long or use grid trading or Martingale. At the bottom, of the chart, there are columns that represent the daily volume of trades. If you compare it with the changes in the deposit amount, you can roughly define the type of trading strategy applied. In More tab, you can switch the bottom chart from lots into pips. Export tab allows you to export the chart data into the needed document (HTML, CSV, PDF).
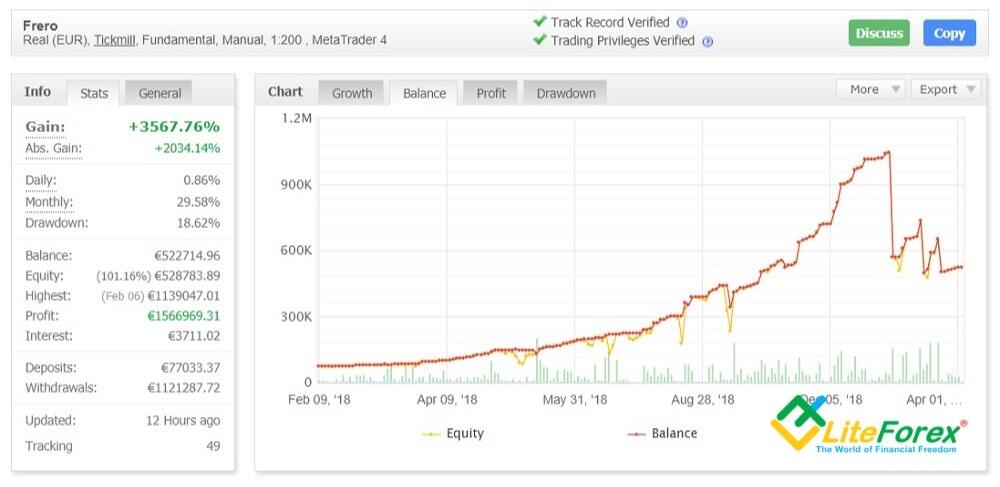
- Balance section represents balance and equity in money terms, that is, the amount of money on the account with and without consideration of the open positions. In theory, a lower balance on the account may suggest a loss, so this section should be analyzed together with the sections of Growth and Profit. If there is a divergence (there is a profit, but the balance is declining), it means that some money has been withdrawn from the account, it is important information for PAMM oriented investors. This information is available in public PAMM monitors. For non-public PAMM accounts, it can be seen only on MyFxBook. If the yellow line is deviating, it means that the holding time is too long.
- Profit. The chart presents the profits made. It provides little information, but it still can be of use. If the trader doesn’t top up the deposits or withdraws the money, the chart should look like the one in the growth tab. There shouldn't be any divergence between the charts. If the trader even disconnects the account from the monitoring, withdraws the money and then connects it again, MyFxBook statistics will show the real balance, and the line will immediately depict the withdrawal. Another argument that the chart is useless is that the profit of $20 with the deposit of $100 is 20%. The profit of $2,000 with the deposit of $20,000 is just 10%. Although the profit is higher in the second case, it will be less in percentage terms.
- Drawdown. It is the amount of the drawdown, expressed in percentage. It can be rarely found in the brokers’ account monitors. It makes sense to study the drawdown chart together with the economic calendar and with the Growth chart, where the dates of deep drawdowns may match to sharp drops in equity. Go back to the screenshots of the Growth tab and the Balance tab and pay attention to the dates of August 14th and September 26th. There is a clear decline in equity values.
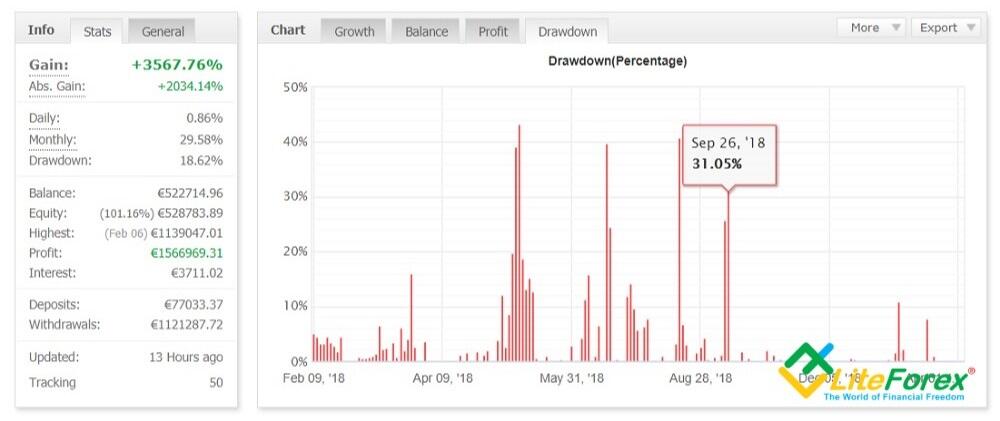
In my opinion, the first and the last blocks are the most informative of all the four ones. The first provides the information on how long the trader holds the positions open, if he/she uses Martingale, how often she/he tops up the deposits or withdraws the money. The drawdown shouldn't be over 50% (ideally, it should be less than 15%), it should last for too long. Based on the drawdown in the above figure, the strategy engages quite high risks but remains within the normal range.
Note that the drawdown is more than 50% in the last screenshot, but in the left block, the maximal drawdown is 18.62%. Such mismatches should be checked by the investor, as they should make you suspicious whether the trader performs so well. In the given example, the explanation is that these are different types of drawdowns.
- On the left, there is the maximal drawdown at the moment of synchronization
- The Drawdown tab shows the drawdown for closed orders on different dates.
This is an obvious flaw of the MyFxBook developers. With the account re-connection, it shows the maximal drawdown that was tracked at the moment of the account re-connection. For example, a trader got a 40% drawdown, but then he/she managed to go back to the level of 18.62 (like in the screenshot above). The trader disconnects the account from MyFxBook and connects it again afterwards; and the service shows the maximal drawdown of 18.62%, while the chart shows a 40% drawdown for the closed day.
According to the MyFxBook instruction, the Drawdown is calculated based on profit/loss ratio for the closed positions. So, an investor can only see the drawdown of the balance, while the float loss (including open positions) is not calculated by MyFxBook. There is another example of the data display flaw. The trader has only recently found out about MyFxBook. After connecting, the service will show a drawdown only since the moment of the account synchronization. In other words, the investor cannot see the real value of the maximal drawdown on MyFxBook.
2.4 Trading block
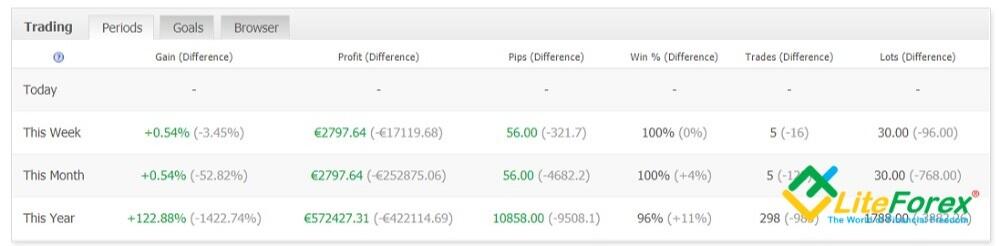
2.4.1 Periods block
In the Periods block, there is trading statistics for a few periods compared to the results for the previous period.For example, in the line “This Year / Gain”, the yield per year is 122.88%, the difference between the current result and the past is indicated in brackets. That is, the yield for 2018 was 122.88 + 1422.74 = 1545.62%. Important: the gain is compared over the “year / year” period, and not the yield for 12 months. 122.88% is the profit for the first months of 2019.
Interpretation of the columns:
- Gain - profit at the moment since the beginning of the period (day, week, month, year) in percentage.
- Profit - profit in monetary terms.
- Pips - price units (four decimal places, some broker offer currency quotation in 5 digits).
- Win - the percentage of transactions closed with the profit.
- Trades - total number of transactions.
- Lots - total volume of trades for a period.
This information helps an investor make up a general overview of the forex strategy performance and compare the profits for a week/month /year.
2.4.2. Goals tab is an automated, real time way of tracking your goals progress over different time frames
You can enter a few goal types across several timeframes. For example, you can set a requirement that the yearly yield at 30%. However, I don’t see any sense in it. The strategy will yield the profit that it is able to, and the goals set in this section won’t influence anything.
2.4.3. Browser tab
It is the trades browser. If the monitor owner opens an access to the chart, you can see here all trades at once: open orders, closed orders, the entire trading history in any timeframe. The matter is whether the trader will want to unveil this information, as it basically represents the trading strategy that can be understood after analyzing the entry/exit principle. However, the tools are not provided in this window. If the investor even sees the complete transactions in the chart, it is not possible to attach patterns or indicators. The rules of the trader's strategy remain unknown. I invite you to discuss in the comments if it is good or bad in terms of the transparency.
2.5 Advanced Statistics section
2.5.1. Trades
This is the next section that looks like the MT4 backtesting statement. It presents the profitability of trades, the total commissions amount (except for swap and spread), average win/loss, the best and the worst trades and so on.
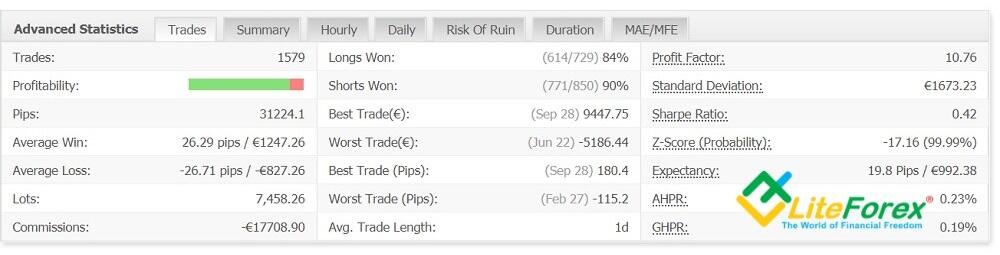
Most parameters are clear by their names, I’ll just explain some of them:
- Profitability. The band displays the ratio of winning (green) and losing (red) trades. The indicator itself doesn’t mean anything, there may be many winning trades with small profits that are exceeded by a few losing trades. The parameter is analyzed together with the average win/loss ratio. The approach to defining an optimal ratio is subjective. But it is obvious that the ratio, for example, 20/80 in favor of losses (20 winning trades compensate the loss in the total) means either trading the Martingale way or the imbalance of the system. The ratio of 90/10 in favor of winning trades may suggest that the holding time is too long.
- Average Trade Length. This is the average holding time. The parameter defines the trading strategy type (scalping, day trading, long-term trading strategy).
- Profit factor. This the amount yielded by winning trades divided by the amount of losses yielded by losing trades. It represents the gain, which accounts for 1 USD of loss.
- Standard deviation, Volatility, represented in US dollars. There is no percentage representation, so, it is another flaw of the MyFxBook developers.
- Sharpe Ratio. I described Sharpe Ratio in one of the previous articles. You can learn about what it is, what is needed for, how it is calculated, and how it is used to compare the efficiency of trading systems in this review
- Z-Score. This the probability of a series of trades with the same result. The probability of 99.99% in the screenshot above shows that a profitable trade is highly likely to be followed by another profitable trade, and a loss-make one will be followed by another one with the same result.
- Expectancy. It displays the average expected profitability of one trade expressed in pips and in the deposit currency. 19.8 pips in this strategy is an excellent performance. It is thought account must studied in more detail if the expectancy is over 10 pips.
What is AHPR and GHPR is unclear. These parameters are briefly mentioned in an article on the MQL5, but it hasn’t explained anything. For example, the GHRP formula: (current balance at the current time – initial balance ) ^ (1 / number of transactions). But what it means is unclear.
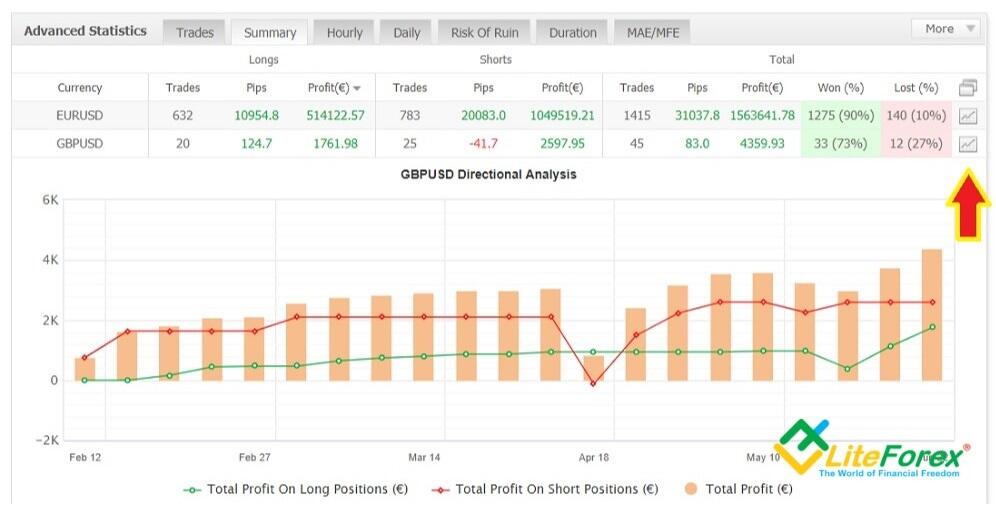
2.5.2 Summary tab
It provides statistics on winning and losing trades (in pips and dollars) indicating the amount in the context of long and short positions (currency exchange in one direction or another). You can display statistics in a graphical form, you need to click on the icon at the end of the line. Statistics is given for the entire account, that is, for all currency pairs, for which positions were opened.
2.5.3 Hourly and Daily tabs
The charts of these tabs show the number of transactions in the context of hours and days. Information tab, which allows to make a conclusion about the time when transactions are made and what type of strategy is used. For example, if the largest number of transactions falls at 9-10 am each day, then we can assume that the trader is trading mostly in the morning using scalping strategy.
2.5.4. Risk of Ruin tab
Another unusual tab, which I recommend to skip, as there many unclear points about it. It shows the risk of losing a particular part of the deposit and the number of trades that should be consecutively entered, so that this part of the deposit will be lost.
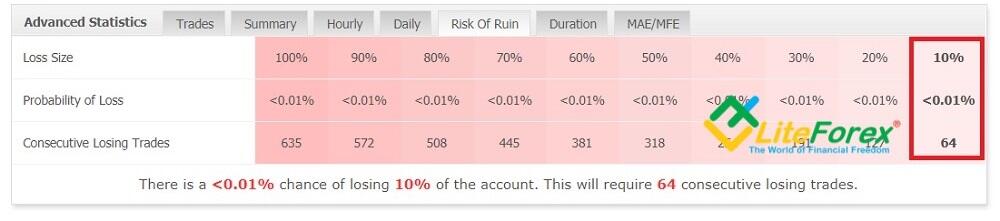
Based on the figure above, to lose 10% of the deposit, one needs to execute 64 consecutive losing trades, which is hardly possible. Let us go back to the beginning of the part of the article, where there is a screenshot of the working space divided into three blocks. The blue box highlights the section where the drawdown parameter is 18.62%, which doesn’t match to almost a zero risk of losing 10% of the deposit.
On the Internet, I once come across such block, where in the entire 3rd line there was an infinity sign, that is, the risks of the strategy were less than minimal. The explanation for this is curious. The formula for calculating the risk of ruin is simple: the current amount of the deposit is divided by the average loss value from the Trades tab. If a person does not exit losing trades but just holding them on, then there will be no losing trades in the statistics. That is, the denominator will be “0”, hence the sign of infinity appears in the statistics. Well, it is quite logical that when withdrawing/topping up a deposit, the level of risk will change.
Nonsense? Of course, it is nonsense. The minimal risk, showed in the statistics, turns it a very high one in practice. Besides, traders may manipulate their performance analytics, because MyFxBook formulas don’t take into account many factors.
2.5.5. Duration
Unlike the previous section, this tab is quite useful, though its analytics still leaves many questions. It displays the statistics that show a few moments:
- The trade duration. The more to the right is the dot in the chart, the longer the trader holds a position open. In the studied example, the trader is mostly trading intraday, exiting the trades within a few hours (less than 24 hours). The positions that are held open more than a day, are in most cases closed within a week.
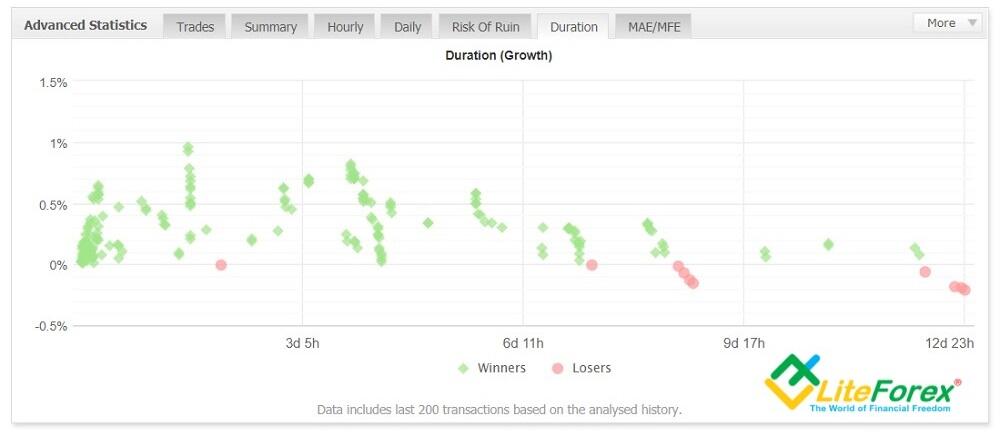
- The presence of a forex trading system. There more there are green dots concentrated in the same area, the better. This means that the trades stick to the same trading strategy, not holding the positions open longer than it is suggested by risk management, uses stop losses and take profits, which close positions at the expected level. The above figure shows a trading strategy that consists of 3 parts. A half of trades are exited at a level up to 50 pips during the day. Another level for target profit is 100 pips, the traders don’t risk more. The trades that haven’t been exited before, are closed in 1.5 days since they were opened, or at the end of the week. Only a small part of trades is held in the long term, and exactly among these trades, there are losing ones, that is because a stop loss is at a short distance, up to 30 pips.
The graph’s flaw is that it displays the information only on the last 200 trades, it doesn’t provide an access to the history of the previous trading period. The Advanced statistics tab doesn’t also provide any information on the maximal amount of consecutive wins/losses, that is provided even in the MT4 tester. And one more question that I don’t understand: if you look at the Trades tab of the same block, the percentage of losing transactions is 10-15%. That is, 20-30 from 200, taken into account. In the screenshot, there are obviously fewer. I wonder if such obvious inconsistencies are a flaw in MyFxBook service itself, or it is the trader’s attempt to adjust the results. Although both of these options do not work to the advantage of the platform.
2.5.6. MAE/MFE tab
The tab shows the maximal possible loss or profit. But what can this information suggest to an investor?
2.6 Trading activity block
It displays detailed information on each trade, like in the MT4 backtesting report, where the general statistics is followed by an expanded list. It specifies the assets, the trade type, open/close type, net profit and so on. There are separate tabs for open positions, for all the positions and for pending orders. If we can only assume the trader’s strategy based on the previous tabs, there we can see everything concerning the trading system: how pending orders are opened, if trailing stop is used, is the holding time too long, and so on. It remarkable that in the given example, the trader has hidden all the information.
2.7 Monthly Analysis block
It a very informative tab. The General tab displays the total result for the month of this year and the previous year. The more stable is trading performance, the better. There can be another variant, come months may be losing, standing out of the monthly statistics, and some months, on the contrary, can be especially profitable, This suggests that a high-risk strategy is applied.
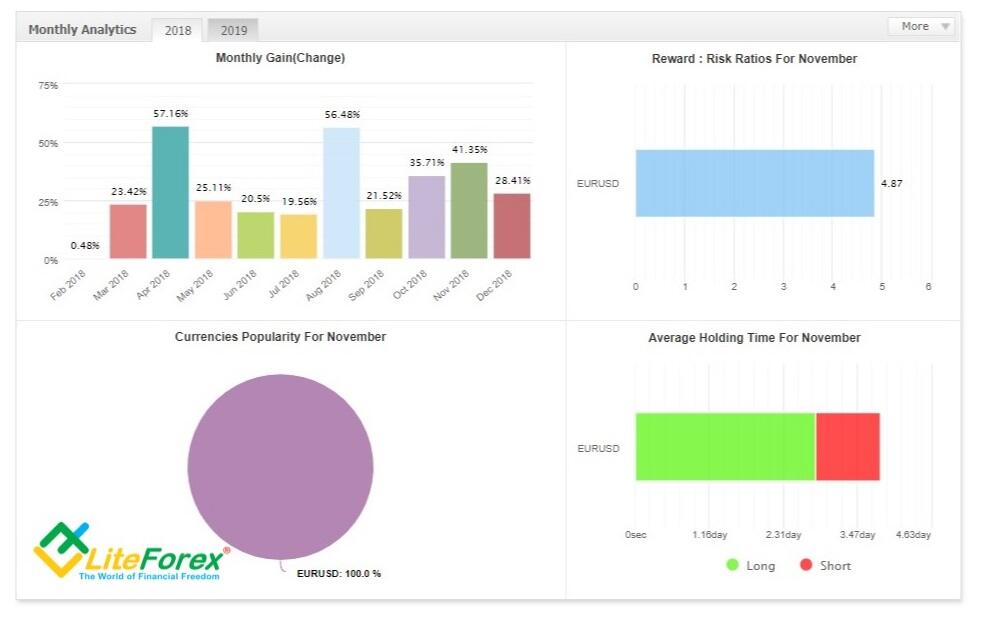
In this case, the trader shows consistently high profits without a single unprofitable month. Surprisingly, but as it is. If you click on a particular month, even more detailed statistics will appear. Maybe someone will be interested in it. The main thing is that it should correspond to reality.
2.8 Custom Analysis block the last block of the account monitoring
Go up to the very top, where it is written, “The account uses a custom start date – for full history analysis use the “Custom Analysis” tool
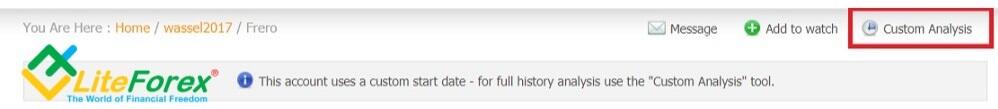
All previous statistics were relevant for the entire trading period. In the Custom Analysis, the investor can specify any time period. For example, the last three months, after which the monitoring page displays statistics only for a specified period of time. In addition to the time interval, statistics can be detailed by other parameters, for example, a particular currency pair. Filters can be found in the tabs "Timing", "Trade".
Summary. MyFxBool monitoring provides quite full statistics, but it isn’t perfect although. There are clear contradictions, there are parameters missing, or there are tabs that are ample and not informative. I believe, that MT4 statistics with a possibility to process it in the trader journal will quite do, but for especially meticulous analysts, MyFxBook will be interesting.
3. Ways to recognize fake and real accounts on MyFxBook
Trading is a good way to generate income, and each trader, especially a beginner wants, to get this tool to make money.
- Investors want to find an experienced money manager, who can provide convincing results of his/her work
- Beginner traders want to copy trading behavior of advanced traders, buy efficient Expert Advisors.
Scammers want to get the money and disappear. They apply different schemes: fake backtesting reports, testing/trading on a demo account and so on. Most of these schemes are blocked by MyFxBook, but still you must be aware of how to recognize a fake account
You click on Community →Strategies, select the needed system and first of all look at the following information (it is highlighted with a red box):
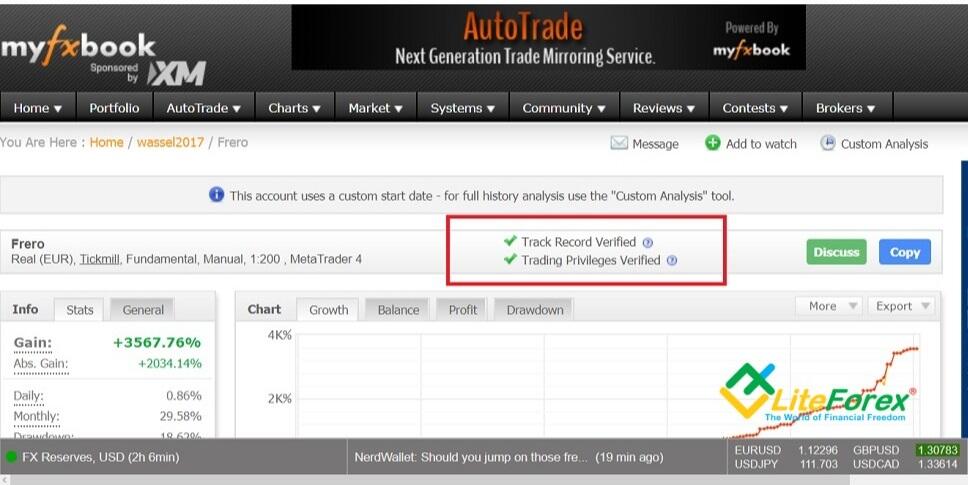
- A green tick saying “Track record verified” must appear at the top of account, which shows that the information provided on Myfxbook matches broker’s information. This means that all trades, deposits and withdrawals displayed here are confirmed by the broker. It also tells you if the account is real or just a demo.
- A green tick displaying “Trading privileges verified” is also another identifier at the top of account. This means that the account holder providing these results is actual person and has the rights to use the account for trading. It is a way to prevent others from using someone else’s account after having somehow obtained its’ password. There can be a situation when a scammer creates monitoring of someone else's account, passing it off as his own. That is, the trader, without knowing anything, is trading, and the fraudster makes a statement from this account and sells strategies/Experts. MyFxBook blocks this by requesting confirmation that the account holder and monitoring owner is one and the same person. So, Some of the work on controlling the traders’ integrity has already been done by MyFxBook. At least, I’d like to think so. After all, there haven’t been any complains about this MyFxBook concerning this topic, unlike the mangers monitors on brokers’ websites, where they are not verified so carefully.
What else you should pay attention to:
- Check the broker. The platform is international, so an investor from Canada, for example may know nothing about a Belgian broker. Visit the broker's website, read comments, analyze the regulation, click on tabs, it won’t take you more than 20 minutes.
- Account age. You will often find an account that has performed well for a couple of months and then gone bust. That's why you need to look for accounts with long trading history, because it's hard to fake success for a long period, for example, 2 or 3 years. Of course, anyone who manages to profit for a longer time is a true forex master.
- The last date of monitoring update.
- The equity curve shouldn't be under the balance curve (if it is not so, the trader is likely to trade the Martingale way).
You should also analyze the trading history, statistics, so all the things a potential buyer/investor should always do when evaluation the trader’s performance.
Advantages and disadvantages of MyFxBook
MyFxBook has appeared relatively recently. It is still being developed and upgraded, but it is far from being perfect; although, following the annual updates it becomes more and more efficient. I’d like to stress that I am going to write about the advantages and disadvantages existing at the moment. In future, everything may change.
MyFxBook advantages:
- There are no analogs of such class. The chief advantage of MyFxBook is that there no platform of the same type that have the same capacities. Trading after all is a rather specific business and investments in developing high-quality software are not always economically justified. Here I can even give an example of MetaQuotes, which has not been trying to eliminate the well-known MT4 bugs for a long time. It is similar with MyFxBook. This monitoring service fully satisfies the requirements of most traders and there is no point in creating a competitive analogue, it will not pay off.
- Free access to its functions. It is reasonable. If the developers charged money for the access to the platform capacities, traders would prefer to use standard programs that are ample and free on the Internet.
I suggest you estimate other merits on your own, as everyone has their own approach to trading.
Disadvantages MyFxBook:
- Not everything works correctly. When reviewing each tab of the account monitoring, I pointed out some inconsistencies where the data in different places clearly contradict each other. This is also a developer flaw. When you only start using MyFxBook discrepancies in statistics may confuse you, only when you get some more experience, you will understand which tabs are incorrected and which should be ignored at all.
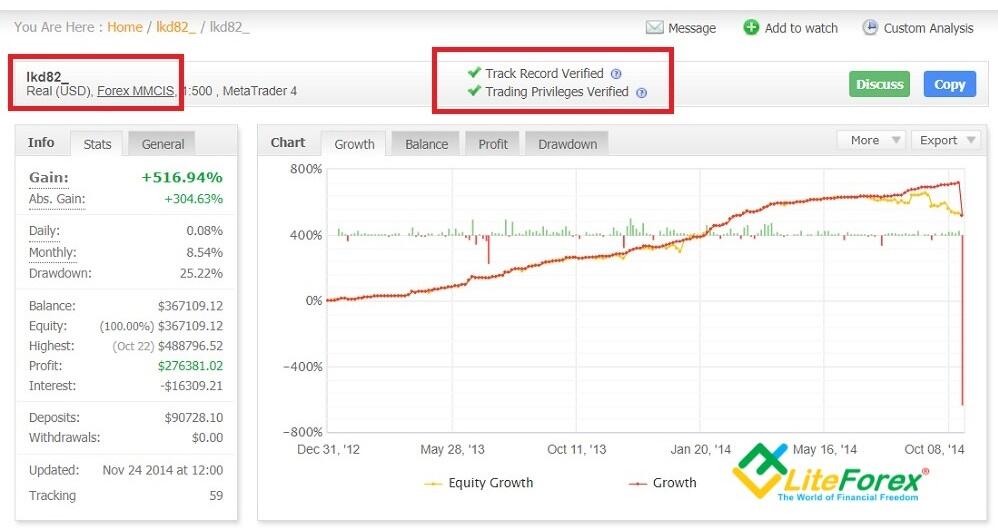
- Nor very strong data protection from fraudsters. That is, one of the tasks service’s primary tasks, guaranteeing the integrity of users, is not fully performed. Alas, but a 100% guarantee does not exist, MyFxBook statement can be falsified or belong to fraudsters (clients of fraud brokers). On the Internet, there is a detailed instruction on how to upload fake statistics to MyFxBook, created in third-party tabular and text editors. The article describes what software is needed for this, how and where to write the needed code, etc. - everything is pretty clear, consistently and in detail. I do not know how it works, and whether there are other ways to fake statistics, but as a proof, I will present a screenshot of the account held by a company known in trading community.
- Account synchronization problem. Account information on the server should automatically be displayed on MyFxBook. But it happens that the results of trading are displayed in the monitor with a long delay. Attempts to contact support services, according to reviews of traders facing the problem, did not help. Also, users complain about the problem of confirming the “Track records” and “Trading Privileges” when connecting an account via MT4 mode (Publisher). There are solutions to the problem, but why they are so complicated?
- The lack of storage of the account history and dependence on the history that the broker keeps. If a broker keeps a maximum year of trading history (which brokers honestly warn about), then only this period will be taken into account in the statistics. If we take into account that for many indicators a sample of at least 3-5 years is recommended, the monitoring statistics will hardly reflect the real performance in general.
- There is no difference between dollar and cent accounts. Visually, the investor sees statistics with a large volume of transactions, but, in fact, trading is conducted on a cent account.
- There are problems with the site translation into languages other than English. English is the main language, when you try to switch to some other languages, half of the tabs and the text remains in English. It is not convenient, but it still can be used.
Conclusion on using MyFxBook
MyFxBook is an interesting application, and it is worth your attention. One should at least get acquainted with it and test its functions and capacities. It is far from being perfect and it will not necessarily meet your expectations. Nonetheless, it provides much more opportunities for analysis, compared to other testers and simulators.
I, personally, believe that the major advantage of this platform is that it provides a guarantee (even though it is not a 100% guarantee, but this is better than nothing) that the trading on the account is real. The trader in turn attracts investors. I see nothing so exciting among gits analytical tool.
First, not everyone will go so deeply into the study of statistics.
Secondly, there are trader journals or Excel, for example, where you can build a model for analysis. But this is a subjective opinion. Therefore, I still recommend visiting the platform website to explore its capacities.
I invite you to discuss the merits and the flaws of MyFxBook app in the comments, where you can also ask any questions about the functions and the way to use them!
P.S. Did you like my article? Share it in social networks: it will be the best "thank you" :)
Useful links:
- I recommend trying to trade with a reliable broker here. The system allows you to trade by yourself or copy successful traders from all across the globe.
- Use my promo code BLOG to get a 50% deposit bonus on the LiteFinance platform. Simply enter this code in the appropriate field when funding your trading account.
- Telegram chat for traders: https://t.me/litefinancebrokerchat. We are sharing the signals and trading experience.
- Telegram channel with high-quality analytics, Forex reviews, training articles, and other useful things for traders https://t.me/litefinance
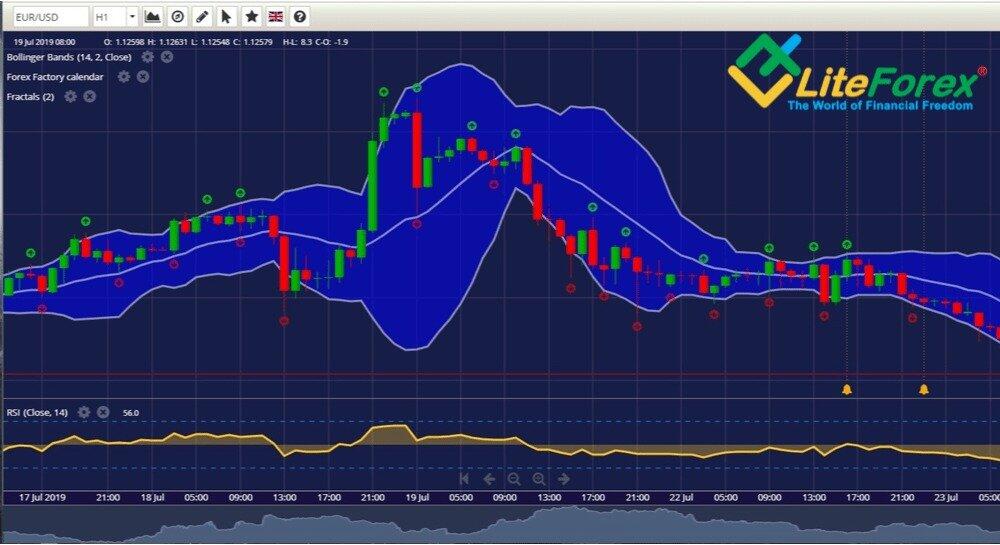
Price chart of EURUSD in real time mode
The content of this article reflects the author’s opinion and does not necessarily reflect the official position of LiteFinance broker. The material published on this page is provided for informational purposes only and should not be considered as the provision of investment advice for the purposes of Directive 2014/65/EU.
According to copyright law, this article is considered intellectual property, which includes a prohibition on copying and distributing it without consent.