Wall Street analysts expect the S&P 500 index to surge by 9% in 2026. A whopping 71% of retail investors believe it will grow by 10% or more. However, will the broad stock index manage to close its fourth year in the black? Will it avoid a crash? Let's discuss these topics and make a trading plan.
The article covers the following subjects:
Major Takeaways
- The S&P 500 index falls by 30% or more once every 10–12 years.
- In January, the stock index rose in 60% of cases.
- Rotation in the US stock market is gaining momentum.
- Short positions on the S&P 500 can be considered below 6,920 amid strong employment statistics.
Weekly Fundamental Forecast for S&P 500
If it was trendy to be optimistic about the US stock market in 2023–2025, it will become dangerous in 2026. The consensus forecast from Wall Street experts suggests the S&P 500 index will rise by 9% this year, with not a single bearish forecast among the major banks. Their mistakes over the past three years have severely damaged their reputation, so the bullish assessments seem more like a case of playing it safe. The broad stock index has never grown for four consecutive years in the 21st century.
S&P 500 Yearly Return and Consensus Forecast
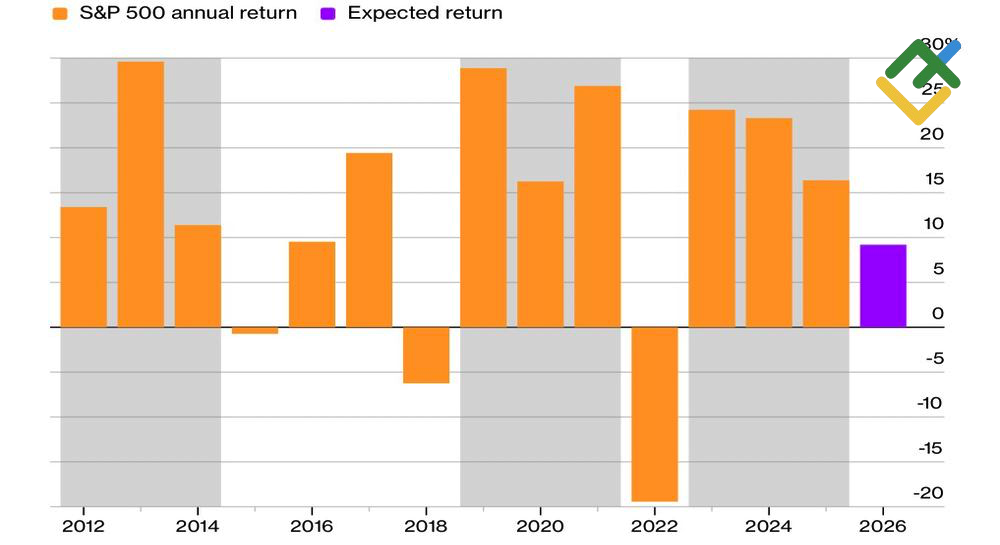
Source: Bloomberg.
The S&P 500's crashes are like earthquakes. They happen extremely rarely. and are difficult to predict. According to TS Lombard estimates, a 30% or more stock market crash occurs once every 10–12 years. Given that the last one occurred in 2020 during the pandemic, the company estimates the chance of another rapid decline at 8–10%, comparable to the derivatives market's estimates.
There is a high probability of no collapse, but a number of Wall Street banks are offering fairly modest forecasts for the S&P 500 index. For example, Bank of America reckons it will grow to just 7,100. The broad stock index's previous advantages are not as strong as they used to be. The US economy is sure to slow down amid a cooling labor market. The Fed will not cut rates as aggressively as it did in 2025. Meanwhile, demand for AI is waning.
Indeed, doubts about the Magnificent Seven's ability to move markets are leading to rotation. Money is pouring into the remaining 493 stocks in the S&P 500 index. The process of asset reallocation accelerated at the end of 2025.
Capital Flows in ETFs Not Related to Magnificent Seven
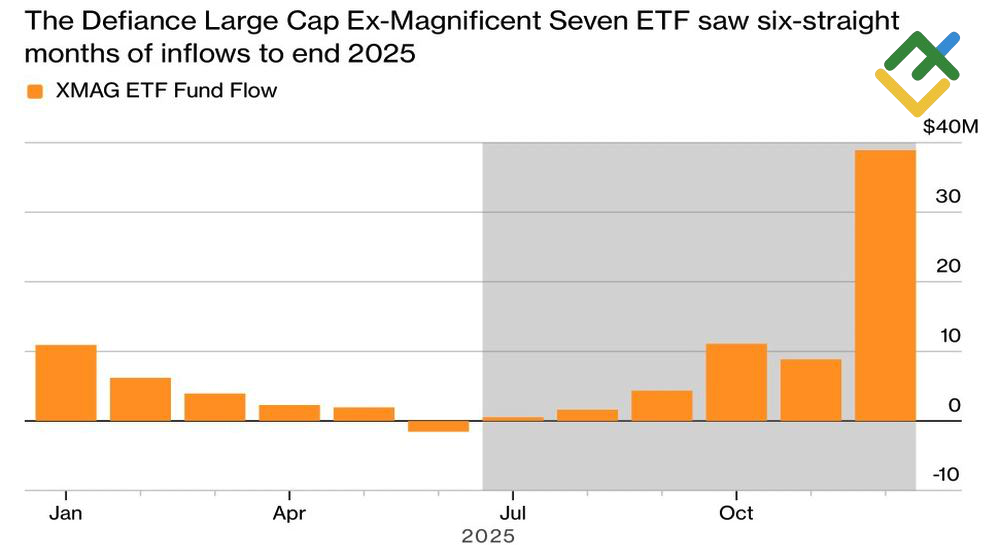
Source: Bloomberg.
Investors are betting on securities that are sensitive to the state of the US economy. However, if their expectations of a Goldilocks scenario are not met, a massive sell-off of these stocks will trigger a meltdown.
However, it is unlikely to happen in January. Even though the S&P 500 index missed the Santa Claus rally for the third time in a row, the second month of winter is seasonally strong for the US stock market. Since 1929, the broad stock index has risen in 60% of cases.
S&P 500 Performance During Santa Claus Rally
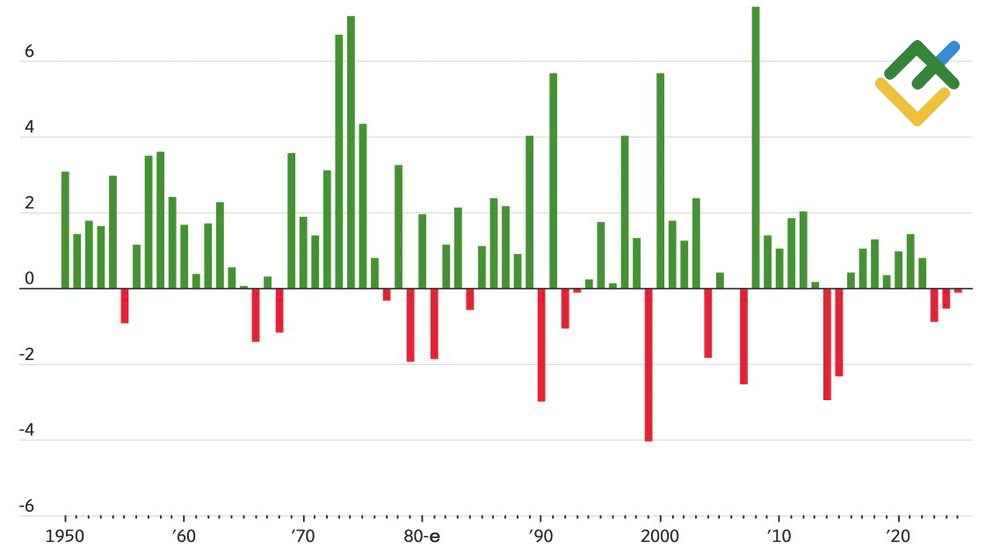
Source: Wall Street Journal.
Unlike Wall Street analysts, who are clearly more cautious, retail investors are not hiding their optimism. About 71% of MLIV Pulse respondents predict a 10% or more rally in the broad stock index in 2026, while 11% believe it will grow by 20% or more. Does it make sense to trust the crowd? Notably, it was the crowd that actively bought shares during the 2025 stock market slump.
Weekly Trading Plan for S&P 500
The S&P 500's weakened fundamentals will likely lead to mixed performance in its quotes. Meanwhile, robust US labor market statistics for December will lower the likelihood of a federal funds rate cut in March, allowing investors to sell the broad stock index if it drops below 6,920.
This forecast is based on the analysis of fundamental factors, including official statements from financial institutions and regulators, various geopolitical and economic developments, and statistical data. Historical market data are also considered.
Price chart of SPX in real time mode

The content of this article reflects the author’s opinion and does not necessarily reflect the official position of LiteFinance broker. The material published on this page is provided for informational purposes only and should not be considered as the provision of investment advice for the purposes of Directive 2014/65/EU.
According to copyright law, this article is considered intellectual property, which includes a prohibition on copying and distributing it without consent.