Bill Williams Trading Chaos: trading psychology, chaos theory, and Three Wise Men trading strategy. Theory and practice
Dear friends!
This article explains an interesting theory of Three Wise Men in Trading Chaos developed by Bill Williams, one of the most famous American financial analysts of the second half of the 20th century.
Initially, Williams' ideas aroused much controversy because of their revolutionary nature. Indeed, in his theory, the analyst disputes the truth of some unshakable laws of fundamental analysis. However, his personal experience and the experience of his numerous followers proved the high efficiency of the system; so, it became an integral part of analytical forecasting, and his indicators were included in the standard toolkits of most trading platforms. While studying the method of Three Wise Men, we will delve into fractal geometry, get familiar with new indicators and will be able to have a simpler view on the market processes, arranging its chaotic structure into a measurable order.
All markets are simple
Let us first study some theory and then move on to practical examples. Williams writes that most traders and investors think that the market is too complex, and so, they miss obvious things. The markets are not mysterious and unfathomable. The primary purpose of any market is to ration, existing and future supply to those who want it the most. Differently put, any market is a tool that helps us set a reasonable price, that will balance the power of those who buy and those who sell.
The truths you must remember before you start trading
When you understand how any market works and its purposes you can refute some basic principles of fundamental analysis.
First of all, Williams states there is no such thing as bullish/bearish consensus. According to him, the primary job of the market is to instantly find that exact place where there is an equal disagreement on value and an agreement on price. So, the market cannot endue even the least bullish sentiment before the price will start rising.
Based on this principle, there is logically follows another truth that is also a sensation. There cannot be any such thing as an oversold or overbought condition, a there is no such thing as bullish or bearish consensus. Besides, the author warns that you shouldn’t blindly follow common formulas for profitable trading, as most of them are ineffective.
The market is ruled by two types of ideas, they are opinions and facts. Opinions are the most popular ideas. On the one hand, they are quite powerful, as they, like any other beliefs, have a huge impact on trade and investment decisions. On the other hand, opinions have an influence only on some traders, basically weak holders, who I wrote about in the series of lessons about the VSA model. For example, opinions are ideas like “An ordinary trader is helpless against the market-makers”, “Only a privileged group of people knows where the price will go next”, “Trading is a battle”.
Facts, on the contrary, are not numerous and are often less important for traders than opinions. And this is very strange, as facts have an impact on all market participants. Williams says most traders lose because they follow other people’s opinions and ignore obvious facts.
Chaos theory
Bill Williams suggests that neither economical, nor technical, nor fundamental analysis provides an accurate picture of a market is. The nonlinear nature of the market processes is proven by the fact that 90% of traders lose employing these types of analysis.
As an alternative to common approaches, the author suggests the chaos theory and fractal geometry. The science of chaos outlines three fundamental principles for the study of the market energy:
- Energy always follows the path of least resistance. Remember, this principle is followed in also in the VSA model I described in the previous educational series.
- The path of least resistance is determined by the always underlying and usually unseen structure.
- Certain approaches help one discover the underlying and seen structure and so, it can be altered.
All structures contain movement and an inclination toward movement; this means they tend to change from one state to another state. Any structure has four elements:
- parts (components),
- plan,
- power source,
- purpose.
The structures that have the most influence on your trading results are composed of desires, beliefs, assumptions, aspirations, and, most of all, your understanding of the underlying structure of the market and yourself. In practice, the behavior of most market participants is determined by two types of underlying structures. They are action-reaction and the infinite cycle model.
Action-reaction
This type of structure produces an action-reaction behavior. A simple example is a pendulum. one type of desired behavior leads to an opposite undesired behavior. A rise is always followed by a fall. In this structure, change is experienced from time to time, but it does not last. Any progress turns out to be temporary. This type of the underlying structure makes us move back and forth just like a pendulum.
Infinite cycle model
Unlike the previous, Type One structure, a structure that aims at solving problems, a Type Two structure is geared for action that brings something new into the current situation.
This is a cycle model, like an infinity sign or number eight. First, such a trader tries to reduce the importance of the problem. Next, following the path of least resistance, he/she reduces activity, so further progress is also reduced. As a result, instead of making real profits for a somehow long time, the trader moves back and forth between solving problems, stopping progress and as a result, new problems.
Psychological types of traders
According to risk-taking, Williams divides all people into three types:
- Leaders who are willing to look beyond the accepted standard and reach for something greater;
- Followers who are willing to follow those leaders and embrace new ideas and take risks;
- Landlubbers who are unwilling to take risks; they also do not take the steps necessary to make a possible fortune or dare to dream about going on new adventures.
One of the key factors of successful trading the Three Wise Men strategy is understanding your type of thinking. As a trader, you, first of all, need to accept your way of thinking, using its benefits and flaws.
From a psychological point of view, Williams sees the market as a three-dimension structure that includes three components:
- time,
- price,
- trader’s psychology.
A winning trading strategy is:
- Go with the flow,
- Ride the tide, and
- Bend with the trend.
To develop such kind of thinking, a trader should learn how to set their own thoughts, opinions, and beliefs aside, not get distracted by the fears and other people’s opinions.
The stairway to a successful trader
Williams believes that the development of traders is stepwise. In total, he distinguishes five steps:
Level One, the novice. At this level, a beginner trader sees the enormous amount of information contained in the tools at this level. The main objective at this level is to learn to trade in the market and not lose money while you gain experience. Most novice traders search for a mechanical system that will make them rich and successful if they can just put the pieces of the market puzzle together. This is a bad idea.
Level two, the advanced novice. At this level, a trader expands the horizons timewise to include more tools than he used at level one.
Level three, the competent trader. At this level, the trader can quickly and exactly use the tools of the market to increase trading efficiency. In addition, at this level, the trader begins to monitor what most people call “causes” rather than just effects.
Level four, the proficient trader. At this stage, the trader acquires his/her own belief systems. Our objective at this level is to align our own persona underlying structure with the underlying structure of the market. Williams states that when that happens, winning becomes the path of least resistance.
Level five, the expert trader. At level five, we flow deeply into the realm of chaos. Things that seem occasional at the first level, are now logical and natural at level five. At level five, trading a low-stress way of living.
The Alligator trading indicator
The basic tool in the Three Wise Men strategy is the Alligator indicator, which is a combination of three Moving Averages:
- The Blue Line (jaw) is a 13-bar MA with an 8-bar shift.
- The Red Line (teeth) is an 8-bar MA with a 5-bar shift.
- The Green Line (lips) is a 5-bar MA with a 3-bar shift.
The chart displays the Alligator that consists of three MAs of different lengths and with different shifts.
The Blue Line is the Balance Line. Differently put, it shows where the market would be if there were no new incoming information. So, the distance between this line and the current price is an indication of how the traders interpret this new incoming information.
The Red Line is the moving average for one significant time frame lower. So, roughly, if the time frame on the current chart is a daily one and refers to the Blue Line, the Red Line would approximate an hourly chart. And the Green Line will show where the market would be in the 10-minute chart.
This approach provides an integrated approach to monitoring the market’s momentum on three different time frames in one chart. you to see all the lines in the same chart, so you do not need three different time charts. New incoming information would first affect the Green Line, followed by the Red Line and finally by the Blue Line.
How the Alligator works and what it indicates
The markets usually stop, reverse or become balanced before most participants realize what is really going on. That is why traders miss potentially profitable situations and even experience losses, entering trades at wrong points.
The Alligator helps you select an optimal time to open a position. The Green Line will be the first indicator that significant amounts of contracts are coming into the markets and are biased in one direction. The next, a more exact signal is the Red Line. The Blue Line is a confirming signal proving that we have made the right decisions. Let study a few basic patterns on the examples.
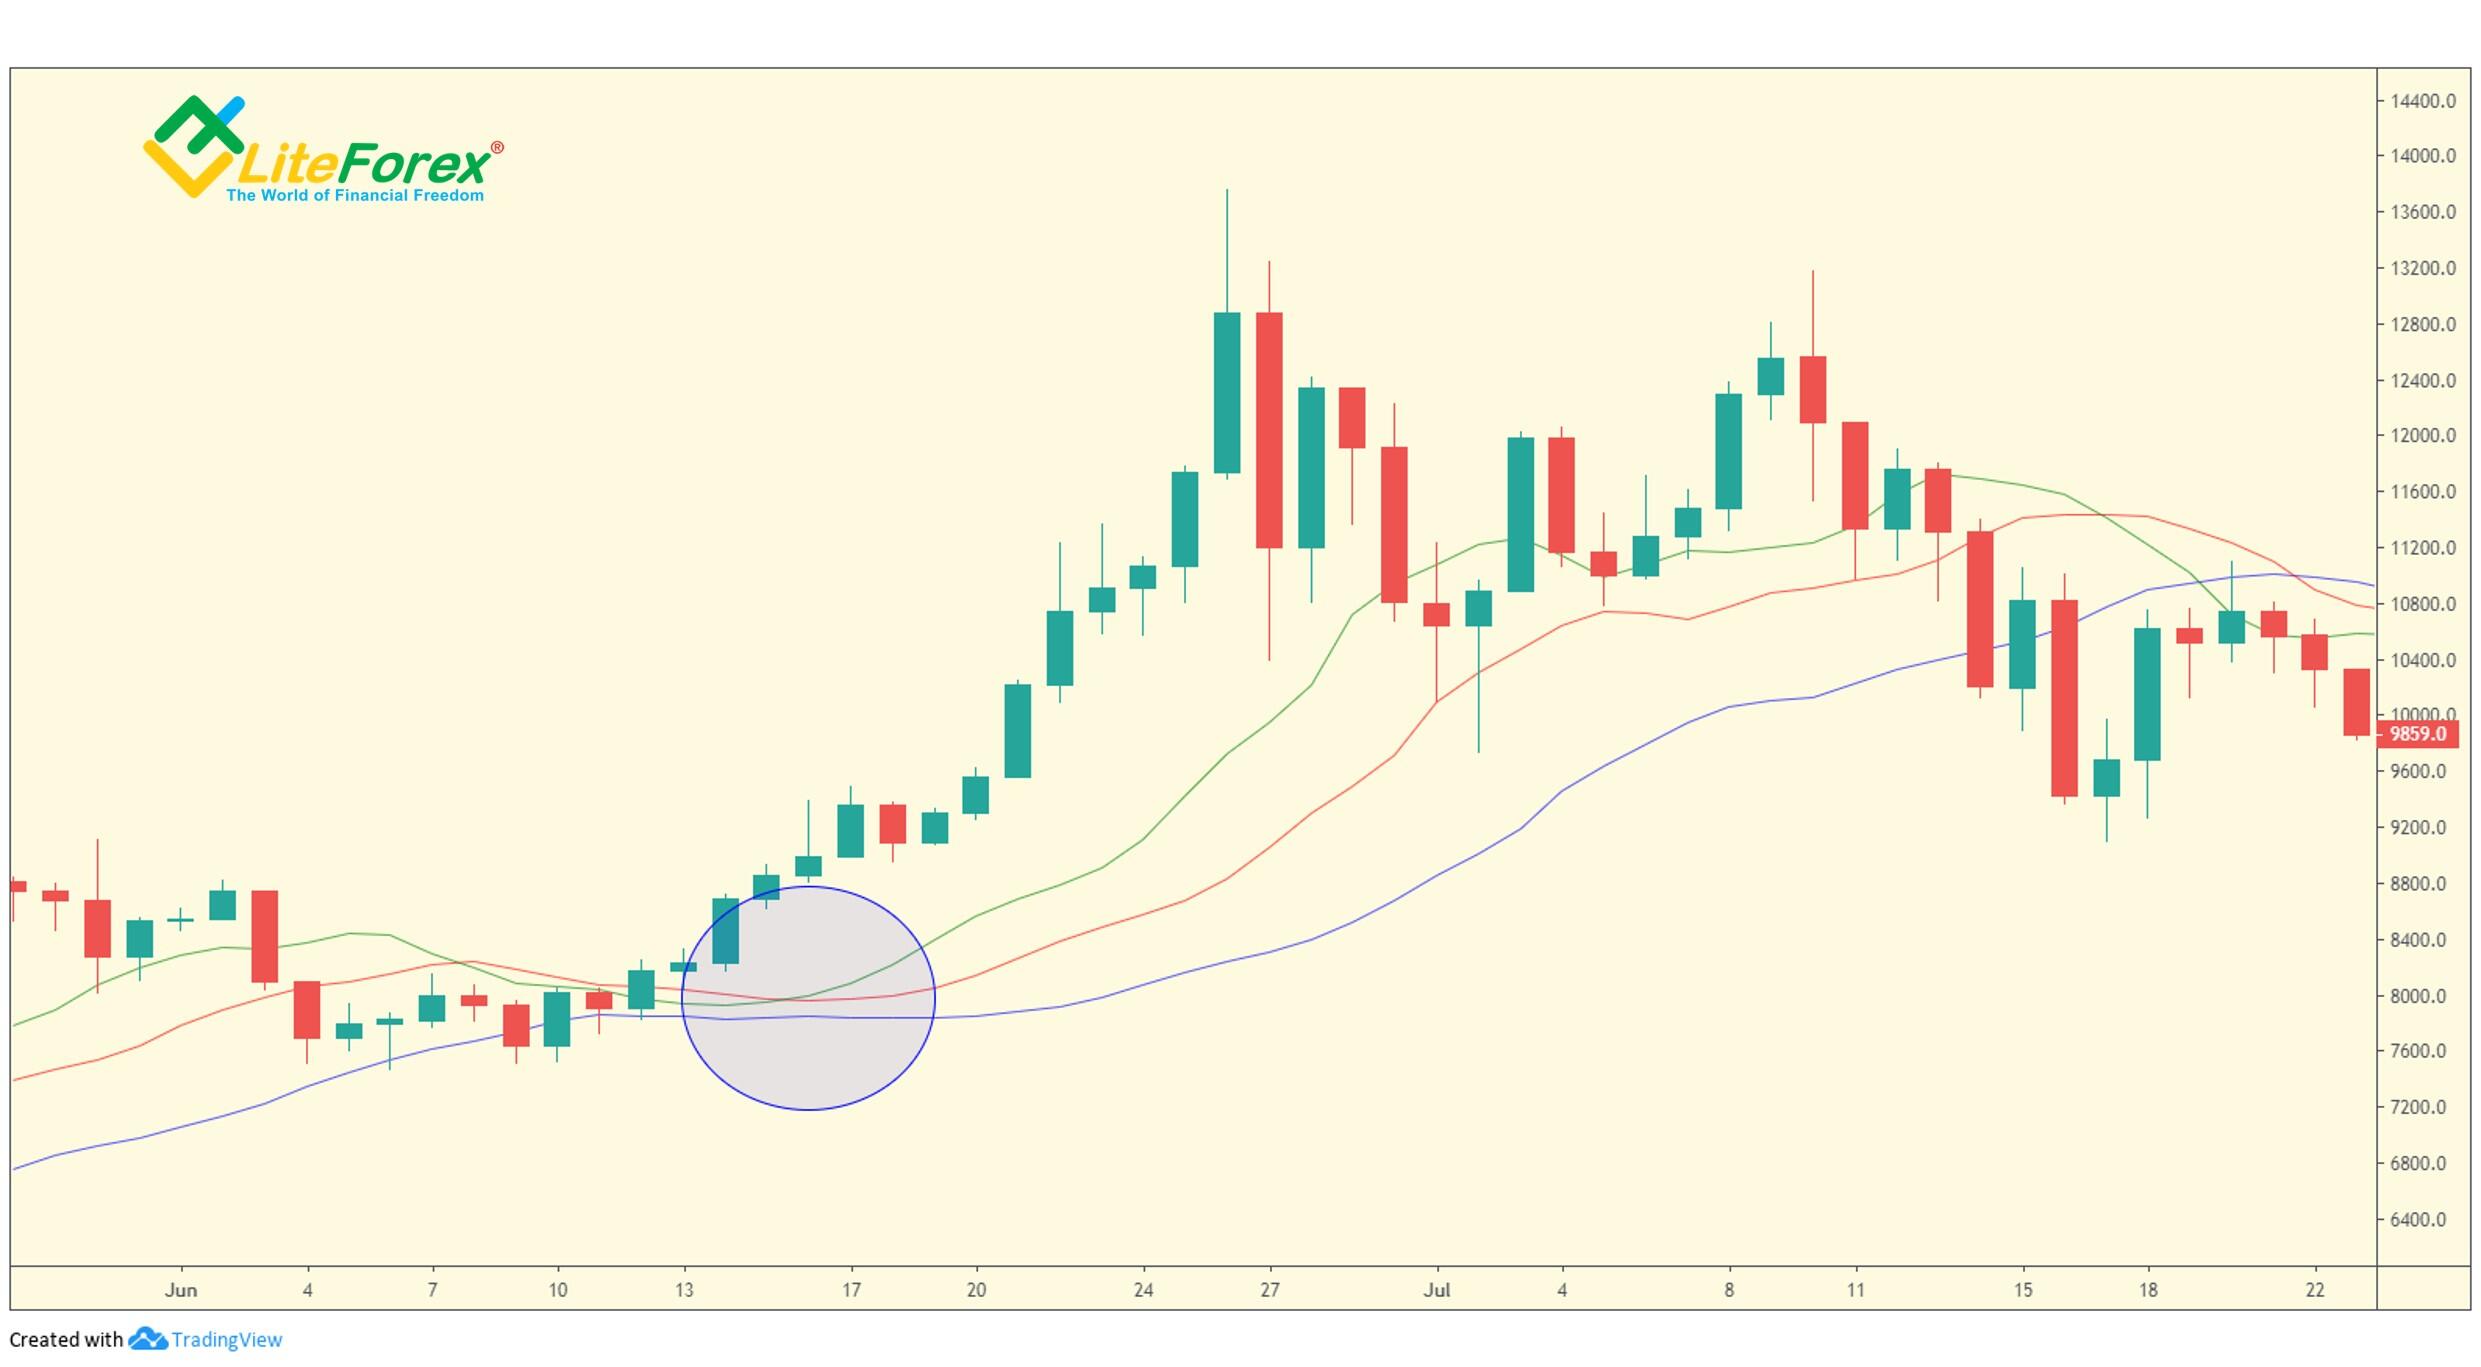
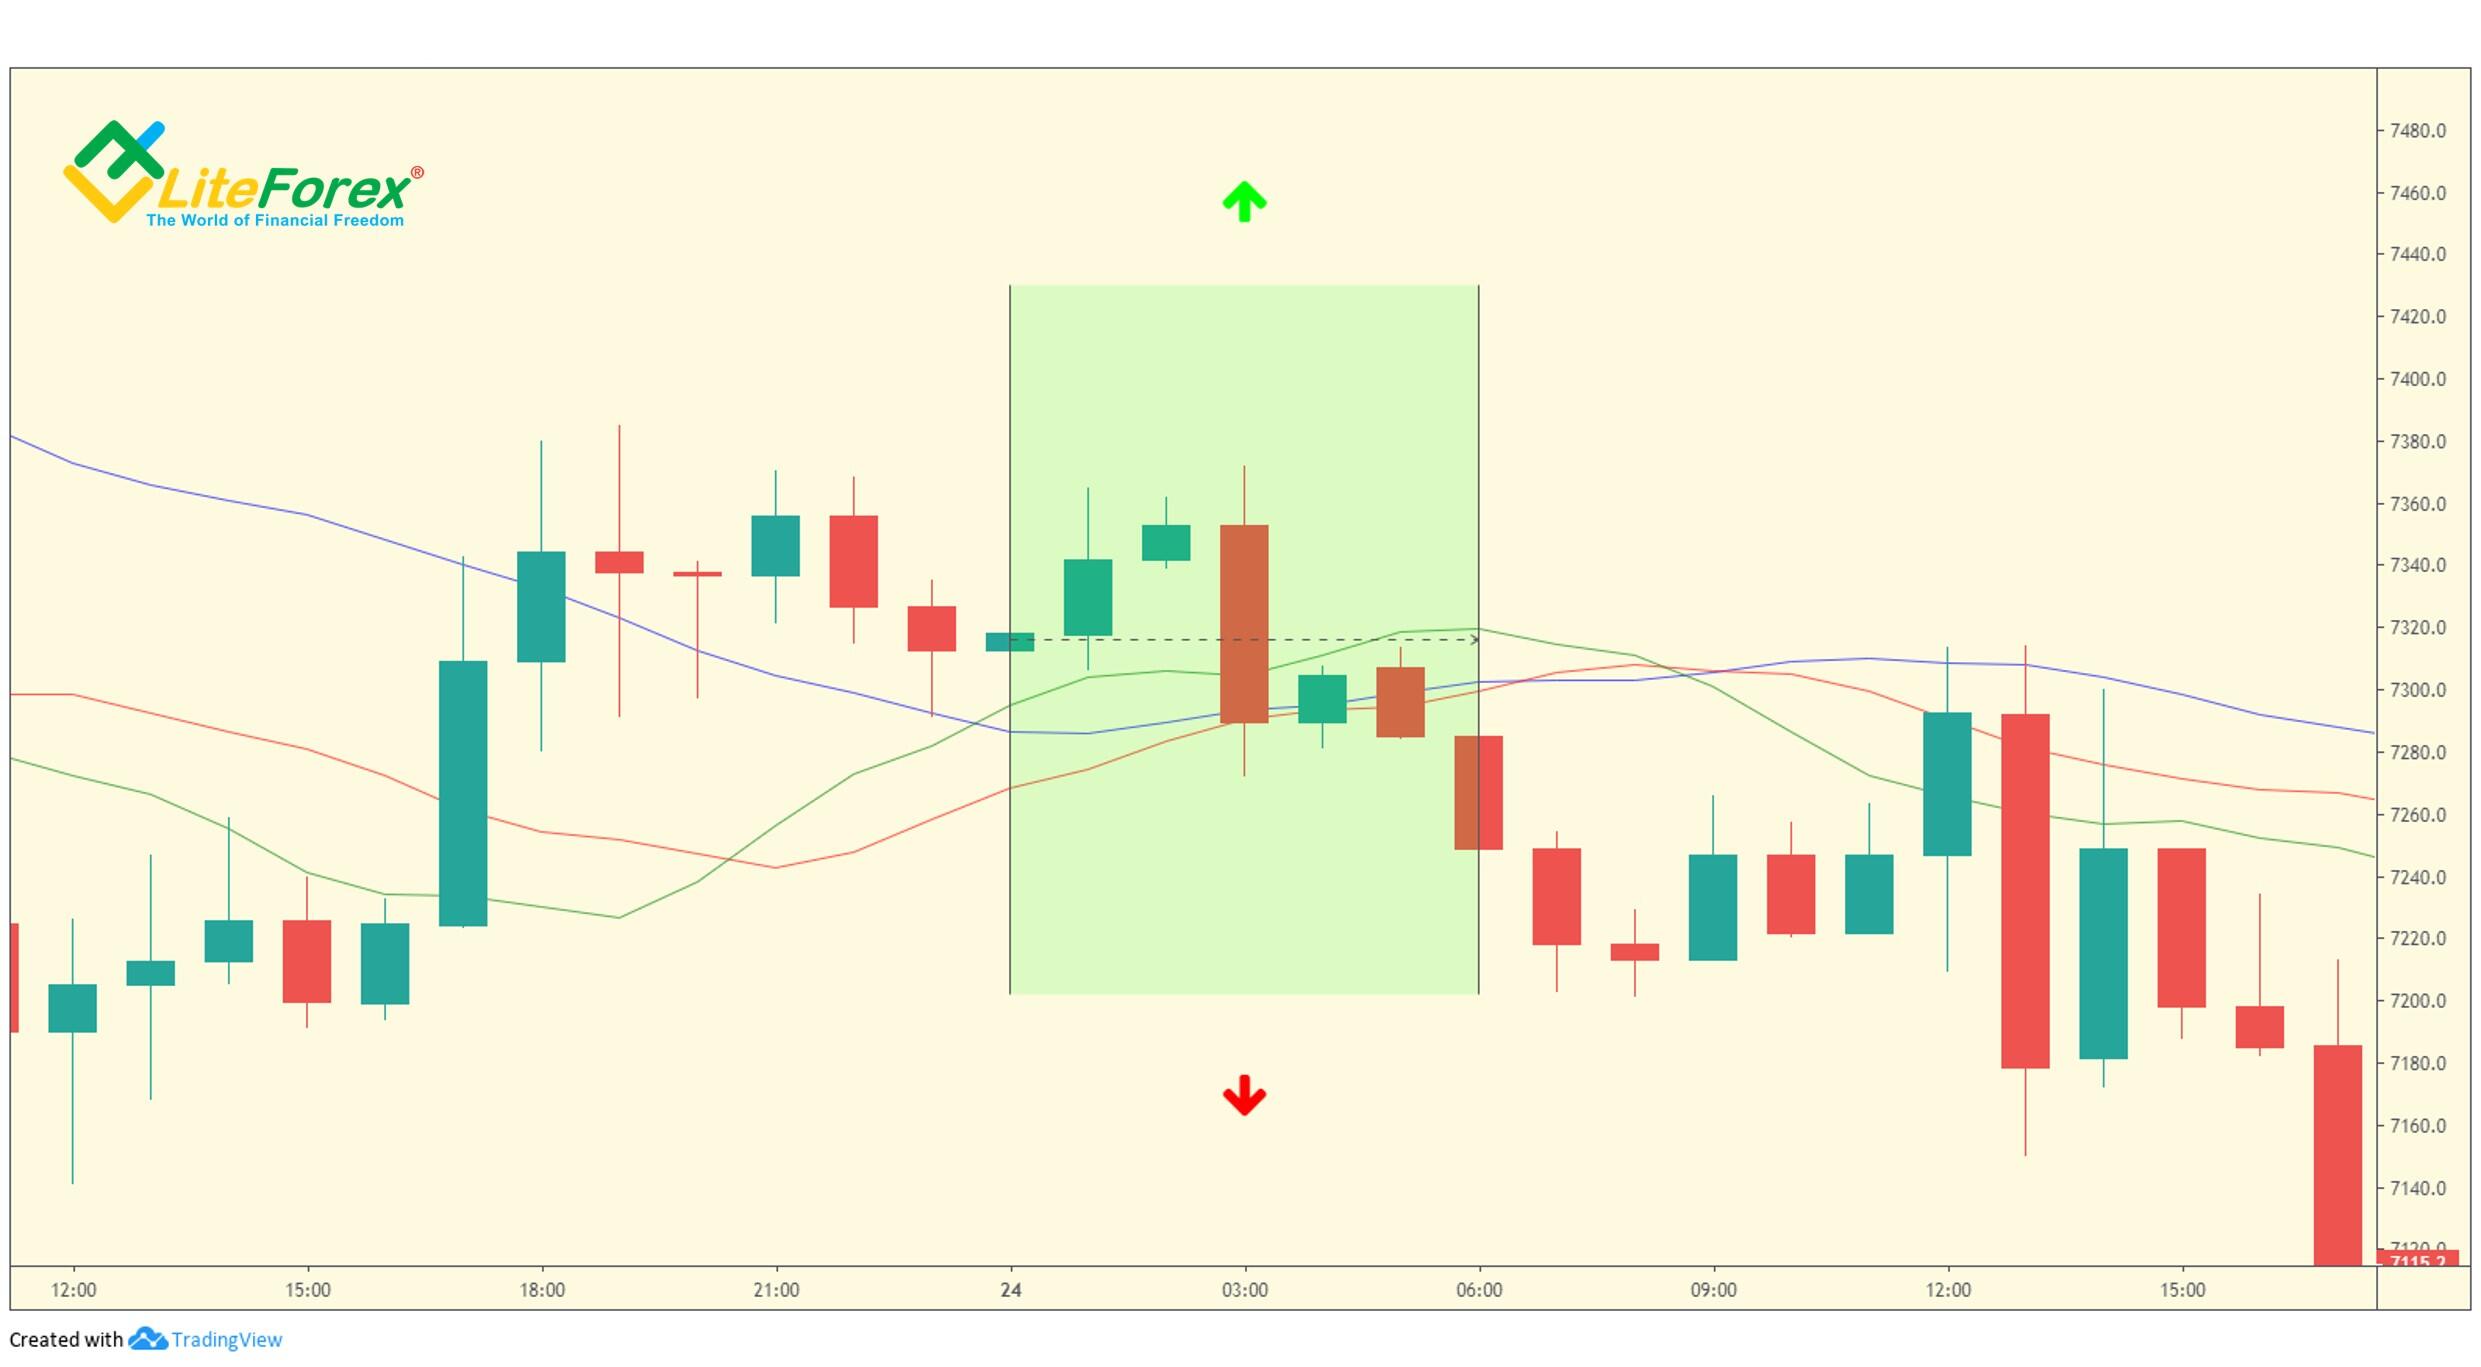
In the daily BTCUSD price chart, you see the Alligator’s lines are moving randomly and then, they start moving in the same direction and separating at the same time. A pattern showing the lines going apart is referred to as the Hungry Alligator by Williams. Note that when the lines start separating, the first line to react to the positive new incoming information is the green line, next the red line reacts, and the blue one is the last to turn.
Notice during most of this up move, the prices stay above the Alligator’s lips (Green Line). The prices cross the line for the first time when the bull trend is exhausting.
The price chart on the left from the Alligator’s open mouth, marked with a blue oval, displays the Sleeping Alligator, that is the point where most traders lose their money. There is not yet a clear trend, even though the price seems to be rising, and so, the price can go any direction.
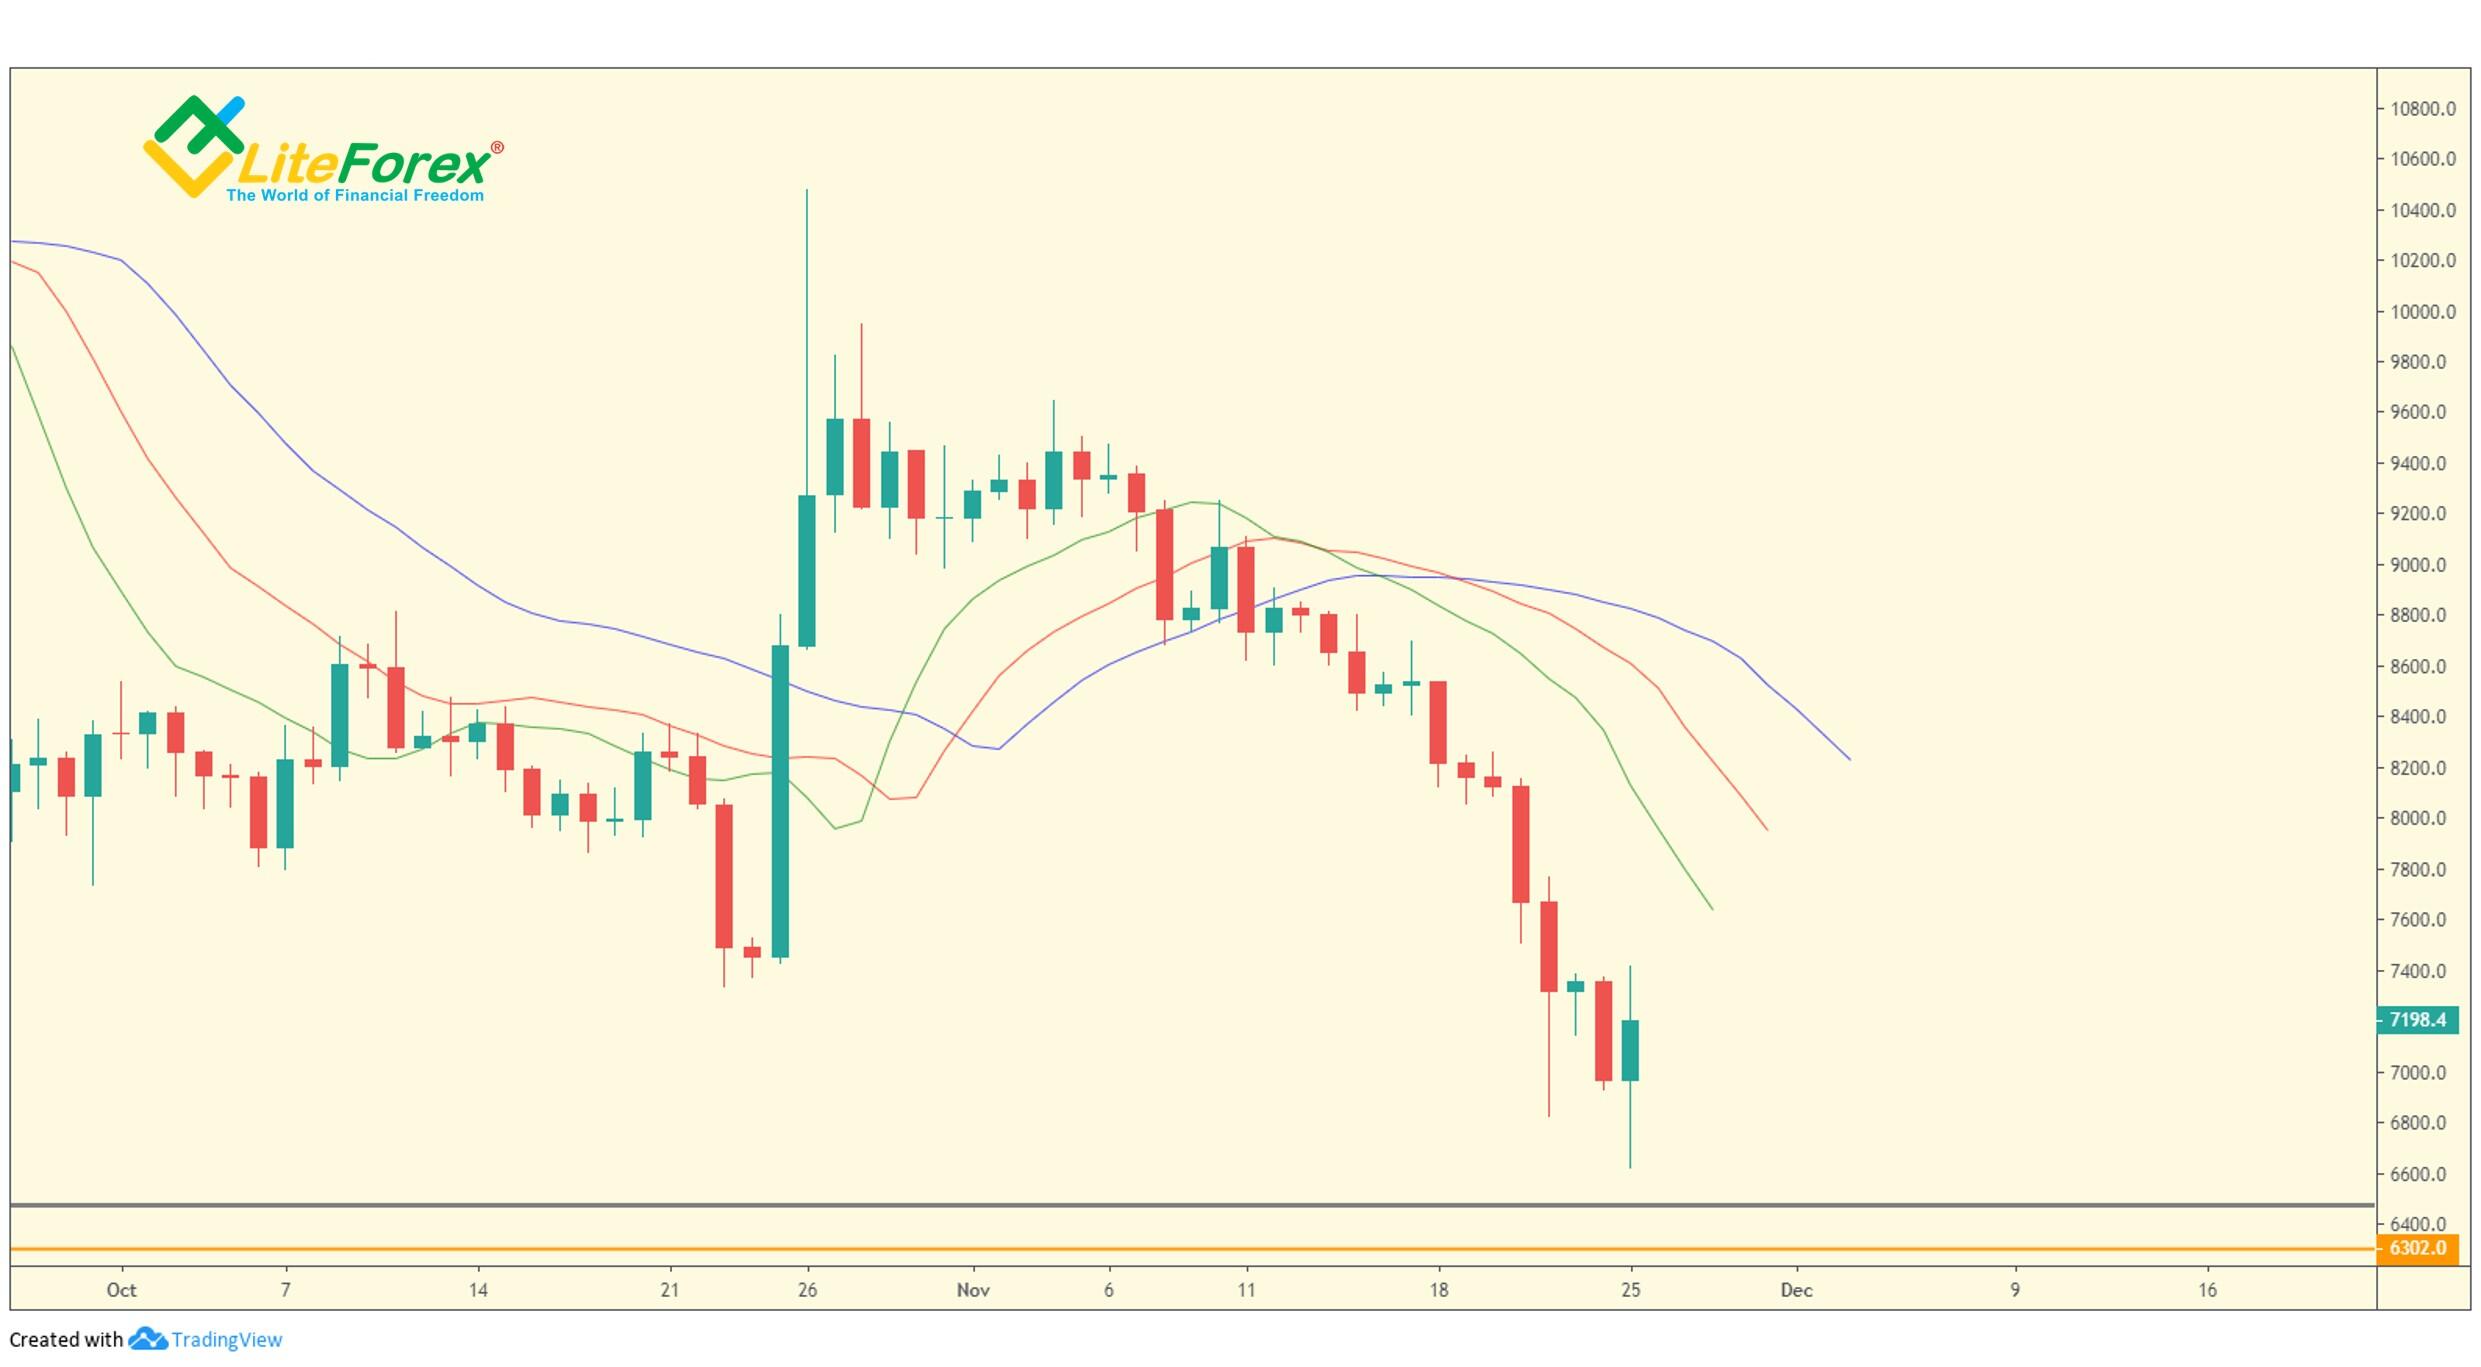
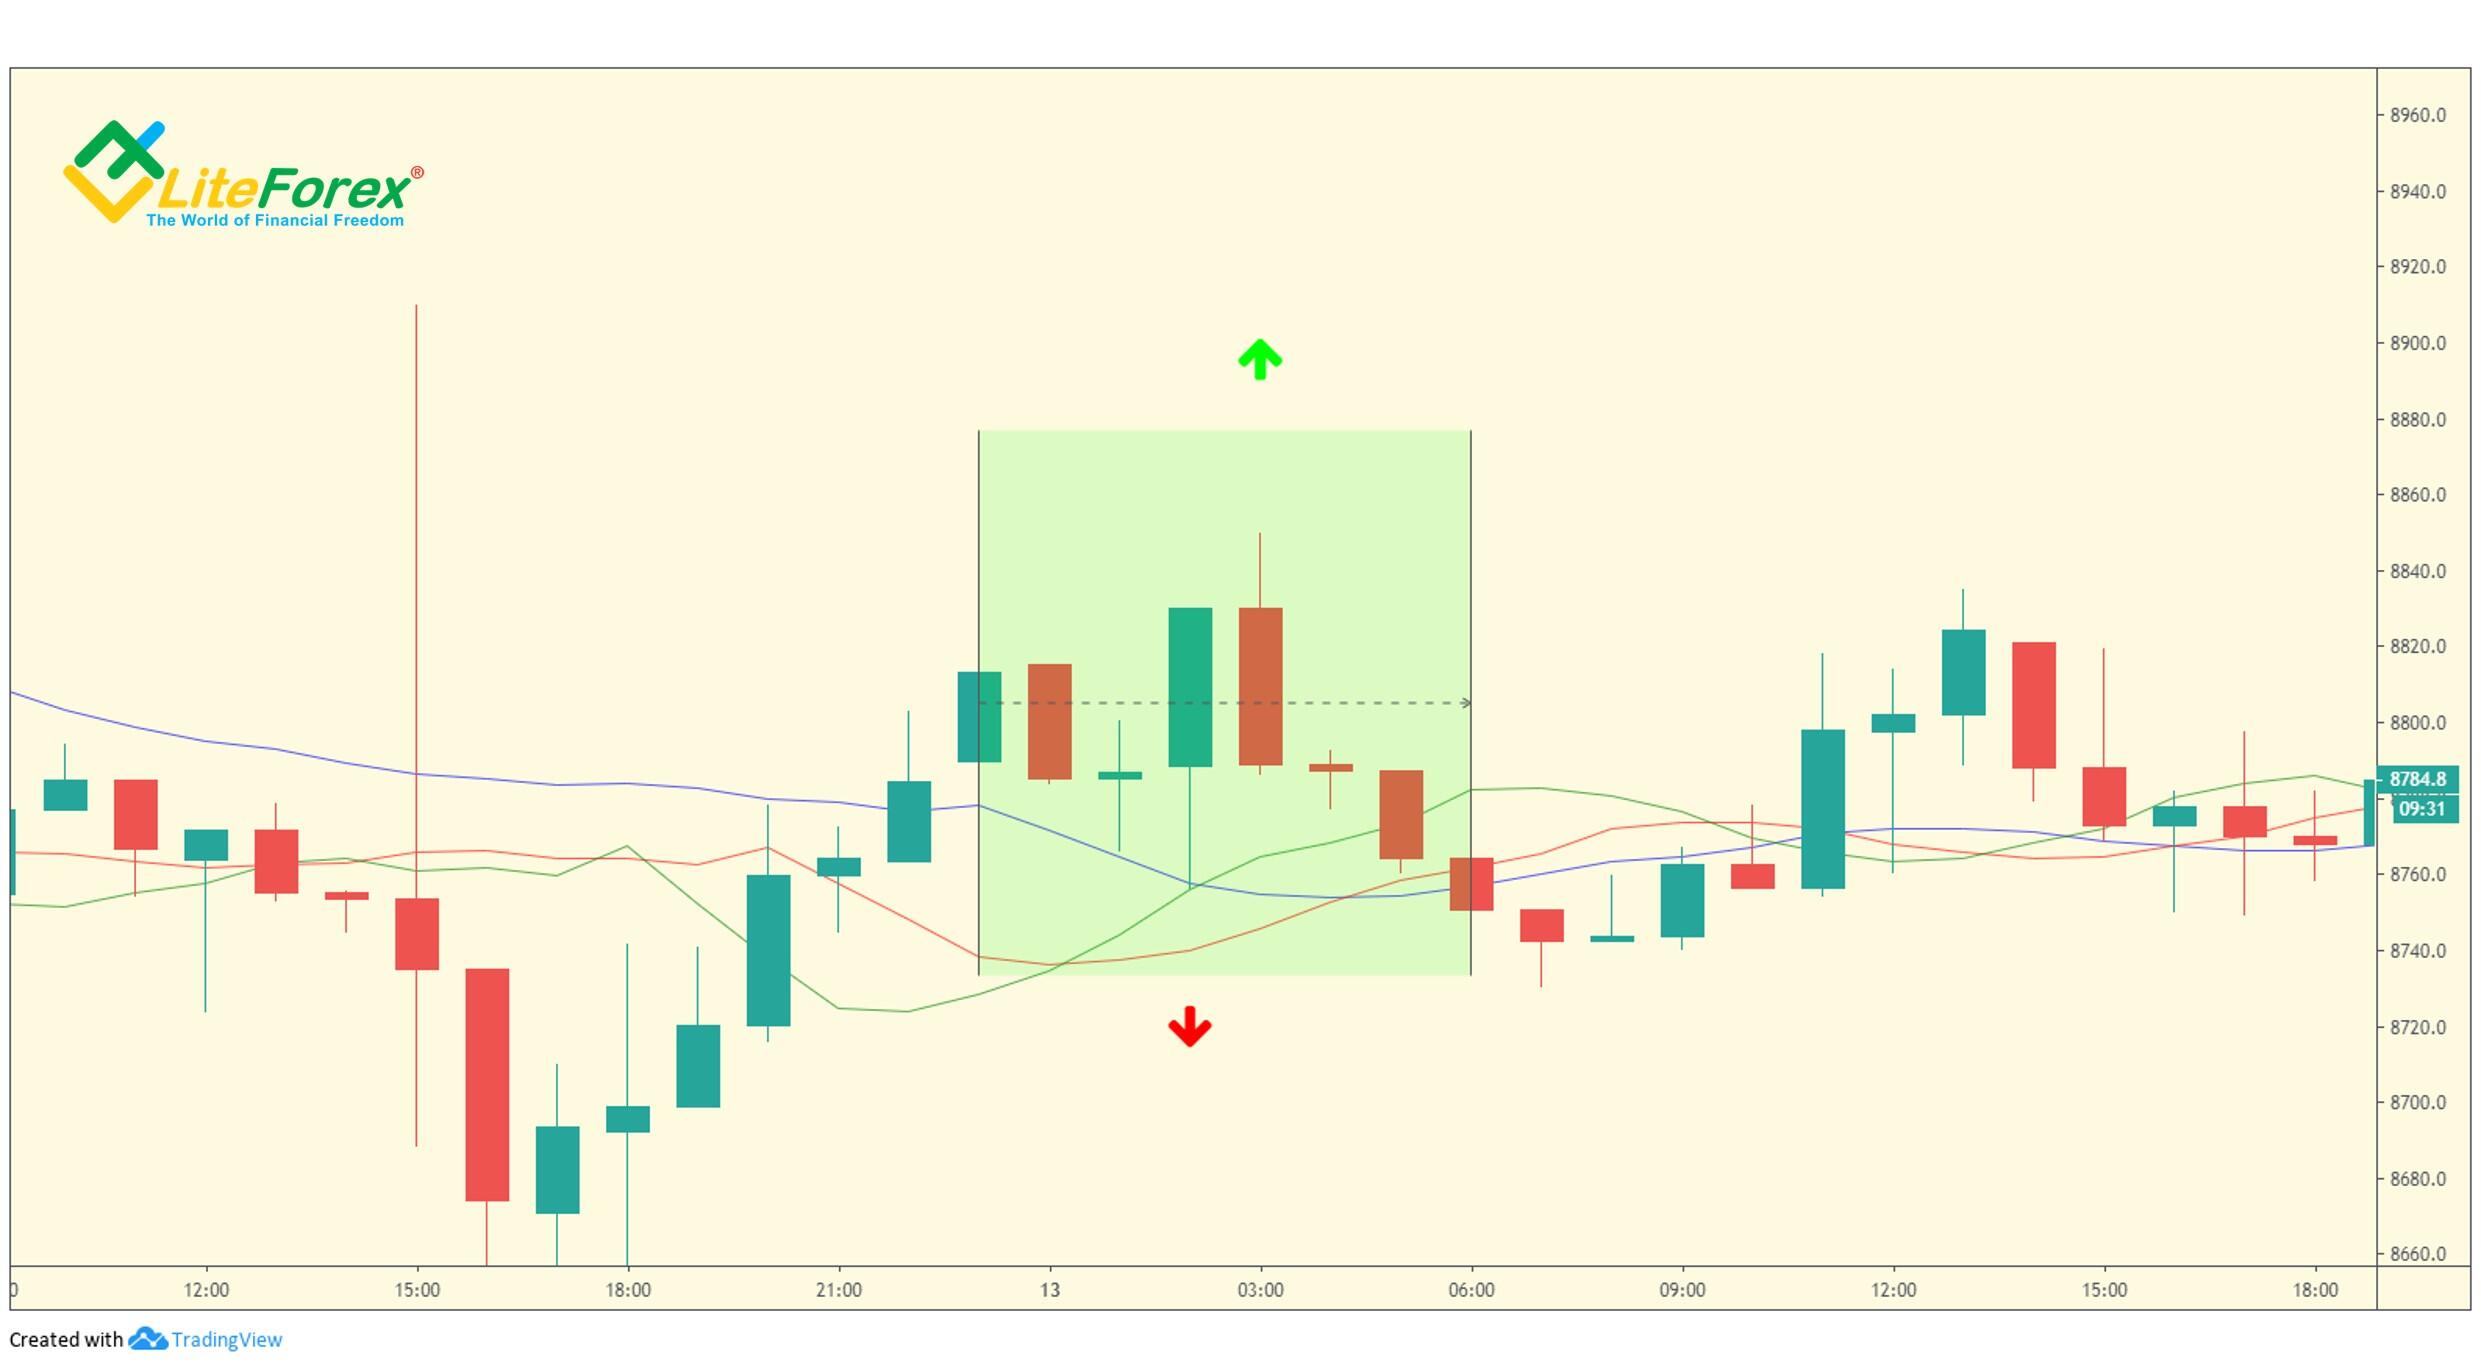
Now, let us see a bear market. If with a steady up-move, the green line (lips) is on the top, next, there is the red line (teeth) and the blue line (jaws) is at the bottom. In a bear market, the lines are in the opposite order. The red zone of the chart displays the Sleeping Alligator when a downtrend starts, it opens the mouth downside.
Note that, during the entire downtrend, bars close below the Alligator lips (green line). When the bear trend is exhausting, the price chart breaks through the lips upside.
The red zone in the chart marks the Alligator sleeping for a long time while there is a sideways trend. So, the big idea is to stay out of the market when the Alligator is sleeping and to be in the market when the Alligator is awake and hungry. Otherwise, entering any trades will yield only losses.
Three Wise Men
I am now going to deal with the basics of the Three Wise Men trading strategy by Bill Williams.
The First Wise Man
In the past, bull markets ended when all the bulls had bought and there were no new buyers. Today, however, aggressive short sellers also attend the tops of trends and that fact changes the market behavior at the end of significant trends. The bull market reverses when the bulls give way to the bears. The bears giving way to the bulls in a downward market marks all reversals in a downward trend.
The problem is that uninformed traders often fail to discover the earliest indications of that turnaround. Williams in the analysis of hundreds and even thousands of reversal points noticed one pattern, later called the first wise man signal. The bullish reversal follows the bar with the lowest low, it must close in its upper half and be well outside the Alligator’s mouth. It signals that when the bar was opening, bears dominated the market, but they gave the way to bulls by its close.
Accordingly, a bearish reversal bar is the bar with the highest high, and it closes in the lower half, being well outside the Alligator’s mouth. It signals that when the bar was opening, bulls dominated the market, but they gave the way to bears by its close. Let me explain the entrance and exit strategies on examples.
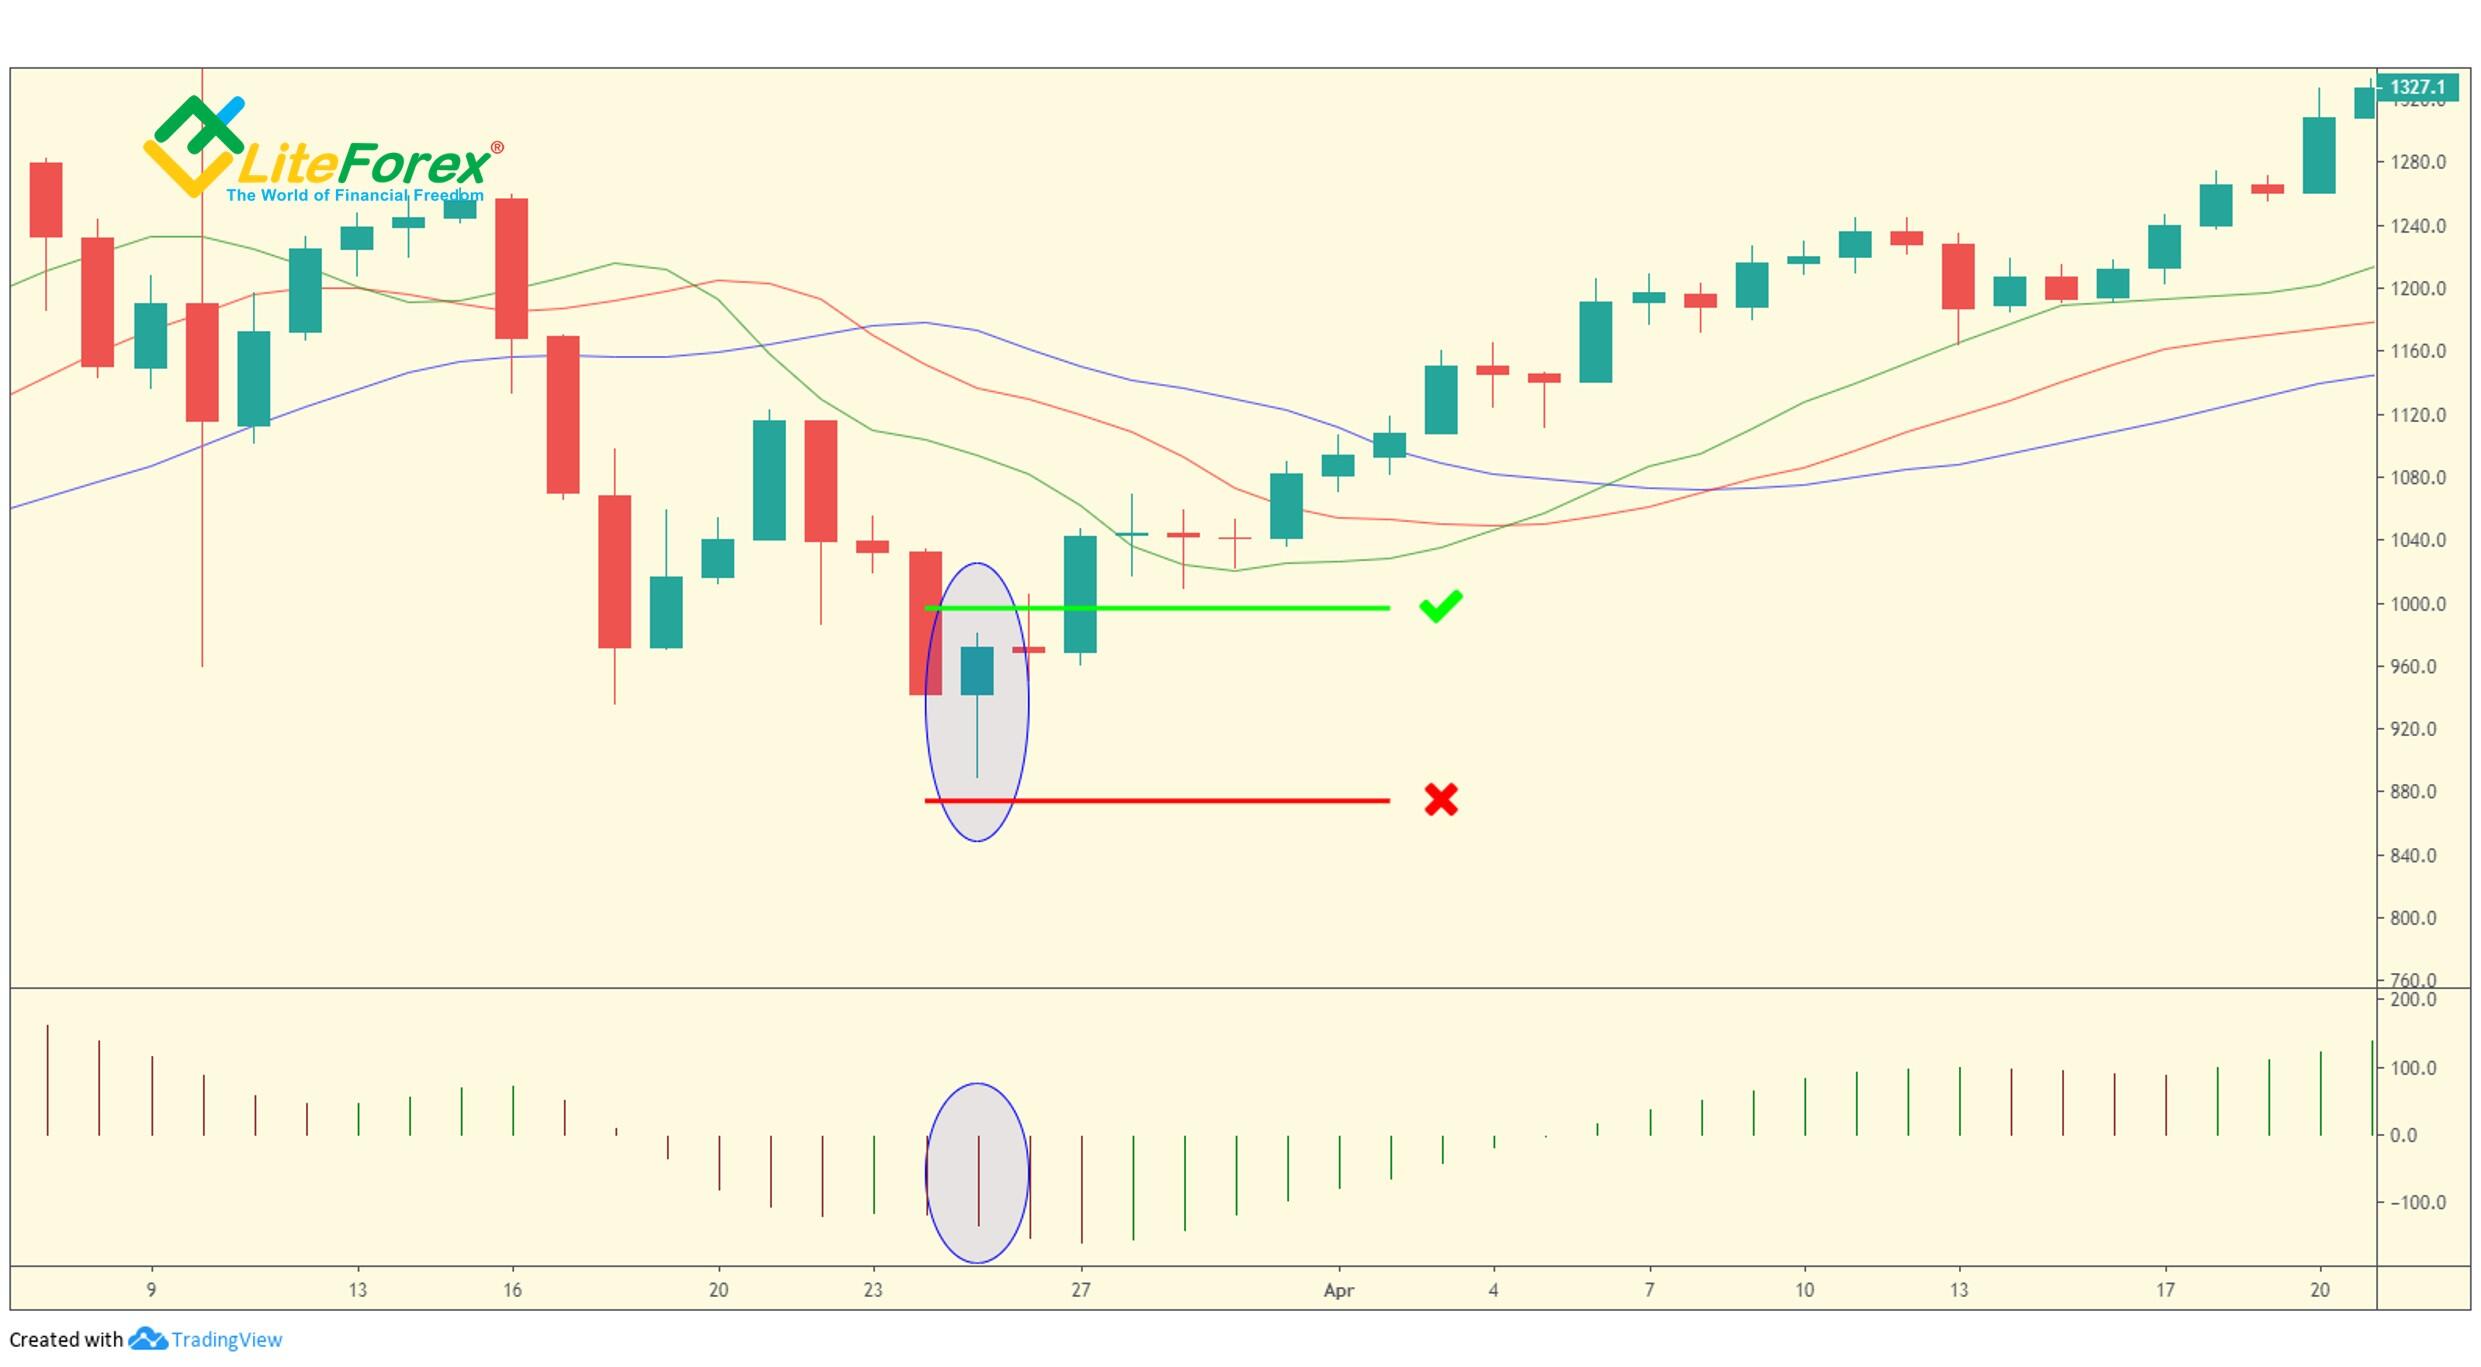
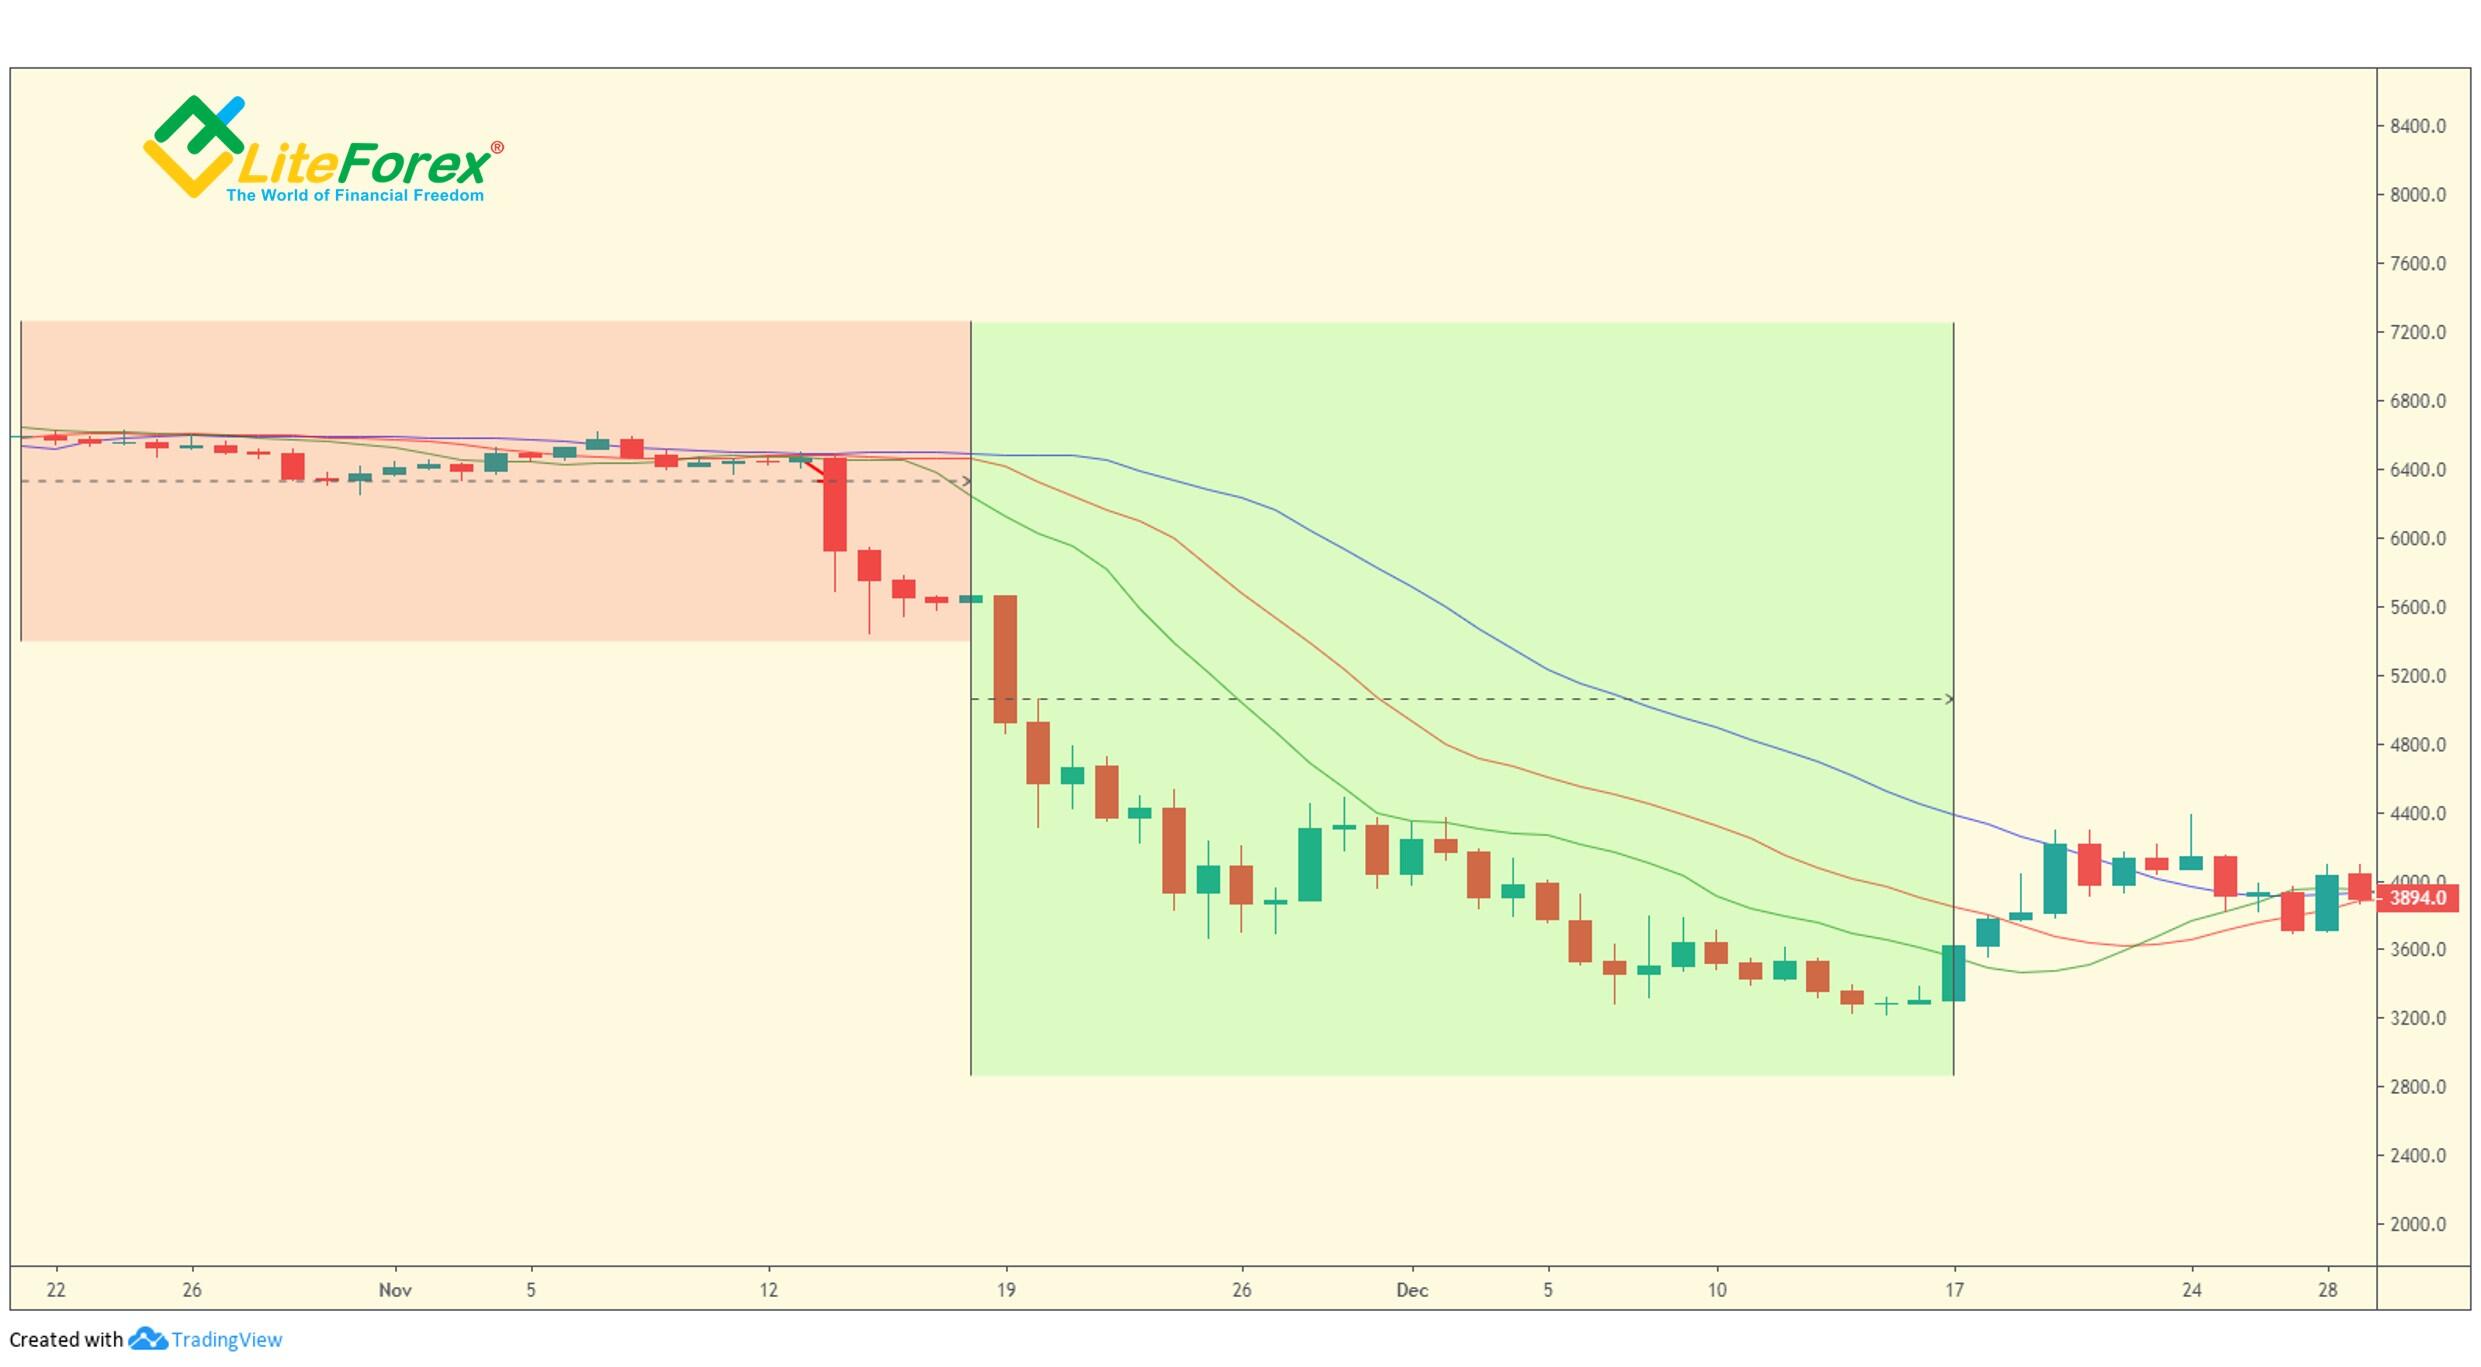
In the daily BTCUSD chart, the oval area marks the bullish reversal bar. It hits a new local low but closes near its high. As you know, it signals that the market sentiment is more bullish in the second half of the bar. The bar is outside the Alligator’s mouth.
The long entry is placed above the top of the bullish divergent bar. Here, I recommend putting an entry stop.
This point is marked by the green line in the chart. We will also need the Awesome Oscillator. It should be red (momentum moving down) because all bullish divergent bars are created while the market is in a down move. Remember, an ideal moment to enter a long trade is when there yet no signs of a bull move in the chart, so it looks as if we were trading counter the trend.
After the buy stop is hit, we need a protective stop. Williams recommends putting the first stop, a few ticks lower the bullish divergent bar. The red line marks it in the chart. According to the original methodology, you need to set a trailing stop. This position gives us a very close initial stop-loss, which would be the length of the signal bar.
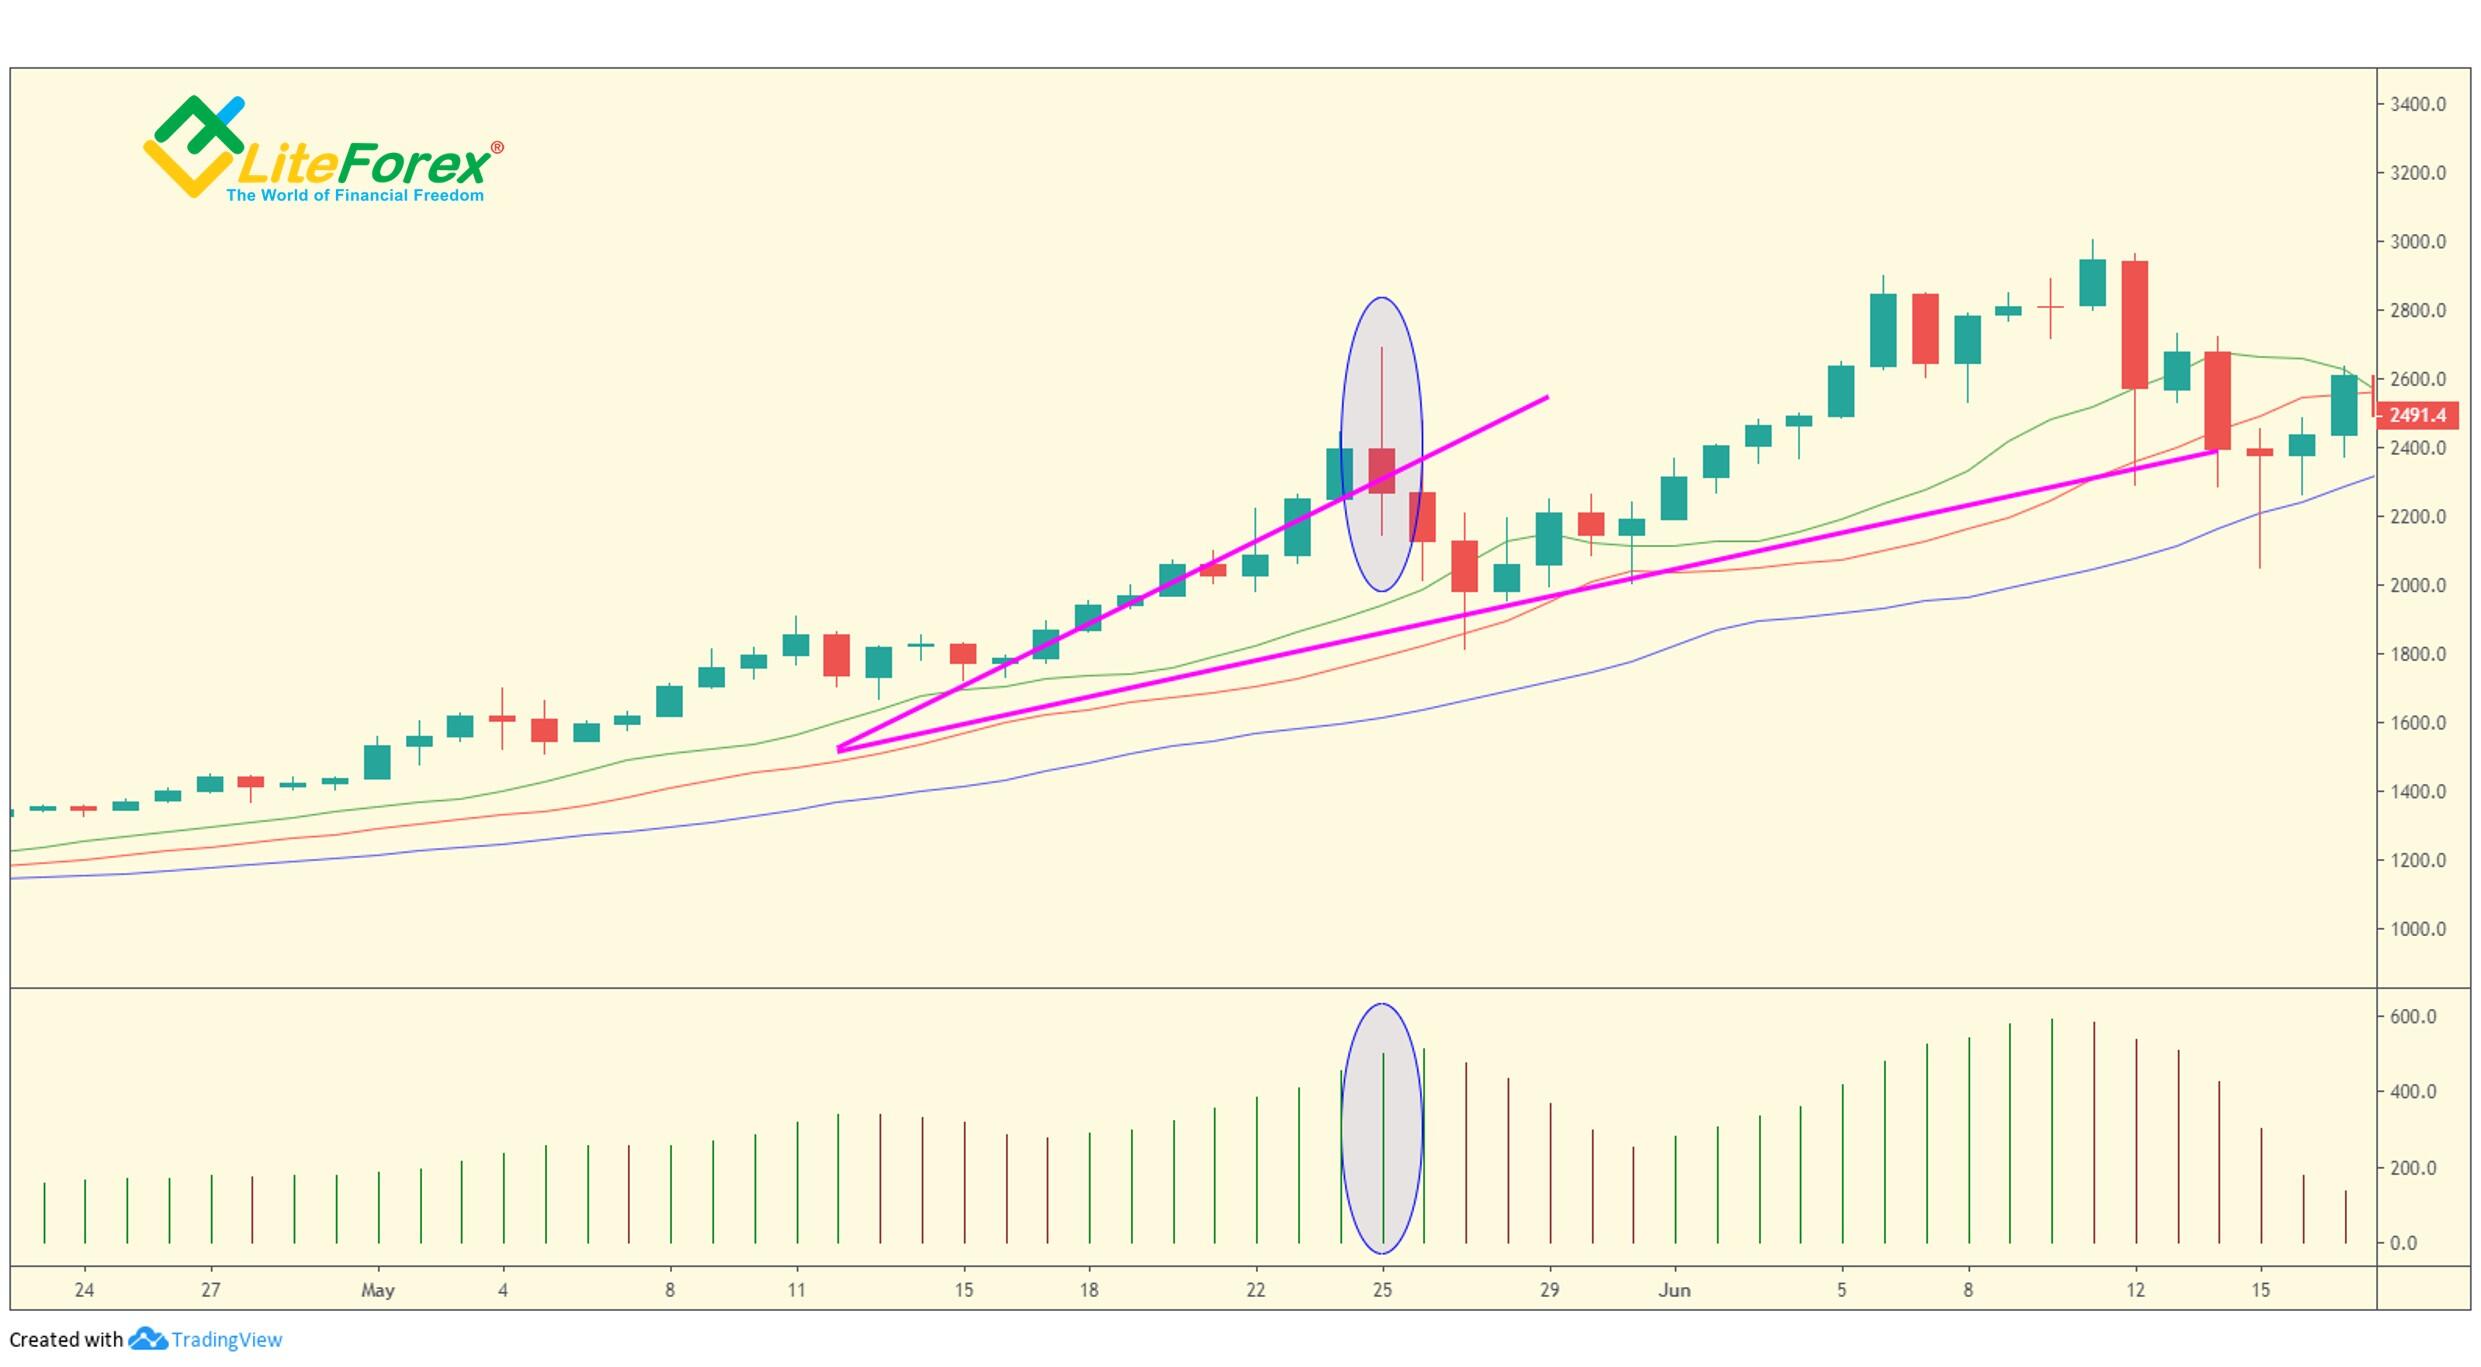
The next important signal is delivered a month after the bullish divergent bar formed. As you see from the chart, this is a bearish divergent bar that is away from the Alligator’s mouth (marked with an oval). The AO also indicates upward momentum.
Another important thing is the angle of the price bars that must be wider than the angle formed by the Alligator’s mouth. If the price bars are angling away from the Alligator, this is a strong signal of a soon trend reversal. Both parameters are marked with purple lines.
As you understand, when a bearish divergent bar appears, we need to exit the long trade. If we entered a short together with exiting the long, the stop loss would work out very soon. However, the loss would be much less than the profit made from the previous trade. This is a vivid example that just a signal of the First Wise Man doesn’t always guarantee that the trade will be winning.
Second Wise Man
The second important signal to enter the market is based on the Awesome Oscillator, you are already familiar with. Its work principle is similar to the famous MACD indicator. The AO measures the immediate momentum in the market. It is a 34-bar simple moving average subtracted from a 5-bar simple moving average.
The indicator looks like a histogram consisting of red and green bars. Green color means that the bar is higher than the previous histogram bar, and red color means that the histogram is lower than the previous bar. Differently put, a series of green bars is a buy signal, and red bars are a sell signal.
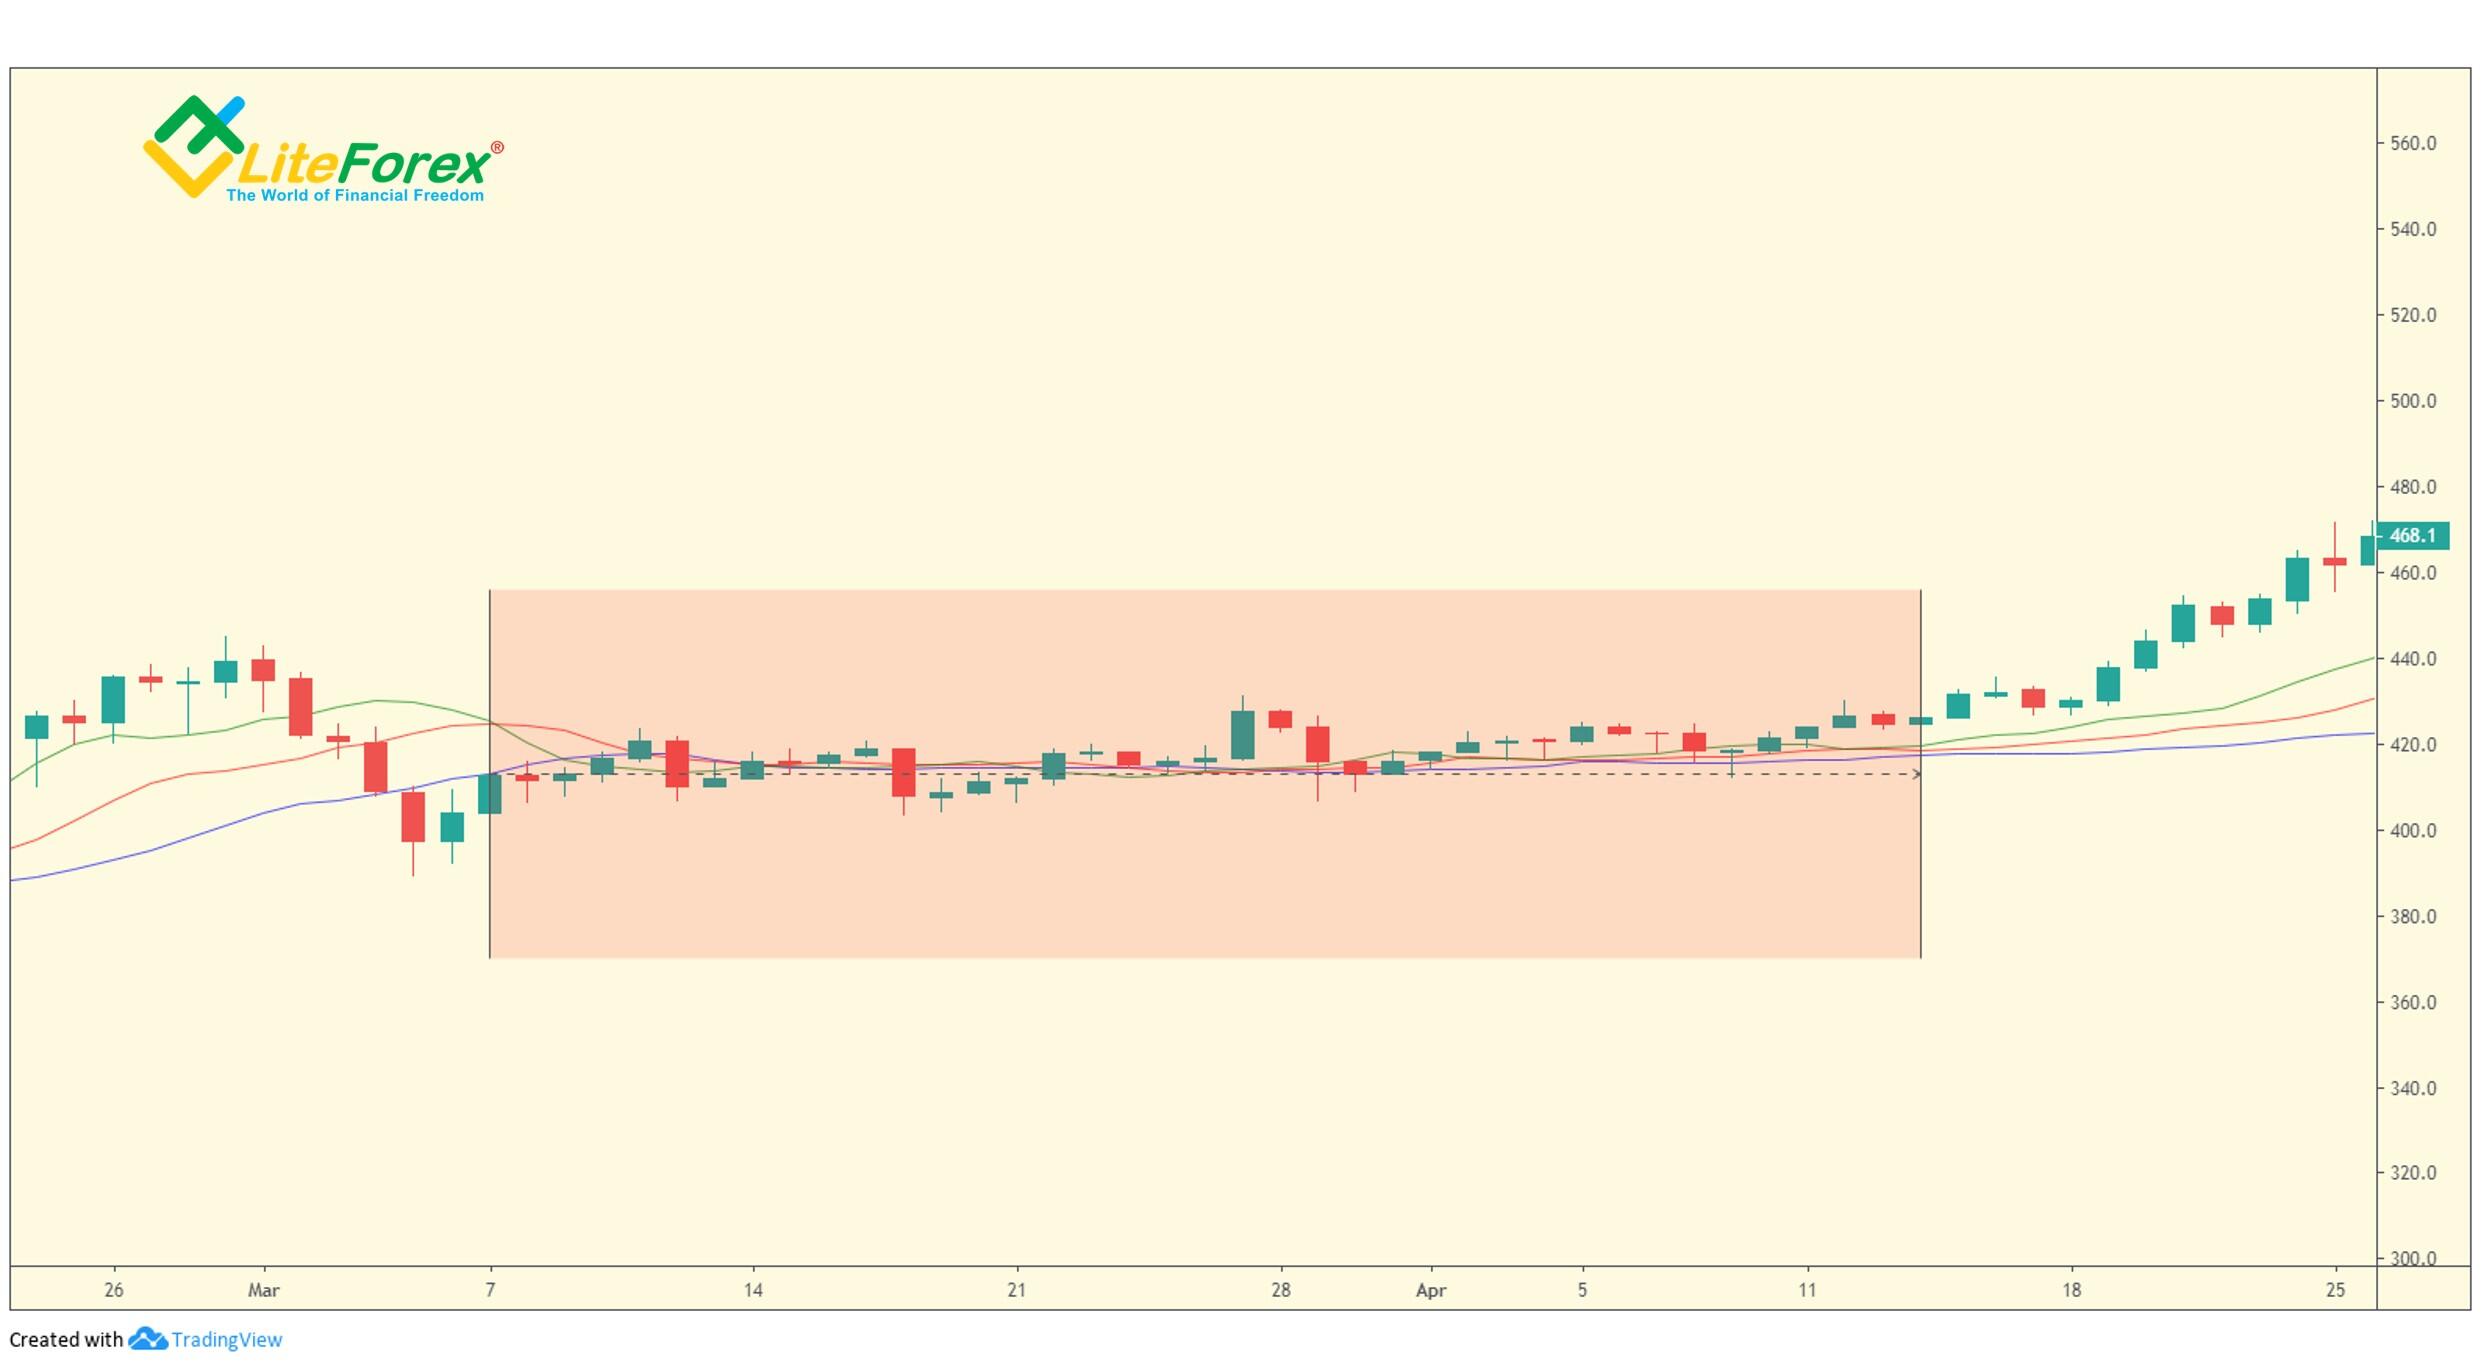
Let study the ways to enter the market and protect your position on the example of the same BTCUSD daily chart.
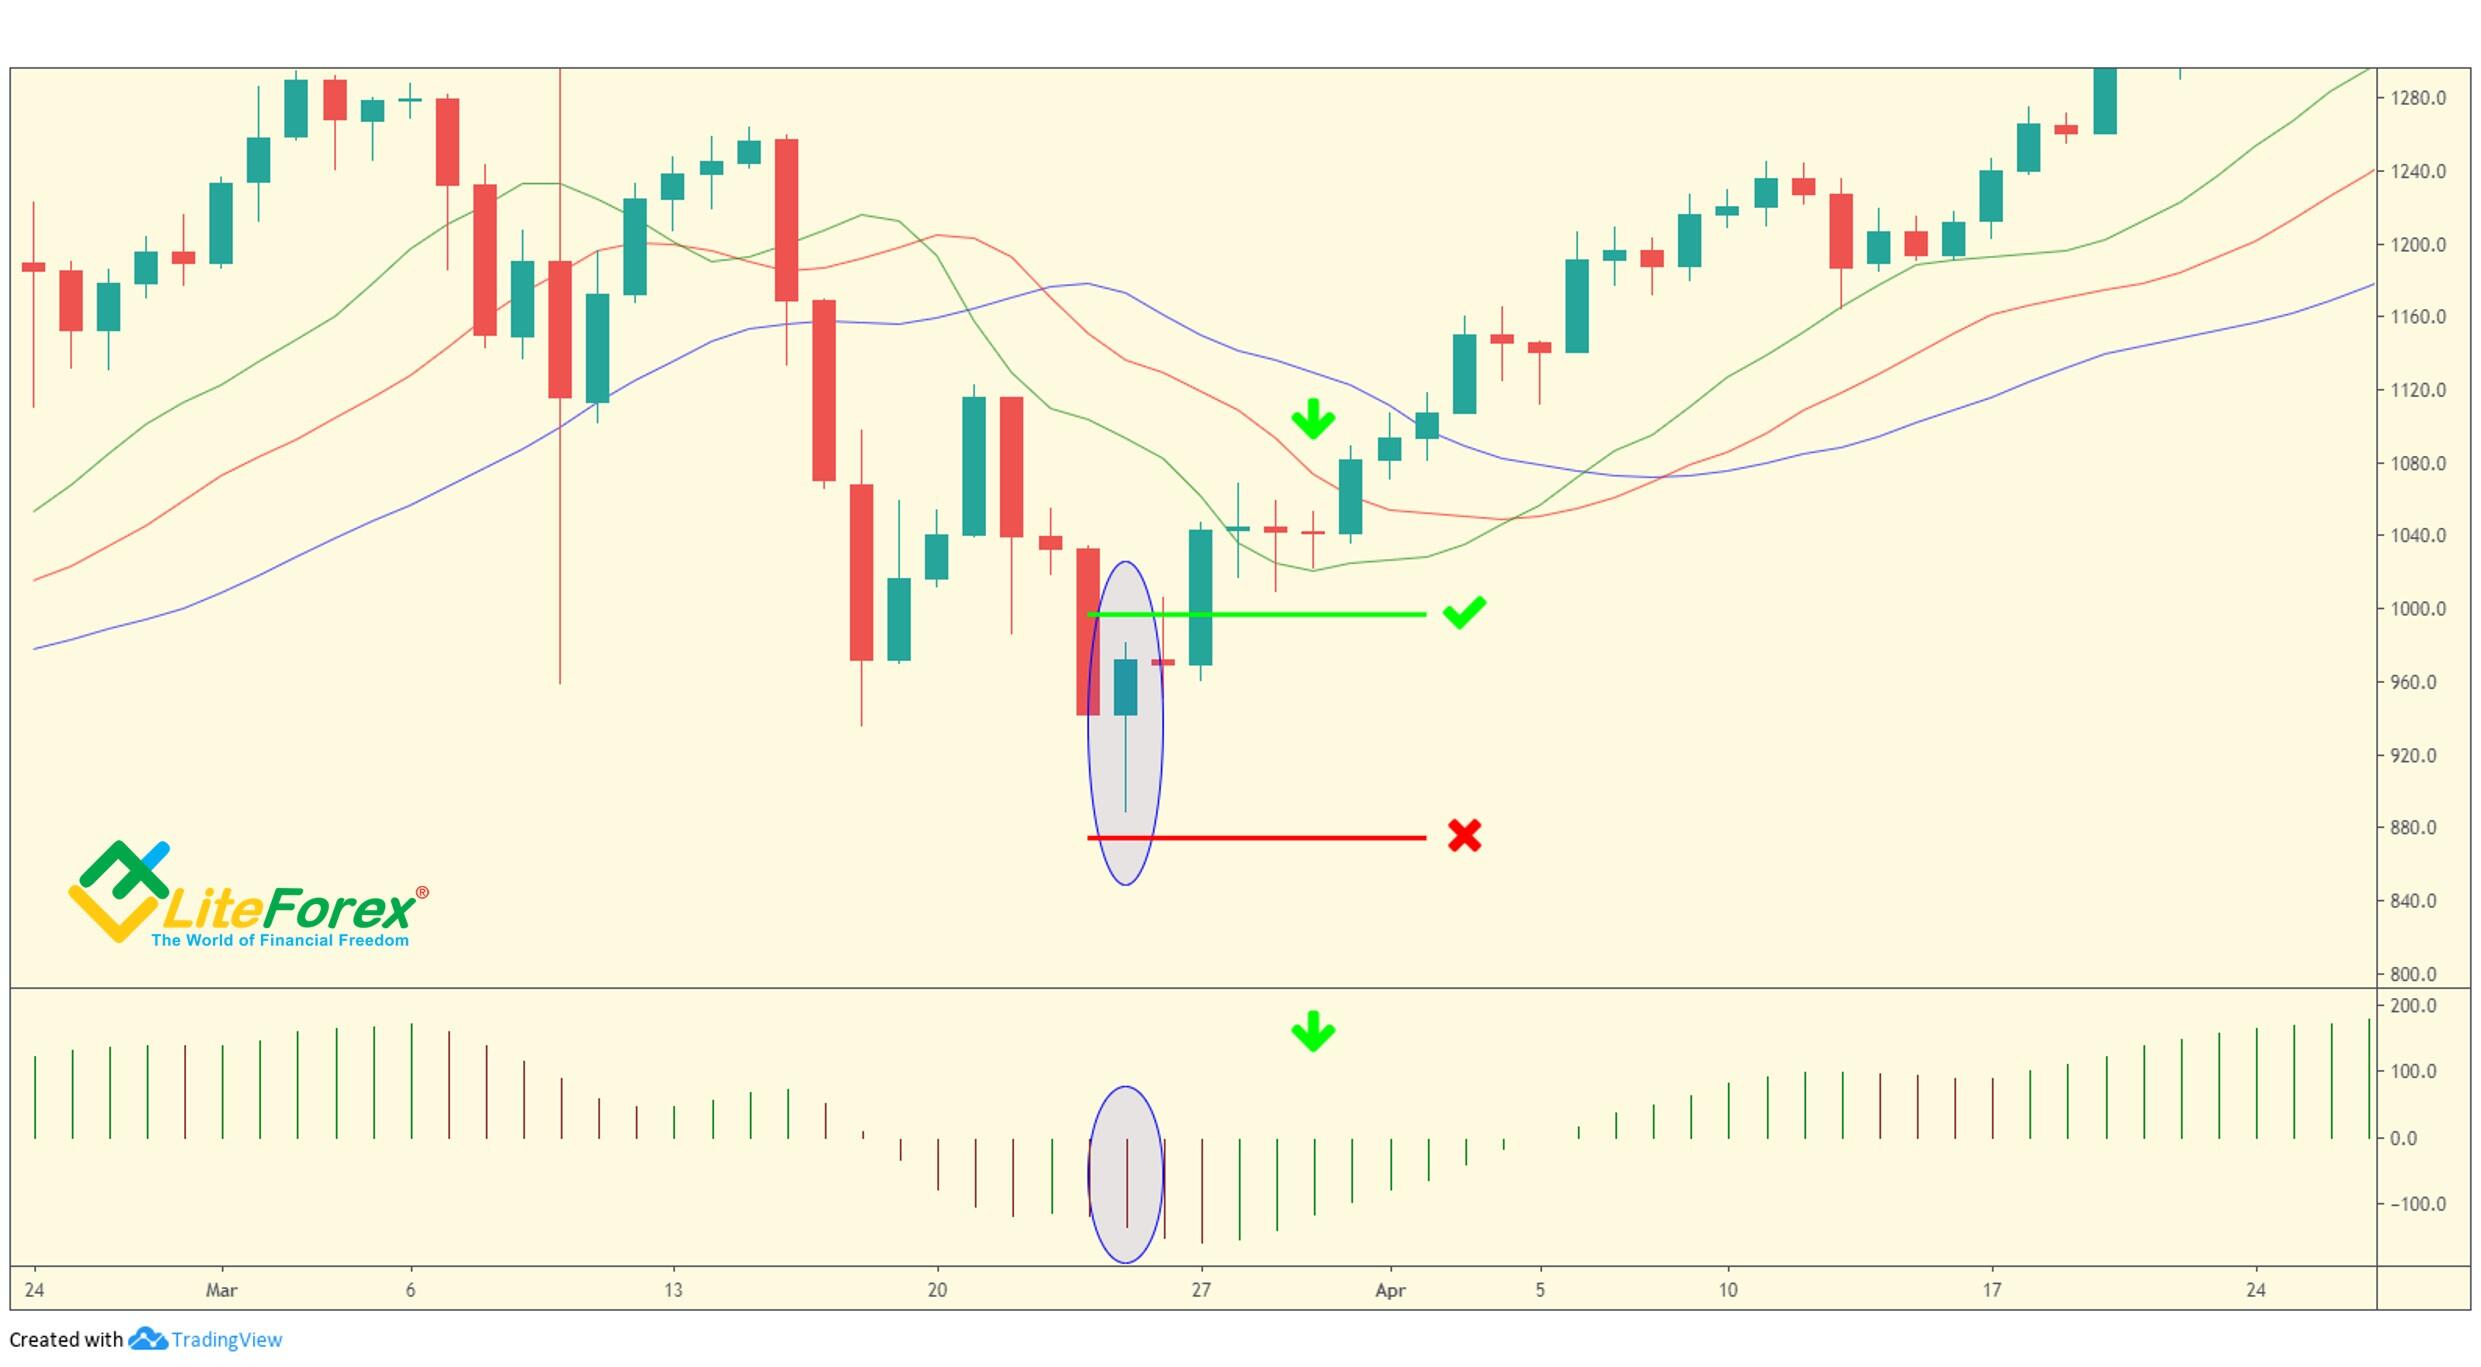
Remember, the oval zone marks the entry point according to the bullish divergent bar, the green and the red lines mark the entry level and the stop level accordingly. Based on the Awesome Oscillator (AO), we add on after three consecutive green bars (if it a beginning bearish trend, there should be three consecutive red bars).
Therefore, the Second Wise man is a signal validating the First one. Some traders use it to put the second entry, they add on to their position after the Second Wise Man signal is created.
The Third Wise Man
Assume that we have entered the market via wise man 1 (bullish/bearish divergent bar) and most likely have added on to our position with wise man 2. And now the market can give us a Fractal signal. It is a breakout of the market after the market has reversed direction as first indicated by the bullish/bearish bar. If this Fractal signal is our third entry, we should have built up some open equity in our first two entries, as it confirms that our identification of a change in trend is valid.
The Fractal pattern is a simple one. The market moves in one direction or the other. Let it be bullish. After a while, all the willing buyers have bought (in an up move) and the market falls back because of a lack of buyers and perhaps short sellers are also coming into the market.
Then some new incoming information begins to affect the traders. There a momentum of new buying, and the is again moving up. This is an ideal moment to add on to our buy position. If the momentum and the buyer’s strength are strong enough to exceed the immediately preceding up Fractal, we would place a buy order y just over the Fractal’s high.
How does a fractal pattern look?
In a bullish market, a Fractal is a series of a minimum of five consecutive bars where the highest high is preceded by two lower highs and is followed by two lower highs. The opposite configuration would apply to a bearish market. The local low is in the middle of the fractal.
Fractals are core formations of the so-called Elliot waves, which I will deal with in my future articles. Now, I want to focus on two important principles.
- What happens between an up and a down Fractal is an Elliott wave of one degree or another.
- One way to trade the Fractal is whenever the market exceeds the outside extreme high on up Fractals and low on down Fractals, go with the outside direction/Fractal point.
Let us study basic types of fractals on the examples.
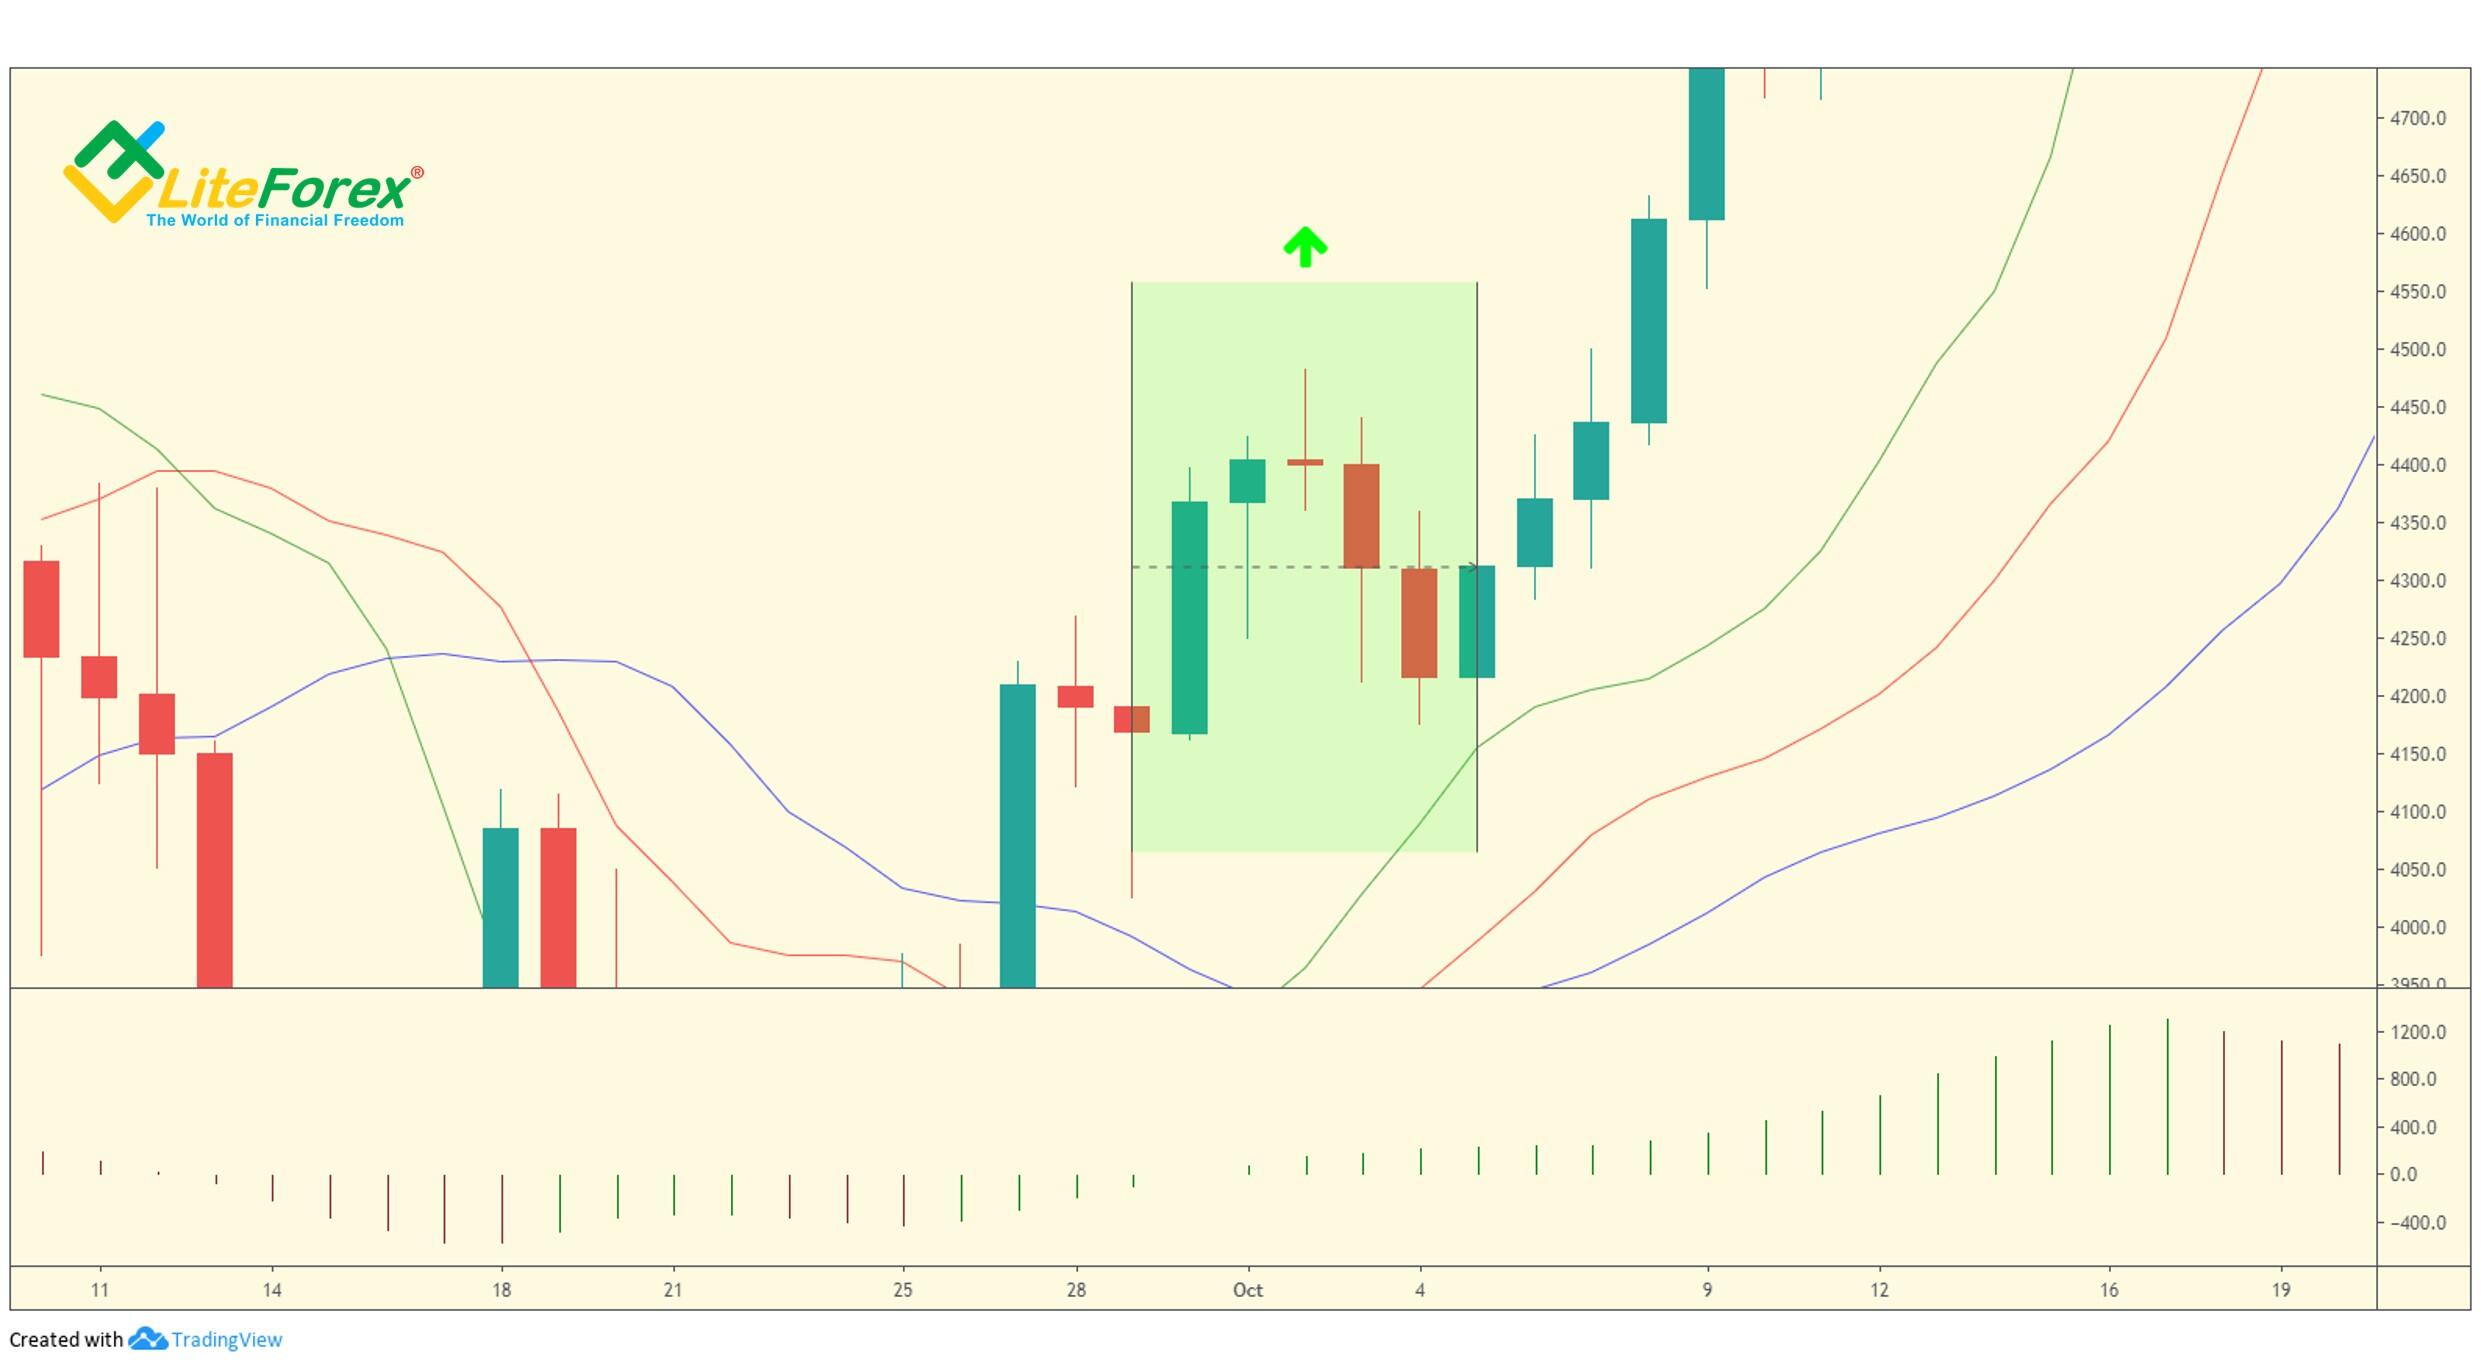
The chart displays a pristine up fractal. The opposite pattern will be a pristine down fractal.
In this pattern, the middle finger creates both an up Fractal and a down Fractal because both the high of the bar is higher than the previous and the next highs, and its low is lower than the lows on the left and the right.
This is an example of a combined fractal formation. The bar marked with the red arrow is both the middle finger of the down fractal and the left bar of the up fractal, whose middle finger is the next bar marked with the green up arrow.
There also can be more than five bars taken to create a fractal, in this case, one of the later bars is the middle finger. But this is quite rare.
Asset allocation strategy
I have already mentioned that one could put the second or even the third entry, thus increasing your profits. Williams considers this approach to be safest, referring to it as reverse pyramiding. The strategy suggests that you enter a trade with the least volume upon the first signal, as it is can be a short-term trend. I have already described the example when a divergent bar resulted only in a shallow pullback.
When the trend grows stronger, there is the Second Wise Man that confirms the trend strength. At this time, it makes sense to add on to the position opened. Next, you should continue investing, gradually reducing the funds you add on. The ideal moment for such actions is the third signal, delivered by fractals.
Getting out of the market and asset protection
The simplest way to protect your assets is by setting a trailing stop at a distance equal to the one between the high of the divergent bar and its low. You can also exit the trade at the lowest low of the three or five preceding bars in a bullish trend, or the highest high in a bearish trend.
Another situation when you need to urgently exit the trade is the reversal signal. Williams recommends exiting the trade when the price is extremely close to the floating stop order.
So, we have studied the theory and the practical application of the Three Wise Man trading strategy. If you like trend trading systems, you should try this method, as it performs great results in any market. It can also be combined with the VSA model and Elliot wave theory.
I wish you good luck and good profits!
P.S. Did you like my article? Share it in social networks: it will be the best "thank you" :)
Useful links:
- I recommend trying to trade with a reliable broker here. The system allows you to trade by yourself or copy successful traders from all across the globe.
- Use my promo code BLOG to get a 50% deposit bonus on the LiteFinance platform. Simply enter this code in the appropriate field when funding your trading account.
- Telegram chat for traders: https://t.me/litefinancebrokerchat. We are sharing the signals and trading experience.
- Telegram channel with high-quality analytics, Forex reviews, training articles, and other useful things for traders https://t.me/litefinance
Price chart of BTCUSD in real time mode
The content of this article reflects the author’s opinion and does not necessarily reflect the official position of LiteFinance broker. The material published on this page is provided for informational purposes only and should not be considered as the provision of investment advice for the purposes of Directive 2014/65/EU.
According to copyright law, this article is considered intellectual property, which includes a prohibition on copying and distributing it without consent.