The most profitable Forex strategy: how to create the Holy Grail with your own hands. Rules for successful trading, examples of strategies for non-standard indicators with examples and screenshots
Working strategies for attentive and patient traders
Every trader wants to press the magic button “Get Money” and skim the cream without any actual effort. Alas, only you do miracles in this world and your success will depend on your patience, experience, and perseverance. The most profitable Forex trading strategy does not exist, but there is a strategy that you will select, prefer and optimize for yourself. I will only give some advice and suggest a few interesting Forex trading strategies. In this review you will find not only recommendations for traders, but also examples of working strategies with indicator templates and screenshots. Take the first step to your success on the Forex market!
You can find hundreds of various strategies online with one or more indicators, for technical and fundamental analysis, scalping or long-term - there are many options, but none of them will be ideal.
Why there is no perfect trading strategy on Forex:
- Different trading conditions. The trading strategy gives signals for opening a position and the trader's task is to enter the market and close the position on time. The effectiveness of the signals depends on the speed of the platform, your internet connection, information processing by the broker (order execution speed), the size of the spread, the accuracy of quotes, the minimum size of stop orders, etc. For different brokers and different accounts, the effectiveness of strategies may be different.
- Market volatility. Strategies for technical indicators focus on patterns of certain situations. Indicators based on mathematical and statistical analysis take into account price behavior in past periods and based on historical data allow us to predict further behavior of the chart. Despite the wave theory (that says all events tend to repeat), we cannot eliminate the influence of the fundamental factor that can spoil the game. Trading based only on fundamental analysis is also not ideal: at the time of market volatility, it is impossible to say exactly which decision the majority of traders will make.
- Artificial market manipulation. Trading is a kind of competition between traders. Their total capital is all the money on the OTC market, and then it does not just appear out of nowhere. When someone earns, someone else loses. And any increase in market capitalization is followed by a recession. Institutional investors and market makers with large capital have the opportunity to manipulate the market in their favor by pushing out the stop orders of inexperienced traders. Naturally, such behavior is unpredictable, which means that at some point a profitable strategy may turn into a loss-making one.
The Holy Grail is not the strategy itself, but your skill in using it: choosing the right timeframe, managing to catch signals while observing risk management, and being able to analyze the results (a trader’s journal will help with this (PirateTrade, Marketstat)).
A perfect most profitable Forex strategy does not exist. Success and effectiveness depend only on the trader and trading conditions. In addition to the constant analysis of the technical indicators, the trader must constantly monitor the fundamental factors that determine the further behavior of the market.
How to become a successful trader:
- Get experienced. By trial and error, you need to learn to see the signals and determine their accuracy. Intraday strategies with infrequent signals are best suited for this.
- Learn to evaluate the effectiveness of strategies using methods of mathematical analysis and statistics. Read more about them in this article.
- Follow the news. Often they determine market trends.
- Learn to control yourself: your emotions and mind.
- Spend as much time as possible on professional forums and participate in related events.
Below I suggest you test several working strategies for indicators that are not very famous, but very interesting. I did not develop them, but the number of successful trades they brought me speaks in favor of their use.
Profitable Forex strategies for non-standard indicators
Once again I would like to stress that the effectiveness of strategies depends solely on the skills of the trader, their ability to see signals and analyze the market.
1. Indicator I_XO_A_H and the strategy based on it
Most traders prefer to trade according to the classic line chart, without going into details of other options built into the trading platform. But maybe they should. The Tic-Tac-Toe graphical trading system is one of the analytical options for showing the movement of prices that indicates the direction of a strong trend. The time interval is irrelevant here. If the price has passed a certain number of points up (for any period), we see a cross, when down – we see a zero. This type of chart cannot be combined with trading volume indicators, but it has several advantages:
- it ignores insignificant price changes (price noise and minor corrections);
- it is not tied to a period;
- it allows you to find trend lines, easily distinguishable resistance and support levels;
- it provides an opportunity to pay more attention to a long-term trend.
This strategy uses the indicator I_XO_A_H together with candlestick analysis. I_XO_A_H is a combined template indicator, which is an attempt to convert the Tic-Tac-Toe graphic system into a histogram. The trading system itself is not used here directly (it is too visually complex for those who are used to candlestick and linear charts), but its indications are interpreted well by I_XO_A_H.
Trading conditions for the strategy:
- asset - EUR/USD;
- timeframe - M30;
- indicator settings: BoxSize = 15.
The indicator contains the so-called reverse coefficient (always equal to 2). It represents the number of boxes (squares) to be passed in the opposite direction for a change of crosses to zero (new row) and vice versa.
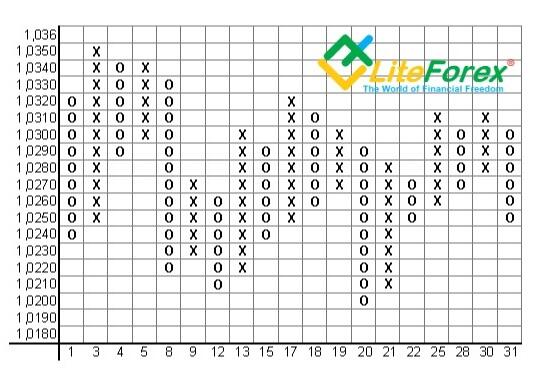
In this figure, the size of the box is 10 points. If the reverse is equal to 2, when the price drops, for example, from 1.0350 to 1.0330, a cross will change to a zero. If the price drops by only 10 points, the graphics system will ignore this movement as price noise. In the indicator I_XO_A_H, the BoxSize is 15 points in a five-digit display (or 1.5 points in a classic four-digit display of the exchange rate of any currency pair).
At first glance, the system seems complicated. That is why I recommend the indicator I_XO_A_H, where all its nuances are already taken into account. You can download the indicator template here. The indicator works based on closing prices.
Opening a buy position:
- trading is conducted from 10.00 to 20.00 Eastern European time;
- I_XO_A_H draws 5 red columns in a row, with each next larger than the previous one;
- I_XO_A_H draws a green column. You can try to open a position on the next candlestick.
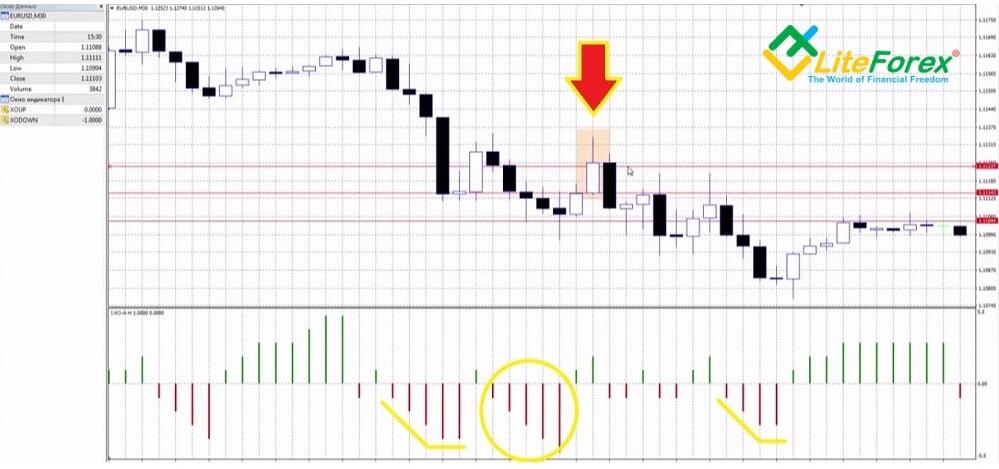
You do the exact opposite for a short position. Upon reaching a profit of 10 points, close 50% of the position and secure the rest with a trailing stop.
Strategy recommendations:
- if I_XO_A_H drew only 4 columns of the same color in a row, it is best not to open a position (the reverse signal is not strong enough);
- if there are columns of the same length, it is best not to open a position.
However, these are recommendations for minimizing risk, as these positions can turn out to be profitable. You can increase the timeframe to H1, but then you will need to adjust the length of the stop and trailing stop, for example, by slightly increasing them.
2. Trading using the RD Combo oscillator
RD Combo is a combined oscillator. It is less popular that Stochastic and RSI, but its formula is better adapted to modern market trends. This indicator allows you to get patterns in the movement of prices that are not visible to the naked eye. However, patterns can be disrupted by the news background, so it is not recommended to open positions during the release of statistical reports and news.
RD Combo is a histogram. As soon as the price passes a certain threshold level, a signal appears that predicts an imminent price reversal. The essence of the strategy for this indicator is that you open positions after the appearance of two columns (candlesticks) that will cross the specified threshold.
Trading conditions:
- timeframe - H1;
- Asset - EUR/GBP.
Despite the fact that signals will appear relatively rarely on this timeframe, it filters price noise and random corrections.
RD Combo settings:
- Do Alert For Entry, Do Alert For Exit (turning on/off the sound alert to open or close a position), Debug Logger, Debug Logger Data (displaying information in the log) – these are optional, you can turn them on or off as desired.
- History Size – 5,000. The number of candles based on which the indicator analyzes and issues a forecast;
- Color Theshold - 5. Threshold level. After the price passes this threshold, colored columns appear;
- Noise Filter RVI - 0.03 (noise filter, set this value without going into details);
- Levels (4, -4).
Find RD Combo with basic settings here.
The condition for entering the market is simple: as soon as RD Combo draws two red bars, this means that a reversal is coming and a long position can be opened on the next candle.
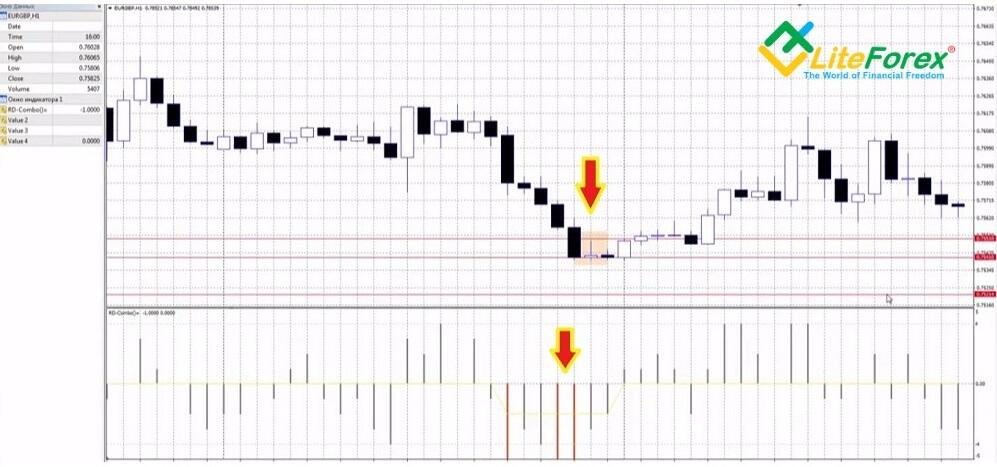
You can set the stop order length as you see fit (optimally 20 points). After you get 10 points of profit, a third of the trade can be closed, the second third is closed upon reaching a profit of 20 points, the rest is secured by a trailing stop. Opening a short position is similar: the appearance of 2 green columns is a signal to open a position. If the strategy is not working great, it is reasonable to decrease or increase the Color Threshold.
3. OnChart Stochastic - a strategy based on modified Stochastic
The stochastic oscillator is considered to have been created in the mid-1950s. According to the legend (it is hard to say whether it is true), the indicator was created by George Lane and was not originally intended for trading. The goal was to develop a formula that would calculate the amount of limestone during the smelting of iron ore to produce steel. By adjusting the formulas a little, someone managed to get several oscillators, which subsequently gave rise to the Stochastic.
We can say with confidence that this oscillator is the most popular indicator ever, but nothing is perfect and there are already several improved modifications:
- DS Stochastic. The version of the oscillator, where, theoretically, the delay problem should be eliminated by applying EMA smoothing.
- ADX + Stochastic_alerts. Combined indicator, where the Stochastic is combined with ATR and sound alerts to open and close a position.
- ZeroLag Stochs true. Another version of the oscillator with zero delay and signal amplification. According to the author, the indicator gives a signal 2-3 candles earlier. But whether this is an advantage is a rhetorical question.
- DiNapoli Stochastic. Here, the DiNapoli smoothing system is applied, which removes price noise. I suggest that you decide for yourself how correctly this version works. By the way, it is often combined with MACD.
- OnChart Stochastic. An interesting but controversial version that is convenient from a visual point of view. It places stochastic lines directly on the price chart. This is somewhat convenient, but it lacks the option to track level crossing, which is a signal. An example strategy based on it is described below.
Trading conditions:
- asset - USD/CHF;
- timeframe - M15.
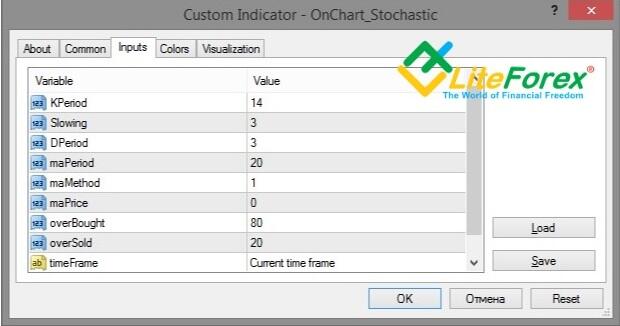
The indicator settings are in the screenshot below. You can find the template with basic settings here.
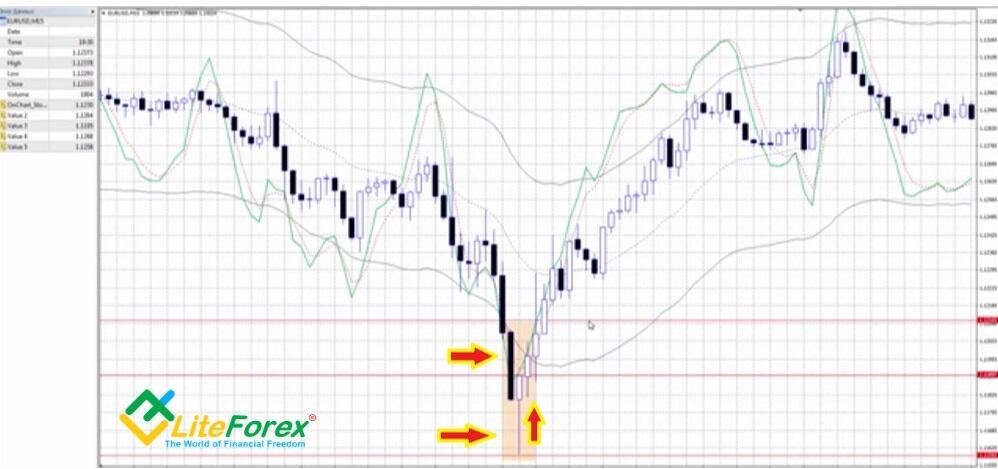
Opening a buy position:
- a decreasing candle closes below level 20 under the Stochastic, i.e. in the oversold zone;
- there is a reversal pattern consisting of several candles: the 1st or 2nd candle has a big shadow down, the second candle has a longer body and closes above the 20th level.
We open a position on the next candle with a stop order from 10 to 30 points. Close the position upon achieving a profit of 20 points.
Opening a sell position:
- A growing candle closes above level 80 over the Stochastic, i.e. in the overbought zone;
- there is a reversal pattern consisting of several candles: the 1st or 2nd candle has a big shadow up, the second candle has a longer body and closes below the 80th level.
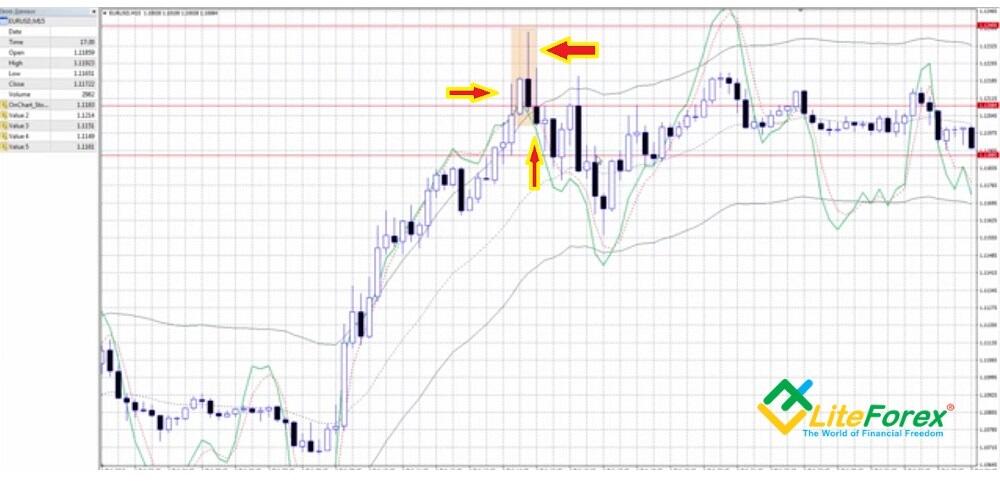
If all these requirements are strictly observed, there will be few signals. You can try opening positions on less obvious reversal patterns.
Under no circumstances should you run strategies immediately on your main trading account. First, learn how to quickly find signals on a demo account, and then, after making sure of their effectiveness, try to work in the real market. I hope you enjoy the strategies and I look forward to your feedback and opinions in the comments.
P.S. Did you like my article? Share it in social networks: it will be the best "thank you" :)
Useful links:
- I recommend trying to trade with a reliable broker here. The system allows you to trade by yourself or copy successful traders from all across the globe.
- Use my promo code BLOG to get a 50% deposit bonus on the LiteFinance platform. Simply enter this code in the appropriate field when funding your trading account.
- Telegram chat for traders: https://t.me/litefinancebrokerchat. We are sharing the signals and trading experience.
- Telegram channel with high-quality analytics, Forex reviews, training articles, and other useful things for traders https://t.me/litefinance
Price chart of EURUSD in real time mode

The content of this article reflects the author’s opinion and does not necessarily reflect the official position of LiteFinance broker. The material published on this page is provided for informational purposes only and should not be considered as the provision of investment advice for the purposes of Directive 2014/65/EU.
According to copyright law, this article is considered intellectual property, which includes a prohibition on copying and distributing it without consent.