How to get started in Technical Analysis? I suggest you get familiar with standard indicators, which are always available in your trading terminal. You do not need to invent something complicated as you can also find the right combination of standard tools and their settings.
This overview deals with a straightforward and profitable trading system based on CCI, RSI, and Stochastic. I will also explain how to explore trading signals in the LiteFinance trading profile to enter and exit.
The article covers the following subjects:
Major takeaways
| Main Thesis | Insights and Key Points |
|---|---|
| What is Stochastic/RSI/CCI confirmation: | Stochastic, RSI, and CCI are standard indicators in most trading platforms. The CCI (Commodity Channel Index) indicates price deviation from its average value, signaling overbought and oversold zones. Similarly, RSI and Stochastic also indicate these zones, but with different calculation formulas. |
| Importance: | Combining Stochastic, RSI, and CCI can enhance trading performance. Individually, these indicators might have flaws and can send false signals. However, when used together, they form a profitable forex trading system suitable for both day traders and position trading. |
| How does it Work: | The strategy involves using three oscillators: RSI (period 14, levels 35 and 65), Stochastic oscillator (14, 1, 3), and CCI (period 14). Buy or sell signals appear when price movements go outside the overbought/oversold zones, confirmed by all three indicators. Entry conditions for both long and short trades are based on the simultaneous movement of these indicators. |
| Advantages and Disadvantages: | The advantage is the strategy's simplicity with clear entry signals, yielding an average profit of 10 pips per trade. However, the indicators must enter signal zones and start reversing simultaneously, which can be a limitation. Also, there's a risk when indicators don't align perfectly or during significant news releases. |
Stochastic/RSI/CCI confirmation – a simple trading strategy with standard indicators
CCI, RSI, and Stochastic are standard indicators built-in most trading platforms. You can read more about the RSI (Relative Strength Index) in this article. An ultimate forex trader guide to the Stochastic is here.
The CCI (Commodity Channel Index) indicates the price deviation from its average value. A high CCI value means that the price is too high compared to the average value; a low value means the asset is undervalued. Like the RSI and Stochastic, the CCI also indicates overbought and oversold zones, and only the calculation formula is different.
A stochastic/RSI/CCI trading strategy
There are no ideal technical indicators. All technical tools have their flaws, and they could send false signals confusing beginner traders. But if each indicator individually yields a profit/loss ratio of, for example, 50/50, why not just combine them, thereby improving trading performance?
One way is to attach to the chart several tools of the same type with different periods. Examples of such multiple-indicator strategies employing several stochastics to EMAs (exponential moving averages) are described in this overview.
A stochastic/RSI/CCI trading strategy employs a combination of three basic oscillators, which could be confusing when used separately. However, the three oscillators used together make up a profitable forex trading system. The trading system is suitable for both day traders and position trading.
Input parameters. The trading asset is EURUSD, but you can trade other financial instruments as well. The working timeframe is M15. I do not recommend trading on shorter time frames, but you can try to open positions in the longer term.
The signal to buy or sell appears when the price movements go outside the overbought/oversold zones, which is confirmed by all three indicators.
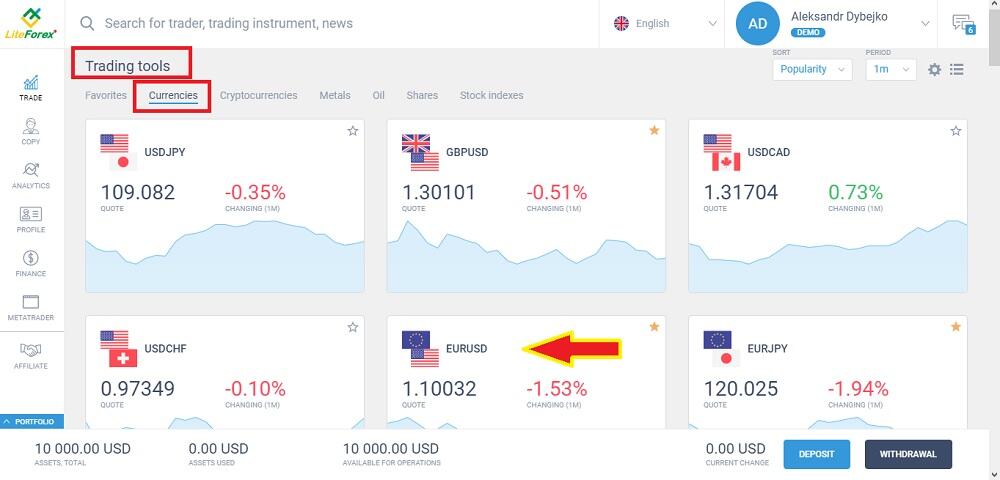
Step 1. Open your personal profile. You can learn more about the creation and functions of the LiteFinance personal profile here. Select the EURUSD in the Trading tools/Currencies tab.
Step 2. Set the M15 timeframe (it is indicated with an arrow), in the Indicators menu, choose the following tools and specify the following settings to trade forex:
Relative Strength Index (RSI) – period 14, levels 35 and 65.
Stochastic oscillator (Stoch) - (14, 1, 3).
Commodity Channel Index (CCI) – period 14.
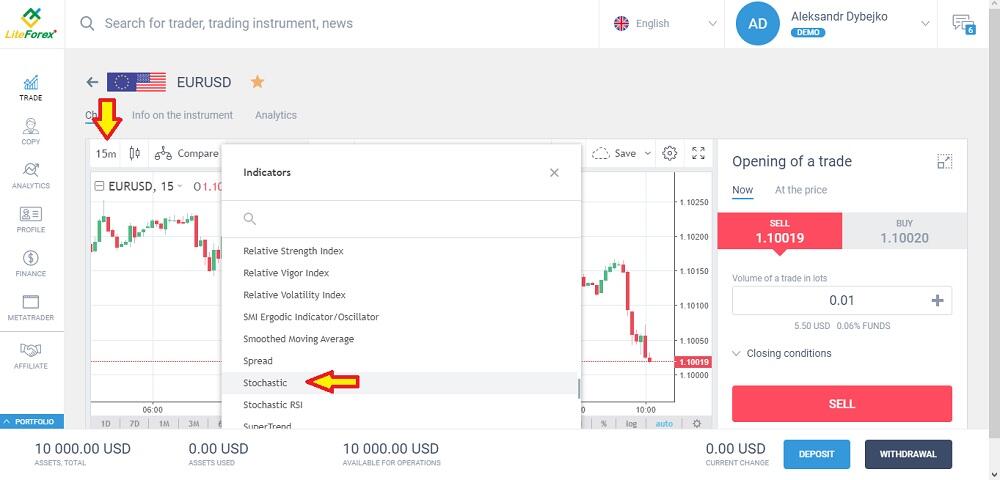
When you choose the indicator, it appears in the chart. To change the settings, you should click on the indicator arrow on the chart. In the menu that opens, you click on the Properties menu, and there will pop up the information window so that you can alter random variables.
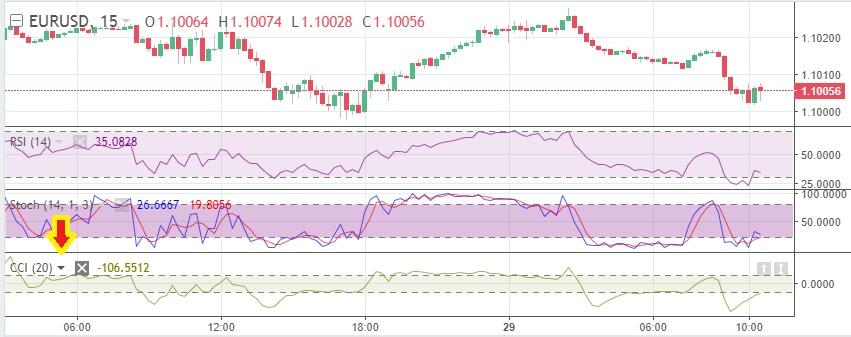
Step 3. Open the chart’s full screen and expect until there will be entry conditions of the trading system.
Entry conditions for a long trade:
RSI is in the oversold zone (below level 35) and turning up to exit the zone.
The stochastic is in the oversold zone (below level 20), and both lines are turning up to exit the zone.
CCI is in the oversold zone (below level – 100) and is turning up towards the center.
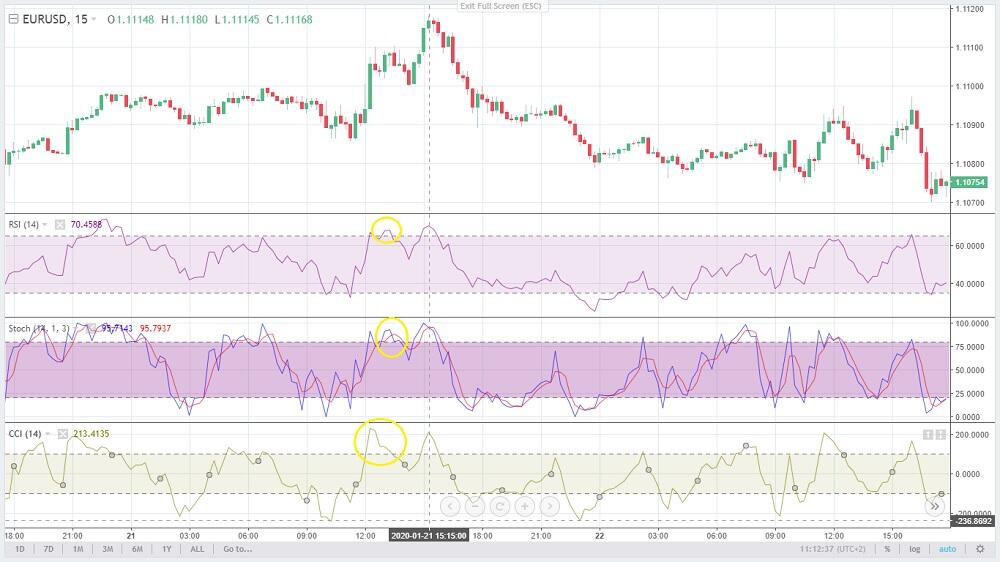
All the three indicators must be in the oversold zone and start turning up at the same candlestick (one of the indicators could be 1-2 candlestick later, but this means high risk). Enter a trade at the next candlestick. The target profit is 10-20 pips. According to the risk management rules, a stop loss is 3-5 pips below the local low.
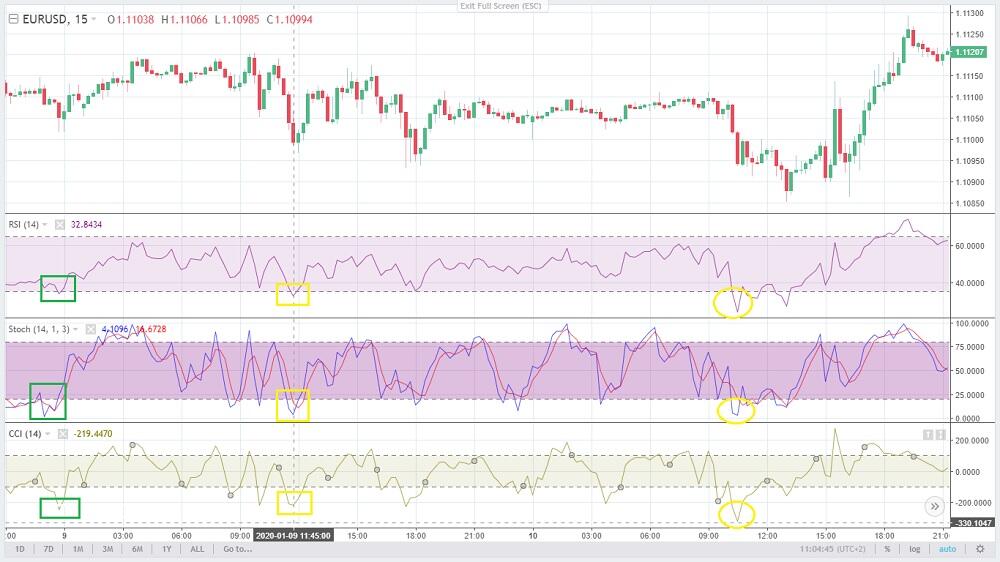
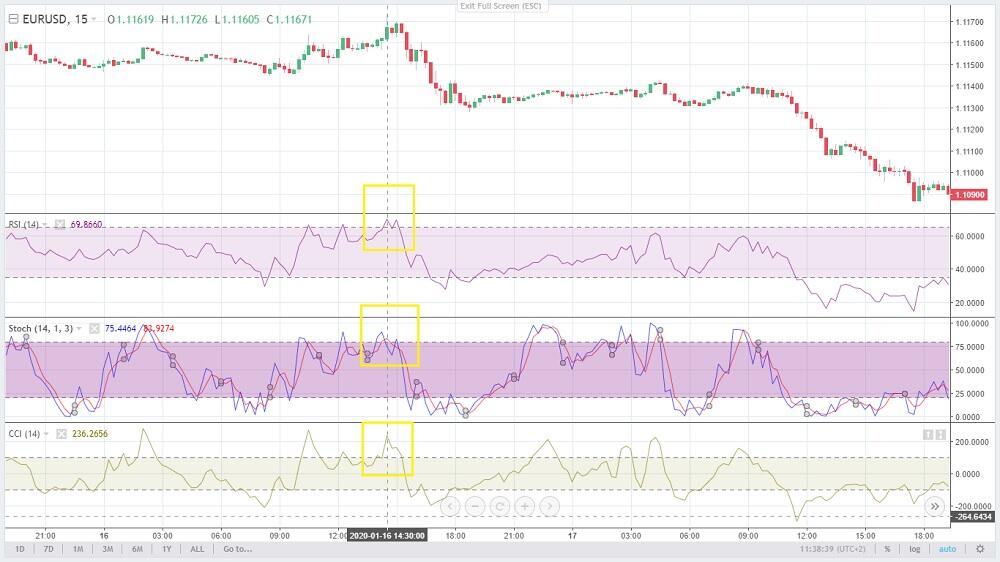
Yellow boxes mark an ideal entry moment. At the red signal candlestick, all indicators are simultaneously exiting the oversold zones and turning up. We enter a trade at the next candlestick.
Green boxes mark a similar situation with a weaker signal – the RSI only touches the level. Nonetheless, the trade is winning. Yellow ovals mark the signal in the forex market, which corresponds to the strategy’s entry conditions, but it is false.
Entry conditions for a short trade
The RSI is in the overbought zone (above level 65) and turning down to leave the zone.
The Stochastic is in the overbought zone (above level 80), and both lines are turning down to exit the zone.
The CCI is in the overbought zone (above level 100) and turning in down towards the center.
In the above chart, there are only two cases when all indicators are in the overbought zones. However, in the first case, the CCI is already going back into the corridor while the stochastic is just starting to reverse.
So, we do not enter a eur usd short trade. In the second case, all signals of trading opportunities perfectly coincide as the strategy rules require. The profit is about 20 pips.
The screen below displays a short position entered in a less clear situation.
RSI and CCI are turning down, but the Stochastic isn’t. It has partially entered an overbought zone, and the reversal is not apparent. The RSI and the CCI are primary indicators in this strategy, so we can ignore a small deviation in the Stochastic value.
In such cases, it makes sense to look at longer timeframes to identify the trend of the market moves. In this case, the risk is justified.
You should not enter a trade in the following cases:
1. Indicators have not started to reverse. If one of the indicators doesn’t take the horizontal position, expect until 1 or 2 candlesticks form and indicate the closing price. If the indicators do not reverse, you shouldn’t enter a trade.
2. Indicators enter the overbought/oversold zones at different candlesticks; some of them look messy. The example is displayed in the chart below.
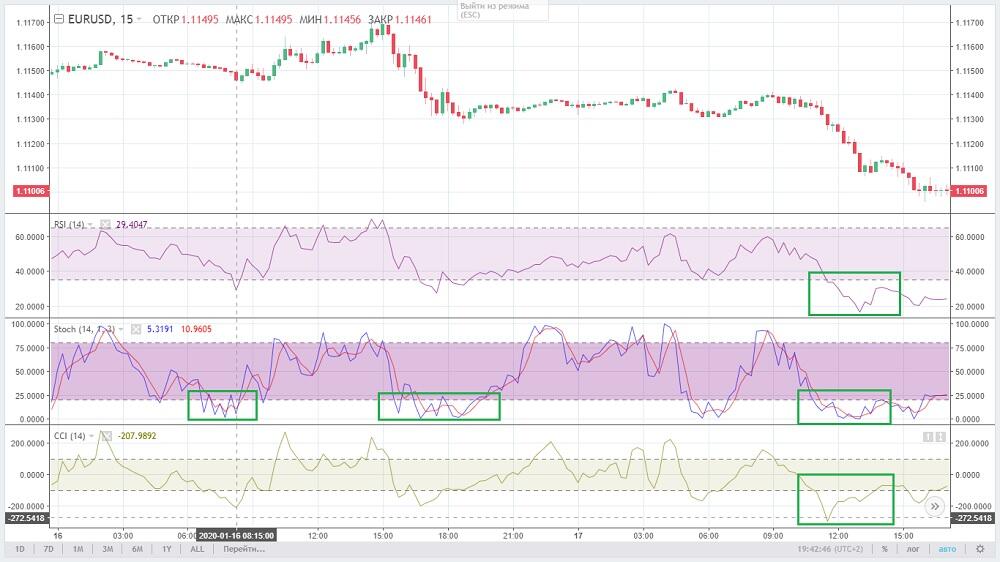
Green boxes mark the zones of messy movements, which mean market uncertainty. If there are difficulties with defining the signal zones, change the Stochastic settings from (14, 1, 3) to (14, 3, 3). In this case, the angles will look smoother.
3. During the time of important news releases according to the economic calendar.
Conclusion
The Stochastic/RSI/CCI trading strategy is simple with clear entry signals. Again, the indicators must enter the signal zones and start reversing simultaneously.
One trade yields an average profit of 10 pips; the signals appear once a day on average. If you still have any questions or ideas to share – write in the comments! I wish you success in trading!
P.S. Did you like my article? Share it in social networks: it will be the best "thank you" :)
Useful links:
- I recommend trying to trade with a reliable broker here. The system allows you to trade by yourself or copy successful traders from all across the globe.
- Use my promo code BLOG to get a 50% deposit bonus on the LiteFinance platform. Simply enter this code in the appropriate field when funding your trading account.
- Telegram chat for traders: https://t.me/litefinancebrokerchat. We are sharing the signals and trading experience.
- Telegram channel with high-quality analytics, Forex reviews, training articles, and other useful things for traders https://t.me/litefinance

The content of this article reflects the author’s opinion and does not necessarily reflect the official position of LiteFinance broker. The material published on this page is provided for informational purposes only and should not be considered as the provision of investment advice for the purposes of Directive 2014/65/EU.
According to copyright law, this article is considered intellectual property, which includes a prohibition on copying and distributing it without consent.