One of the main trader's goals is to determine the trend to open a profitable position and get profits. When the market experiences high volatility, professional traders often use unconventional technical tools, and a Tic-Tac-Toe chart is one of them.
This article describes the properties and unique features of the Tic-Tac-Toe chart, providing hands-on examples of trading strategies that employ it.
The article covers the following subjects:
Understanding a Tic-Tac-Toe chart
A Tic-Tac-Toe chart is likely the first price chart that is not directly related to Japan. The first documented reference to this concept can be traced back to 1881. It was discovered through open-source research that the Tic-Tac-Toe chart first appeared in the US and was presented by Joseph Klein and Charles Dow. The Tic-Tac-Toe method of technical analysis is especially popular among traders and investors in North America.
The chart's construction is similar to that of the Renko chart. You can also set the size of the price unit (block) that looks like "X" (green crosses) when the asset's quotes rise, and like "O" (red circles) when the price declines.
How does a Tic-Tac-Toe chart form?
In the market, the price moves up or down during a certain period, and the Tic-Tac-Toe chart paints X's or O's, respectively. The number of X's and O's is the multiple of the block size. Besides, the remainder is always removed, so the chart shows only the whole number of blocks.
If the price remains unchanged during a given period, the chart will not form any X's or O's. Therefore, one column of X's or O's can be constructed for an indefinitely long time, depending on the market situation and the block size.
Another feature of the Tic-Tac-Toe chart is the reversal parameter. It shows how many blocks in total the price should move in the opposite direction so that the chart starts a new column.
Most often, the default value is three blocks. For example, if the block size is $100, the price should correct downward by at least $300 during the upward trend to create a new column of three O's. The same is true for a downtrend.
Charles Dow called it a book chart, as traders kept track of prices, writing them down in columns in their books or notebooks. The indicator’s features make it quite concise, so you can draw a few-year history of price movements on a single sheet of paper, provided the block size is big enough.
Modern technologies spare traders the need to draw the chart manually. Let's consider the Tic-Tac-Toe chart and compare it with the classic candlestick chart.
How to trade using a Tic-Tac-Toe chart
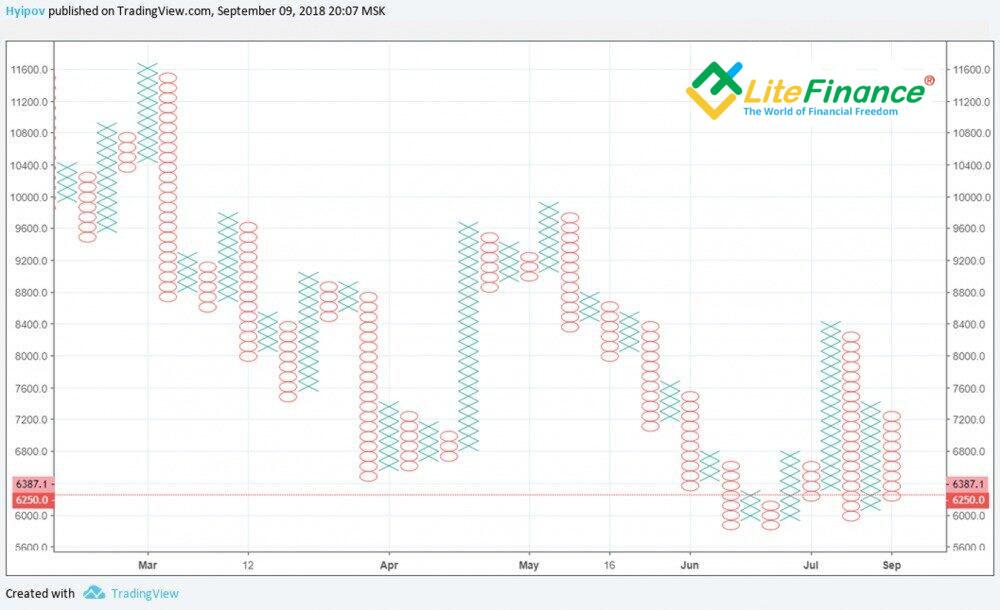
Let's take the BTCUSD pair on the 4-hour time frame.
To make it easier to compare the Tic-Tac-Toe chart with the Renko chart and other non-standard charts, a block size of $125 and the reversal parameter of 3 blocks are set.
Notably, there are special features of the Tic-Tac-Toe chart construction:
The blocks are counted starting from zero (0).
The blocks are drawn according to the closing prices without considering the price extremes.
The block boundaries (Xs and Os) do not depend on the prices and serve for visualization only, so the column length is calculated starting from the center of a X or an O, rather than from its boundaries.
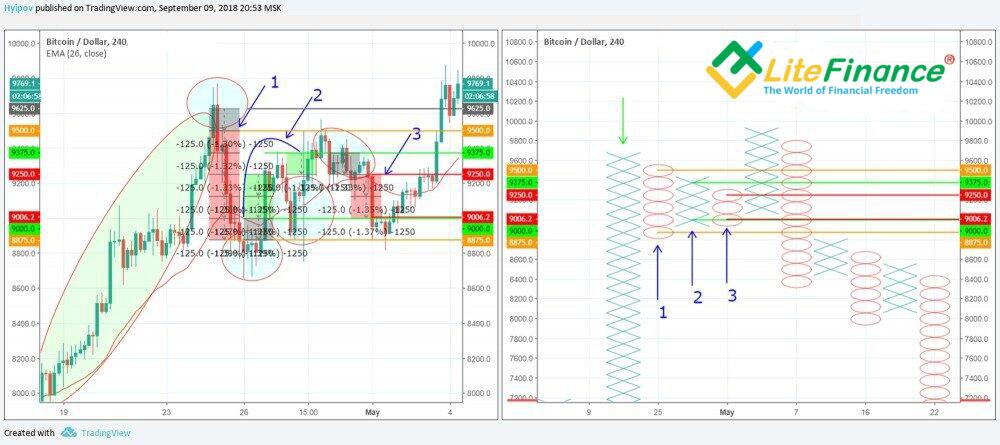
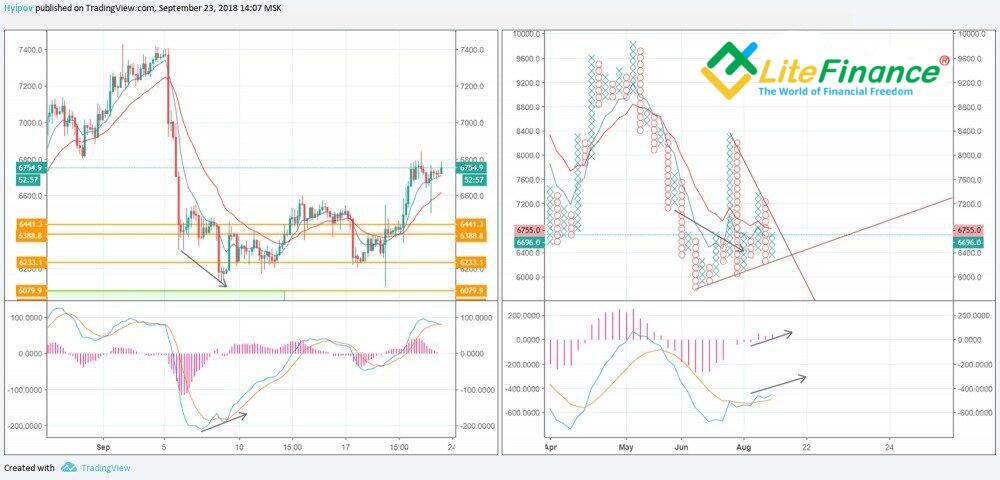
The above chart on the right side demonstrates a rising column of X's under the green arrow. On the Japanese candlestick chart, it is marked with a large green circle.
On April 25, the price started to reverse. Since the reversal parameter value is at 3 and the block size is $125, the column of red O's appears during a drawdown of $375.
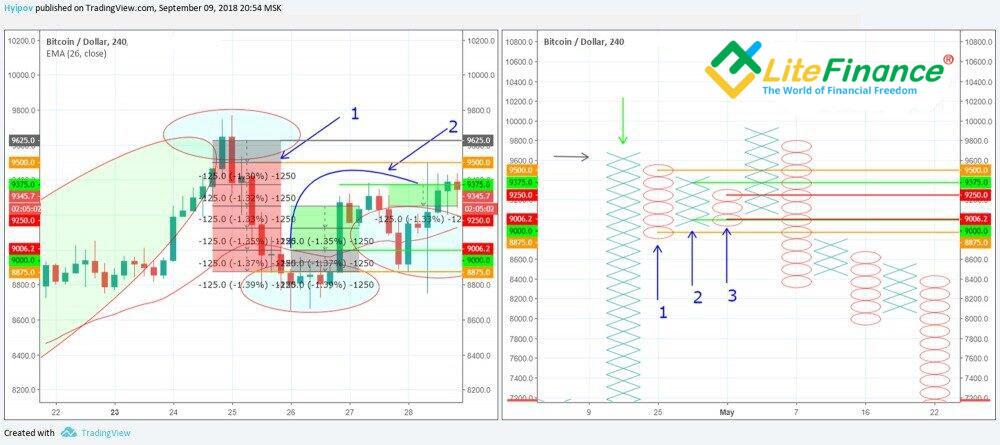
The last full block of this green column closed at $9,625. It is marked with a gray arrow on the chart.
After the price dropped below $9,250, going down by $375 from the $9,625 mark, three first O's formed on the chart. At the same time, the first O will always be lower by one unit than the last X of the previous column.
Due to the fact that the column's length is counted from the center of an X or an O, the column of six O's on the chart starts from the second unit.
The last full block of the first 0's column closed at $8,875. At the same time, several candlesticks failed to fit into the last block and form their own one. Therefore, the chart does not show them. On the Japanese candlestick chart, such candlesticks are marked with a lower blue-filled circle.
After that, the price started to build the wave 2. It is marked with a blue arrow 2.
Due to one big green candlestick, the length of which is more than $375, the condition of 3 blocks was met at once. A new column of X's appeared, starting from the second green block at $9,000.
The price corrected after the rapid growth but failed to overcome the $375 threshold. The correction is not shown on the Tic-Tac-Toe chart, i.e. it was taken as a random movement.
The price continued to grow and exceeded $9,250 by $125. Thus, another X in the column was formed.
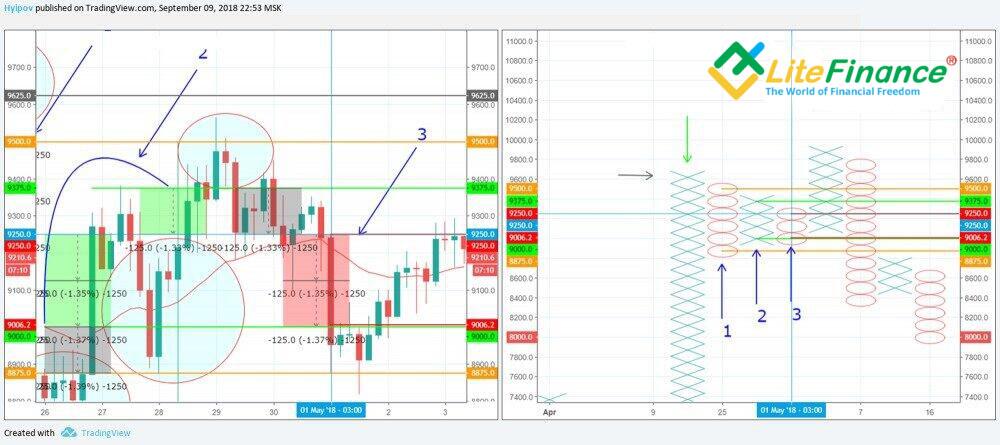
Next, the situation repeats in the opposite direction.
The last full block was formed at $9,375. However, the price failed to make a step of $125 after the candlestick closed.
Then another correction followed. Notably, the condition of three blocks was met only on May 1. As a result, it was at that moment that a new column of three red O's appeared on the Tic-Tac-Toe chart.
The main advantage of the Tic-Tac-Toe chart is that you can apply graphic analysis to this type of chart.
Moreover, the common patterns of graphic analysis work according to the same rules as usual.
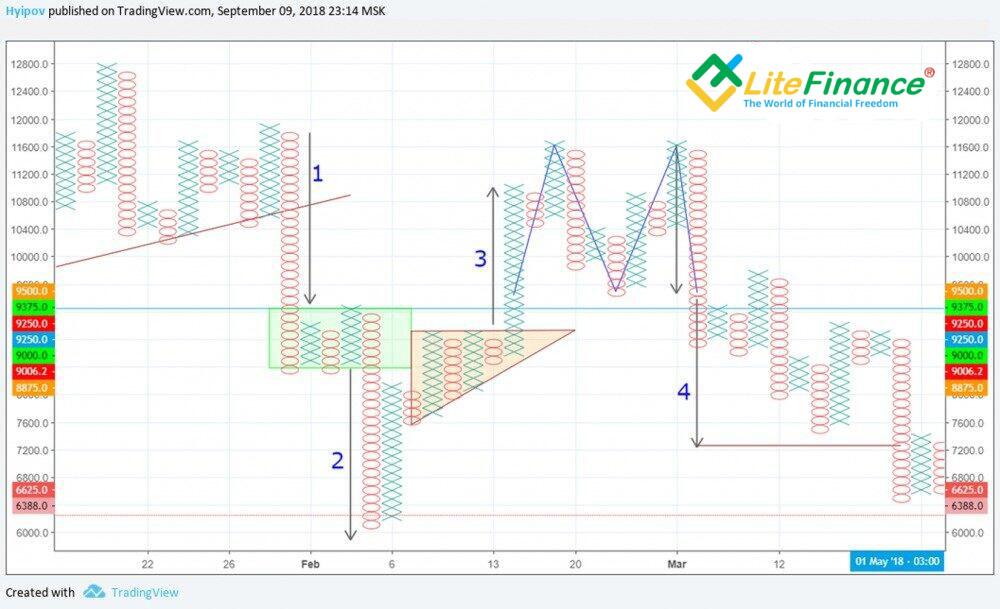
The chart above shows a whole set of different patterns:
1 - the uptrend's lower boundary was breached;
2 - a "Bearish flag" pattern was formed;
3 - an "Ascending triangle" pattern's upper boundary was broken through;
4 - a "Double top" pattern appeared.
A "Head and shoulders" pattern and equilateral triangles are also common on these charts.
The rules of working with these patterns are similar to those that are built on the Japanese candlestick chart, you can read more about them in this article.
A practical example of trading on the Tic-Tac-Toe chart
As an example, let's consider the BTCUSD chart. According to the initial forecast, a sideways movement was expected; it can be seen on the Tic-Tac-Toe chart. This was evident from the support level that was building on the chart. The MACD indicator does not point to a clear trend direction.
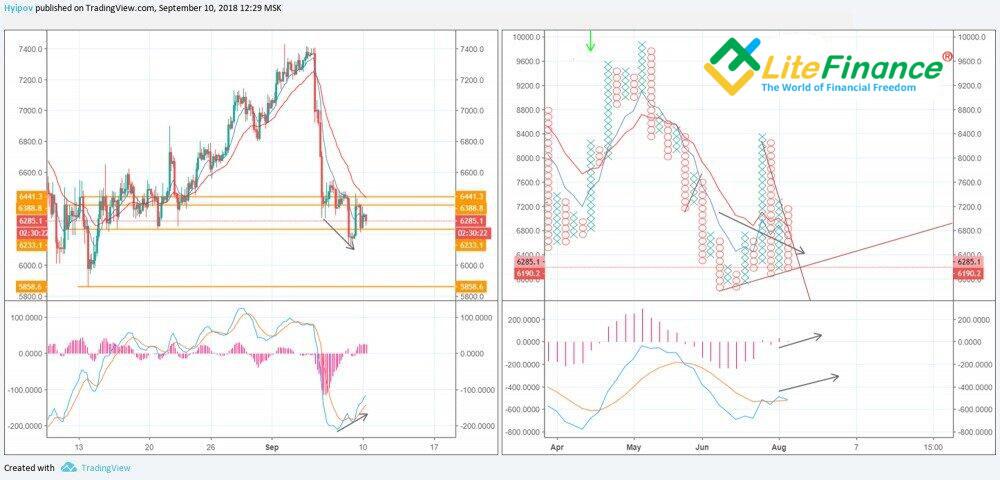
The bullish convergence on the Japanese candlestick chart confirms the assumption.
The price stabilized and showed sideways movement. In addition, the BTCUSD pair moved in a narrow channel on the Tic-Tac-Toe chart, with four X's of $108 appearing during such price movement.
Therefore, an equilateral triangle was formed on the chart on the right. Furthermore, more X's may emerge, indicating the possibility of reaching $7,000.
The analysis has confirmed that this chart is the optimal choice for overall market analysis. Its distinctive features enable the comprehensive visualization of quote movement in a concise and insightful manner. The chart facilitates the identification of global chart patterns as well as support and resistance levels.
In addition, the Tic-Tac-Toe chart assists in determining the duration of the prevailing trend, with multiple methodologies available for this purpose.
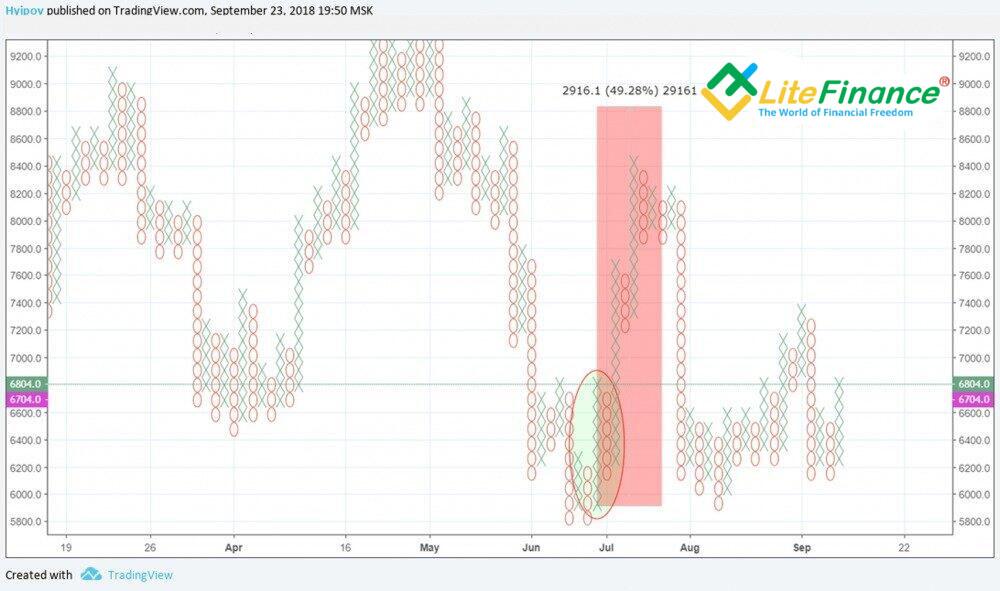
Count the number of columns in the previous trend before the reversal
Let’s count the number of columns that determined the length of the previous wave to determine the trend. The resulting value will be equal to the minimum number of X's or O's in the current trend column.

The chart displays that the downtrend consists of nine columns. Therefore, the ascending wave should include at least nine X's.
Count in horizontal direction
Let's take the base of consolidation in the widest place and count the number of characters. When calculating targets in bullish and bearish trends, we multiply the number by 3 and 2 respectively.
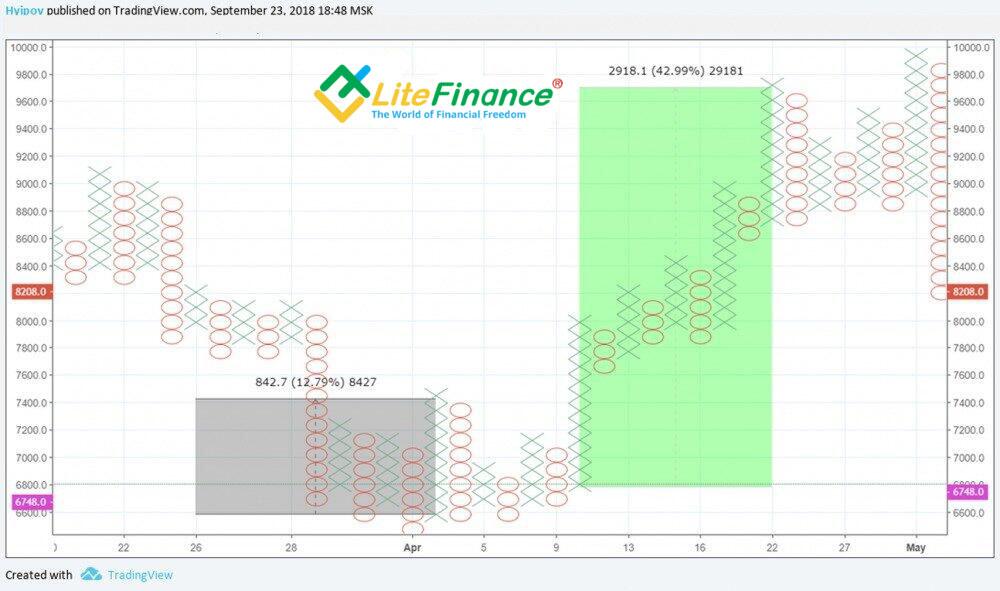
On the chart, the widest column consists of nine X's. To calculate the target for the future bullish trend, we should multiply this number by 3. We get 27 X's. Each X has a step of $108, i.e. the length of the trend is:
9 x 3 x 108 = $2916
The target was set accurately.
Count in vertical direction
This counting is similar to horizontal. In this case, we take the first reversal column, which is the basis of the trend.
In the screenshot above, a column with nine crosses was at the base of the bullish trend. This means that the calculated target should also be $2,916 above the trend base. The price almost hit this target.
As for the bearish trend, the calculation is the same, but the number of O's should be multiplied by 2.
Breakout of the 8/1 Gann Fan
Another original method for identifying the conclusion of a trend is the Gann Fan. To perform this analysis, the initial point of the fan should be placed at the final X or O of an uptrend or a downtrend respectively. The last point for the formation of the fan is the last value of the reversal column. As a result, the fan will be formed with the extreme line 8/1 being the trend line, which, when crossed, will point to a trend reversal.
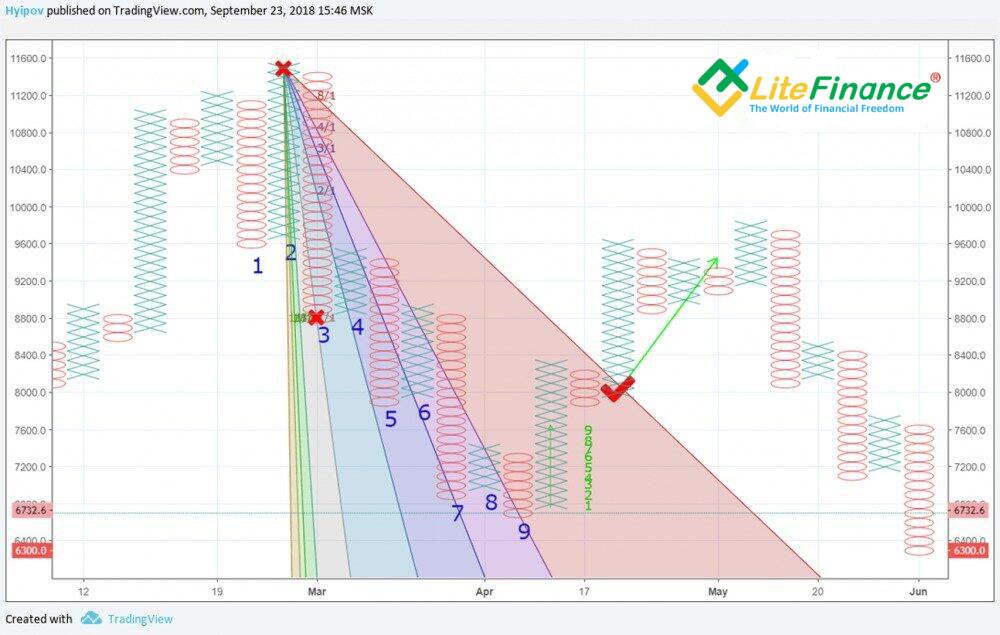
On the chart above, red X's indicate the control points, which are used to build the Gann Fan. The first point is the topmost X of the last rising column in a bullish trend. The second control point is the last O of the first falling column in a bearish trend.
The exit from the fan zone with the crossing of the 8/1 line shows a downtrend reversal.
The length of the bullish trend is assessed in a similar way.
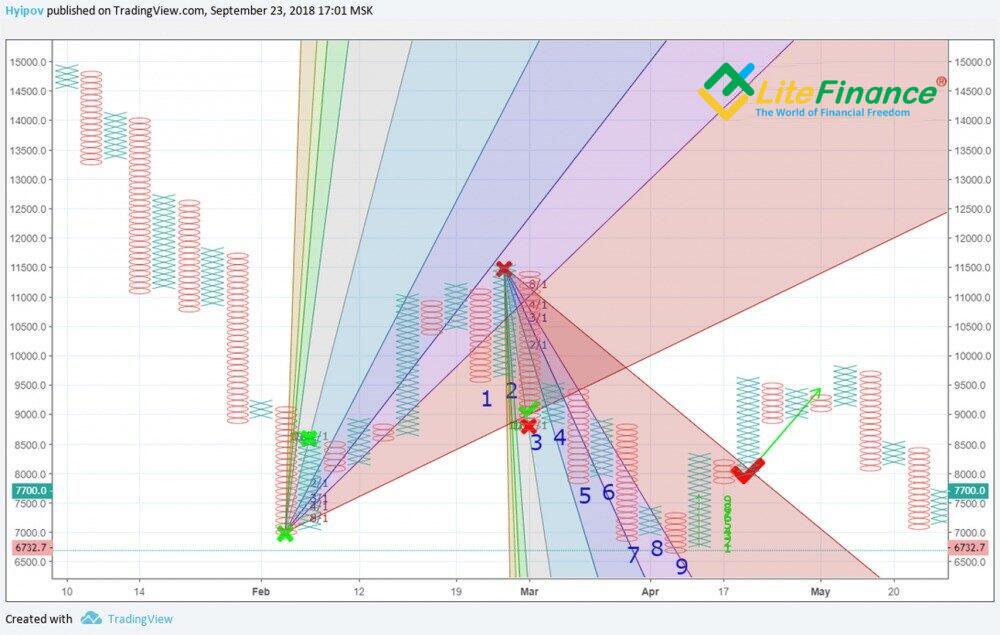
The exit from the previous ascending wave 100% falls under our rule of breaking the 8/1 Gann level. It is marked with a green checkmark.
Green crosses show the extreme points of the two transitional trends, according to which the Gann fan was built.
Notably, there are no false breakouts. If there is a level breakout, we should build a new fan, which will start from the reversal point of the very impulse that broke through the fan.
Thus, if we build a fan on each reversal impulse, we will get the following:
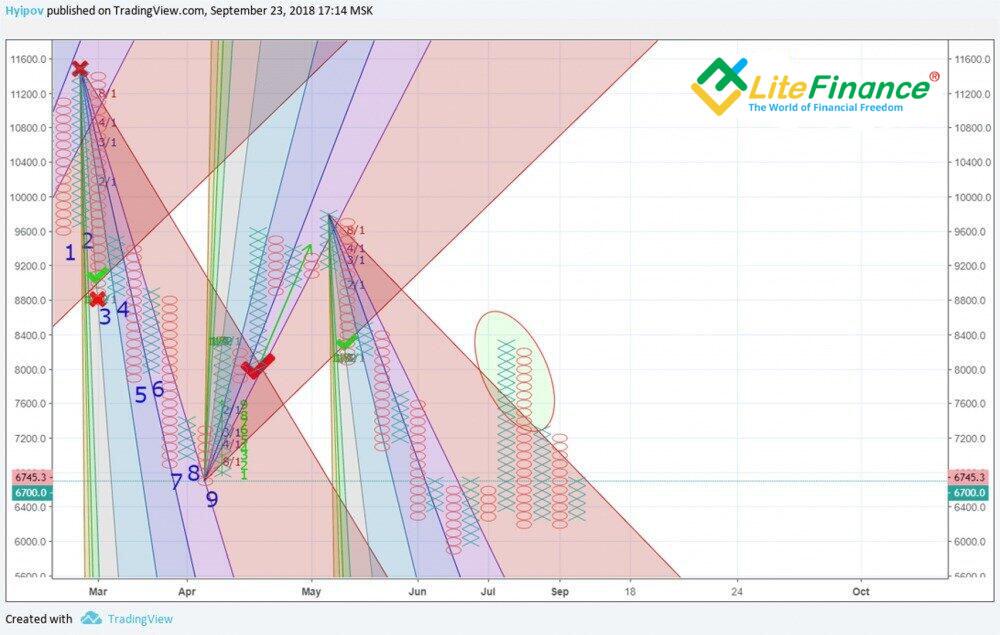
On the chart above, the last impulse growth broke through the fan. This point is marked with a green oval. This is a signal of a trend change. However, the movement was so short that the price returned to a bearish wave.
Nevertheless, a new fan should be built.
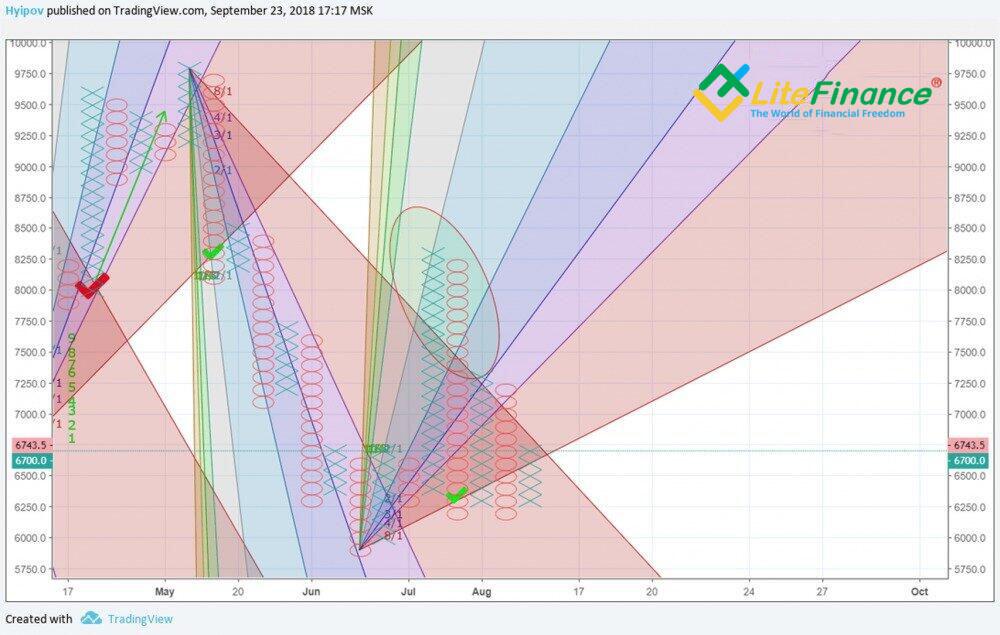
The first impulse wave breached the fan from above. This means that the trend has reversed again, and we need to build a new fan.
Thus, the last fan is still valid at the moment:
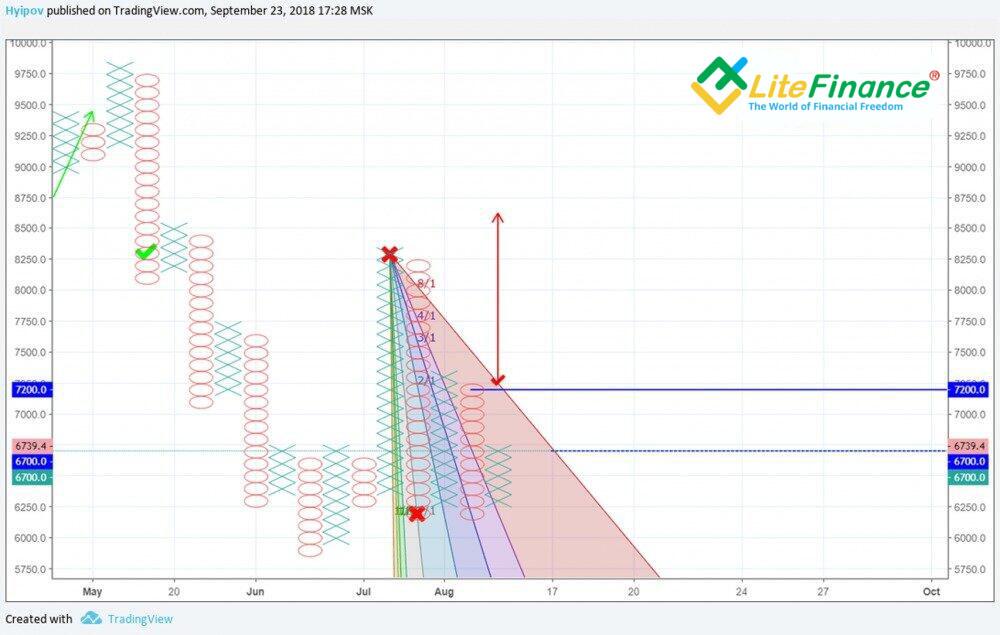
As illustrated on the chart, a bearish trend will reverse if the price rises above $7,200. If the price fails to do so and returns to the support levels, the next growth phase will start once the price exceeds $6,700.
Please note that this method has been developed and tested exclusively on the BTCUSD pair. The results may vary when applied to other assets.
Conclusion
The Tic-Tac-Toe chart is an excellent tool for determining key support and resistance levels. This chart allows you to identify chart patterns that signal further price movement.
The main and, perhaps, the only drawback of this chart is the strong delay in the signals. Therefore, this chart is better used together with the Japanese candlestick chart and technical indicators.
The Tic-Tac-Toe chart is best applied to a trend strategy. With the help of this chart, you can identify reversal signals and reduce the number of false signals.
Tic-Tac-Toe chart FAQ
The Tic-Tac-Toe chart is a type of price chart used to identify trends and reduce market noise. The chart is drawn in the form of X's (when rising) and O's (when falling) as soon as the price passes a certain number of pips.
The Tic-Tac-Toe chart is usually used on higher time frames from H4 and above, allowing traders to identify major trends and reduce the number of false signals.
Experienced traders use the MACD indicator with the Tic-Tac-Toe chart. With its help, you can identify the asset's overbought/oversold condition. Thus, a trend reversal can be predicted much earlier.
The Tic-Tac-Toe chart is excellent in trend strategies, in combination with classic Japanese candlesticks and technical indicators. Chart analysis is also used when trading with Tic-Tac-Toe, as different patterns on the price chart can suggest further price movement.
Once the price surpasses a preset number of pips, as indicated in the chart settings, an X or an O appears on the chart, reflecting the prevailing trend. The chart is not constrained by time scales. In the absence of a clear market trend, X's and O's are not generated. In addition, the chart displays historical support and resistance levels. By interpreting X's and O's, traders can assess market prospects and generate profits.
You can test the chart on a demo account available on LiteFinance's web platform. Various technical indicators are available in the LiteFinance web platform, which can be applied to different markets.
By default, the MetaTrader 4 trading platform does not offer the Tic-Tac-Toe chart, but it can be downloaded additionally.
The content of this article reflects the author’s opinion and does not necessarily reflect the official position of LiteFinance broker. The material published on this page is provided for informational purposes only and should not be considered as the provision of investment advice for the purposes of Directive 2014/65/EU.
According to copyright law, this article is considered intellectual property, which includes a prohibition on copying and distributing it without consent.