One of the major investors’ instruments, CBOE Volatility Index (VIX) helps them analyze price fluctuations, gauge market sentiment, and predict the cost of stocks, options prices, and other tradable assets. It is widely popular among active traders, large institutional investors, and hedge funds. If you haven’t used it before, this guide will explain the basics of the VIX market level, how to calculate it, and make well-considered investment decisions.
The article covers the following subjects:
Major Takeaways
Main Thesis | Insights and Key Points |
|---|---|
Definition | The VIX index is a representation of the CBOE Volatility Index's definition and purpose. |
How it Works | The VIX index showcases how the CBOE Volatility Index operates in the financial market. |
How Does the VIX Measure Market Volatility | Through the VIX index, one can understand the CBOE's method of gauging market volatility. |
How to calculate | Calculating the VIX index involves understanding the specific formula of the CBOE Volatility Index. |
How to Invest | Investing strategies involving the VIX index are based on the principles of the CBOE Volatility Index |
How to trade | The VIX index provides insights into effective trading strategies with the CBOE Volatility Index. |
What Is the VIX (CBOE Volatility Index)?
For various markets, their own volatility measures were created: the VIX index — for the stock S&P 500, VXD — for the Dow Jones Industrial Average (one of the most popular indexes based on weighted prices), VXN — for the American technological Nasdaq Composite.
The Chicago Board Options Exchange (CBOE), owned by Cboe Global Markets company, began calculating VIX in the mid-’90s. The values of the index show how the market’s expectations for a wide range of instruments are changing for the next thirty-day period. For the calculation, prices reflecting supply and demand for options on the S&P 500 index are taken — that allows getting an unbiased picture.
The VIX index shows investor sentiment through volatility. We can conclude either about calmness or about the beginning of panic in connection with the future price dynamics in the stock market.
The VIX is also called the "fear index": the higher it is, the stronger the panic (and volatility, respectively) in the stock market. At this time, investors prefer to dump risky assets and transfer their money into protective instruments.
How is the CBOE Volatility Index formed?
The index value keeps in the range of 0-100. In fact, this is an indicator of the stock market volatility, which is calculated based on the prices of options markets, such as the S&P 500 American index.
How Does the VIX Work?
The VIX is inversely related to the stock market. The equity market volatility index will rise in value when the stock market (primarily the S&P index) falls. When VIX index values rise above 40-45, it indicates high volatility and leads to a growing level of market stress, thus investors are fleeing risk. If the value is near 17 or below, this is an indicator of calm trading, low market volatility, and thus low risk. However, if the VIX falls too low, it is dangerous as everyone expects the upside to continue. At such moments, active traders should be double-careful.
How Does the VIX Measure Market Volatility?
The level of less than 20 points shows the optimistic mood of market participants. However, despite the optimism and calmness, this often signifies price swings or trend reversal, which means they need to close positions with risky instruments. 20-30 is an average level of implied volatility (known as expected volatility) that does not indicate any significant changes.
If the level reaches 40 points or more, market participants are panicking. During this period, the world usually witnesses a collapse in the prices of stocks, currencies of developing countries, and physical assets. At the same time, such falls are considered the best time to buy risky assets. After all, when the situation gets corrected, their value will begin to rise. So, the analysis of the CBOE Volatility Index helps the investor understand how the market trend is developing and when to fix their positions, as well as determine the most appropriate entry and exit points for their deals.
Historical volatility shows the asset’s price changes over a particular timeline. By measuring implied volatility (aka future volatility or expected volatility), a trader can predict the upcoming price range. Note that VIX also helps traders measure the future changes of VIX-linked instruments and indicators, such as SPX.
How to calculate VIX
The Volatility Index value is a generalized assumption based on the market price of premiums that investors are willing to pay for the right to buy or sell options contracts on the S&P 500 Index. Thus, the VIX is the weighted average of all option prices in the S&P 500 Index.
The VIX values are measured as a percentage and are approximated to the movement that is expected in the S&P 500 Index over the next 30 calendar days, after which it is recalculated for a year. So, if the value of VIX is 15, this is 15% of the expected annual change.
The full formula for VIX index calculation looks pretty complicated:
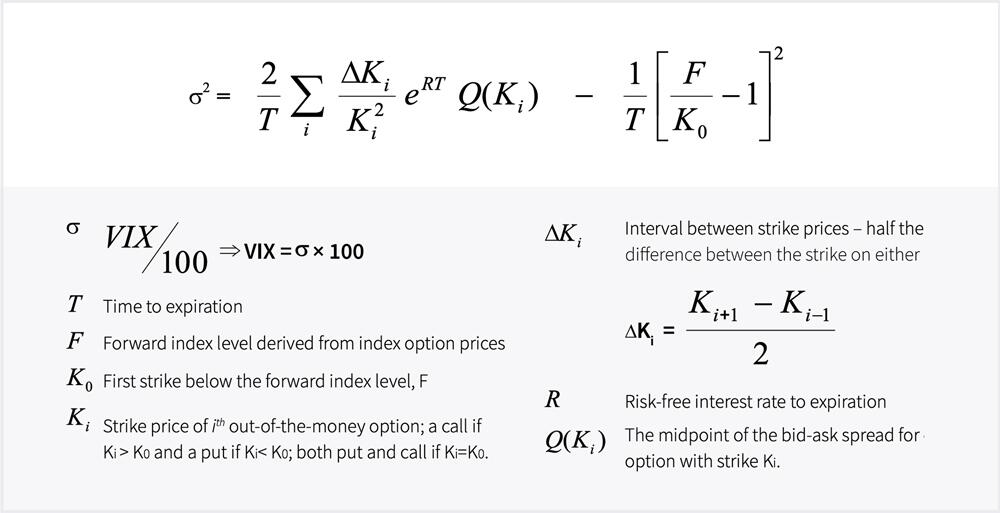
VIX is calculated as the square root of the value of the swap rate fluctuation for 30 days starting today. Note that the VIX is the volatility of the swap change, not the volatility of the swap. Swap change can be fully statically duplicated through simple put and call, while swap volatility trading requires dynamic hedging. VIX is the square root of the risk-neutral expectation of fluctuations in the S&P 500 stock market index over the next 30 calendar days. The VIX is quoted at the annualized standard deviation.
For the calculation, SPX options with a maturity of 23-27 days are used. The VIX volatility value is multiplied by 100. For example, if the VIX is 20, this implies 20% future volatility.
The VIX options have replaced the older VXO as the preferred market volatility index used by the media. VXO was a measure of implied volatility calculated using 30-day options on the S&P 100 Index.
How to Invest in the CBOE Volatility Index?

This is a sector-specific index: traders are using VIX with SPX options and futures — each comes with different risks:
Barclays Bank PLC iPath S&P 500 VIX Short-Term Futures ETN (VXX) is the most common option. This is an IOU from Barclays, which mirrors the two closest expiration VIX futures. A significant drawback of the VXX is that its dynamics with the approaching expiration and strike prices may not coincide with the dynamics of the VIX index. This is due to this contango effect when the nearest futures are cheaper than the distant ones. Therefore, this instrument is not suitable for a long-term position. However, there is also a positive point: the VXX stocks correlate negatively with the S&P 500, which may become a chance to capitalize on the increased volatility in the event of a market crash.
ProShares Ultra VIX Short-Term Futures ETF (UVXY) is a paper with a hard-wired 2:1 leverage effect. This is the best option in terms of liquidity and short-term tracking. If the underlying asset index rises 1%, UVXY adds 2% and vice versa. However, the stock reflects the dynamics of the VIX inaccurately (due to contango), which is also risky.
Futures on VIX repeat the dynamics of the VIX index as closely as possible and have a leverage effect. However, they are not very convenient due to expiration: you have to shift your hands or additionally buy calendar spreads on them. Operations with SPX options are more complicated and require careful research. Lack of experience, poor trading strategies, and risk management plans can lead to losing money rapidly from retail investor accounts.
Alternatively, you can trade the VIX with such derivatives as:
VIX exchange-traded products, such as options;
Short-term VIX futures S&P 500 ETN (NYSE: VXX) and temporary VIX futures S&P 500 ETN (NYSE: VXZ);
VIX S&P 500 ETF (LSE: VIXS) launched by Source UK Services in June 2010;
Short-term VIX futures ETF (NYSE: VIXY) and temporary VIX futures contracts ETF (NYSE: VIXM) launched by ProShares in January 2011.
How to trade VIX?

Based on the values of the market volatility index, trading strategists have derived a few rules for trading stock assets:
The growth of the VIX indicates a panic in the market. Investors are dumping stocks, you need to prepare to buy good assets in the near term.
When the VIX market index consolidates above 40-45% values, you can open buy deals with the aim of long-term growth.
A decline in the VIX is a sign of investors’ calm mood. They prefer to buy up shares, pushing their market price upward, towards overbought. It is necessary to look closely at sales, as well as fix profits on long positions.
Long-term short positions can be opened after the VIX index consolidates below 20.
The VIX Examples
To start with, let’s review the example of the CBOE Volatility Index indicating panic on the stock market.
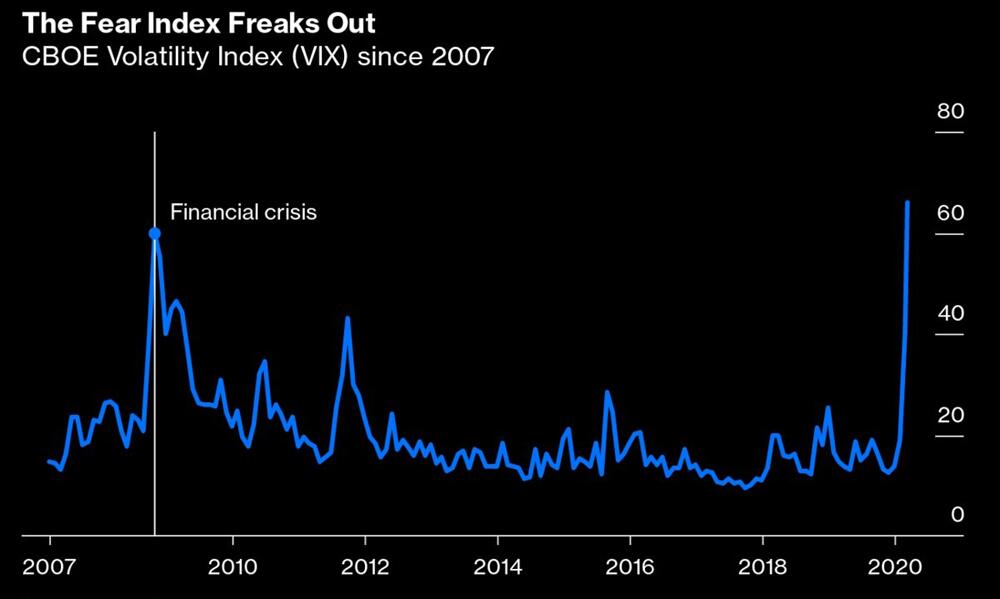
The Chicago Board Options Exchange introduced the index in 1993. The maximum value of the index at 89.53 was recorded on October 24, 2008 during the recession. Minimum (8.56) — November 24, 2017. Most of the time, the index value kept in the range between 15 to 40. If the VIX is below 20 or 15, investors’ concerns are minimal.
VIX values below 20 mean that the markets are steadily growing, and the very decline of the VIX to this level can be perceived as a good opportunity for quiet buying. If the VIX value is above 70–80, this indicates a high level of fear of investors who are trying to insure themselves as much as possible from price fluctuations and recessions. The index, however, should not be used as an unambiguous signal to buy or sell. It’s important to confirm its signals with other technical tools, especially leading indicators. In contrast to lagging ones, which are based on historical data, they help investors predict more effectively the direction of the market trend, its durations, level of volatility, and more. Another example will explain why.
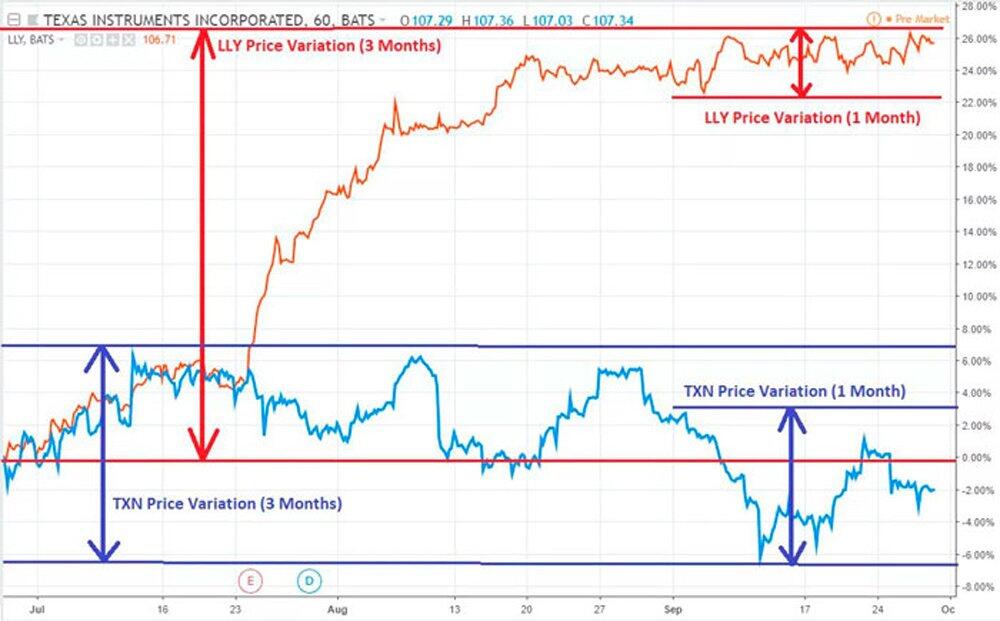
For financial instruments such as stocks, volatility is a statistical measure of the degree to which their trading price has changed over some time. On September 27, 2018, Texas Instruments Inc. (TXN) and Eli Lilly & Co. (LLY) closed near similar price levels of $107.29 and $106.89 per share, respectively. However, an analysis of their price movements over the last month (September) shows that TXN price fluctuations (blue graph) were much wider compared to LLY price fluctuations (orange graph). TXN had higher expected volatility compared to LLY for one month.
When observing the 3 months (from July to September) of price changes, we can see a reversal of the trend: LLY had a much wider range of price fluctuations compared to TXN, which is completely different from the near-term observation made in one month. LLY had higher volatility than TXN over the three-month period.
Conclusion
The VIX index is a must-have in traders’ arsenal of instruments. It helps investors see asset price performance and identify its current trend. What’s more, VIX correlates with other indicators and can help analysts predict the direction of their movement (which can be the opposite of VIX). Although the process of calculation is complicated, you don’t have to do it manually — the majority of trading terminals support this instrument and indicate volatility index.
CBOE volatility index FAQ
The VIX short-term volatility index is widely considered to be the world's premier barometer of equity market risk and is often referred to as the "investor fear gauge." Its methodology was created in 1993 and has been licensed to numerous exchanges and financial institutions around the world. The VIX is calculated using a portfolio of S&P 500 Index options with at least 23 days and no more than 37 days to average expiration. This time range is designed to produce an index value that reflects investors' consensus view of near-term expected volatility.
The volatility index (VIX) shows average stock price volatility over a particular period. For calculation, it uses opening and closing market prices. When the market is calm, VIX keeps below 15-20. When traders are panicking, VIX can overcome the level of 80.
The volatility index estimates the range of price changes over a particular timeline. It helps traders analyze the asset’s performance, set expected market volatility, and predict future price rates.
There’s no need to calculate anything. Do the following:
- Open LiteFinance or another trading terminal of your choice.
- Choose the underlying asset to analyze and open the price chart.
- Activate the VIX index on your personalized chart.
- Analyze the volatility index. Trading is less risky when VIX measures are somewhere between 20 and 60. When it’s above 60-70, the price is characterized by high trade volatility, so you should think of saving assets rather than trading them.
Use it for predicting the future price fluctuations of options and futures. Also, some other indicators can move in the same or opposite direction as CBOE, so it’s a great forward-looking instrument.
A high VIX (over 60-70) indicates high expected future volatility, so traders should be more careful. When VIX is above the standard deviation, risks are exponentially higher, so investors should rather think about how to save their capital instead of opening new positions. Low VIX, conversely, implies a low volatility level, thus lower risks.
It depends on the asset traded, but the range of 20-60 is considered to be optimal.
When the S&P 500 index falls, the VIX rises. And in calm times, with a high interest in risky assets (shares), the "fear index", naturally, decreases. Any stock market volatility is good unless it goes to extremes — below 20 or above 80.
Vix options use the Cboe Volatility Index as an asset. The VIX is a key measure of market expectations of near-term volatility conveyed by S&P 500 stock index option prices. Created in 1993, the VIX Index was the first benchmark index designed to measure market expectations of future volatility and remains the most widely followed measure of market risk today. While the VIX Index is primarily used as a gauge of U.S. equity market risk, it has also been used to develop a variety of VIX linked instruments including exchange traded products, futures, and options.

The content of this article reflects the author’s opinion and does not necessarily reflect the official position of LiteFinance broker. The material published on this page is provided for informational purposes only and should not be considered as the provision of investment advice for the purposes of Directive 2014/65/EU.
According to copyright law, this article is considered intellectual property, which includes a prohibition on copying and distributing it without consent.