Technical analysis is key for forex traders seeking an edge in the fast-paced forex market. Multiple timeframe analysis allows traders to monitor a currency pair's price action across different times - from the short-term 15-minute chart to the long-term daily - gaining a comprehensive overview.
Using multiple timeframes, traders can identify support, resistance, trends, and candlestick patterns, guiding decisions on optimal entries and exits. This top-down approach helps day traders, swing traders and longer-term traders alike, allowing them to base trading strategies on both the short-term 15-minute outlook and the broader daily context. In an unpredictable market, multiple timeframe analysis provides an invaluable perspective for forex traders.
The article covers the following subjects:
Major Takeaways
- Multiple timeframe analysis involves examining a currency pair's price action across different time perspectives, from short-term 15-minute charts to long-term daily charts.
- Analyzing multiple charts gives traders a multidimensional perspective – higher timeframes provide context while shorter timeframes enable precise entries and exits.
- Multiple timeframe analysis helps traders select optimal market conditions to improve the accuracy and profitability of trading strategies.
- Timeframes traded include 1-minute, 5-minute, 15-minute, hourly, 4-hour, daily, weekly, and monthly charts. Traders select timeframes based on their trading style.
- Higher timeframes like 4-hour and daily charts reveal the prevailing trend, key support/resistance levels, and chart patterns. Lower timeframes provide exact entry and exit points.
- Strategies include using indicators on higher timeframes to define bias, then candlestick signals on lower timeframes to time entries. Also trading breakouts, bounces from key levels, and chart pattern breakouts across timeframes.
- Backtesting quantified multi-timeframe strategies evaluates historical performance to prove a strategy's edge across market conditions.
What Is Multiple Timeframe Analysis?
Multiple timeframe analysis is a vital process for forex traders that allows them to assess market conditions and trends across different time perspectives. The approach typically starts by examining higher timeframes like the daily or four-hour chart to gauge the prevailing longer-term trend as well as identify key support and resistance levels.
This top-down analysis provides insight into the overall market direction, highlighting whether the market is in an uptrend, downtrend or flat. Traders can then drill down to shorter timeframes like the one-hour or 15-minute charts to reveal the short-term trend and trading signals. Analyzing multiple charts gives traders an invaluable multi-dimensional perspective – the higher timeframes allow them to contextualize short-term price movements and determine high-probability entry points and profit targets, while the shorter timeframes provide precise timing for entries and exits.
By considering both longer-term and intraday charts, forex traders can make fully-informed trading decisions regarding position size, risk management and targeting optimal profits. The power of multiple timeframe analysis lies in its capacity to help traders select prime market conditions across different perspectives, dramatically improving the accuracy and profitability of trading strategies. It is an indispensable part of thorough market analysis for all types of short-term forex traders.
Timeframes in Trading
In technical analysis, a timeframe refers to the time interval or periodicity used to segment market activity into discrete portions, which is then visualized in a series of price bars on a chart. Multiple time frames analysis requires examining price action across different standard timeframes, including:
- 1-minute bars;
- 5-minute bars;
- 15-minute bars;
- 30-minute bars;
- 1-hour bars;
- 4-hour bars;
- 1-day bars;
- 1-week bars;
- 1-month bars.
These standard multiple time frames provide traders with a choice of granularities to inspect price action – from assessing rapid price fluctuations using 1-minute bars to zooming out to daily or weekly bars to gauge the prevailing market trend. Traders utilize multiple time frames in their analysis to obtain a multi-dimensional perspective of market movements.
The higher time frames provide context and structure for decision-making, while the shorter time frames enable precise entries and exits. Selecting optimal time frames or a combination allows traders to develop strategies with an informational edge over the market.
Selecting Timeframes
Determining optimal timeframes is crucial for traders seeking to maximize the effectiveness of multiple time frame analysis. Ideal timeframes vary depending on trading style and expected price behavior. Scalpers and day traders favor shorter timeframes like 1-5 minute charts to capitalize on minor price fluctuations and volatility.
The precise entries offered by these charts allow rapid moves to be made repeatedly throughout the day. Meanwhile, swing traders are more concerned with the prevailing short-term trend and optimal entry points to capture swings over hours or days. The 15-minute or hourly charts often provide the ideal mix of granularity and context for swing traders to assess trading signals, market conditions and short-term trends.
Those with longer-term outlooks, like position traders, focus predominantly on the higher 4-hour or daily charts, using them to identify the overall market direction, support and resistance levels, and longer-term trends. This top-down approach allows them to contextualize entries and targets within the wider structure.
More systematic traders will quantify the efficacy of varying timeframes through rigorous backtesting, determining which individual or combinations of timeframes generated the greatest returns historically for their strategy. Matching timeframes to trading horizons, behaviors and quantified performance ensures traders select the optimal mix of multiple time frames to maximize profitable trading decisions.
Higher Timeframe Analysis
Higher timeframes spanning hours, days or weeks are indispensable for traders seeking to determine the prevailing market conditions and bias. Examining longer-term charts such as the 4-hour, daily, or weekly provides invaluable insight into the current market trend, key support and resistance levels, recent price extremes and chart patterns.
These higher time frames allow traders to identify the overall trend bias – whether the market is favoring an uptrend, downtrend or flat structure. Indicators like the 50 and 200-day moving averages can reveal the market's directional bias on the higher timeframes. Additionally, higher charts enable traders to pinpoint significant support and resistance levels derived from previous price swings and extremes.
Having an awareness of these longer-term chart levels allows traders to contextualize current price action and project areas where reversals may eventuate. Higher timeframes also expose major chart patterns like head and shoulders tops/bottoms, triangles and flags – classical formations which suggest likely continuations or reversals.
Lower Timeframe Analysis
While higher timeframes provide the technical landscape, lower timeframes ranging from 1-minute up to 1-hour bars enable traders to pinpoint precise entries, exits and profit targets. Lower time frames such as the 15-minute or hourly charts reveal short-term trends, overbought/oversold signals, and chart patterns informing traders as to optimal trade timing and sizing.
These lower periodicities provide exact points at which to execute entries in harmony with the directional bias established on the higher time frame– whether trading bounces from key levels, breakouts from ranges or continuations in the direction of the trend. Lower timeframes also grant traders greater precision in planning profit-taking approaches.
Specific candlestick signals, momentum divergence and chart formations on the lower time allow traders to predefine exit points and set rates of return per trade. By lining up directional strategies, entries and profit targets between the higher overview and lower granularity, traders execute highly-structured trades with maximized risk/reward potential.
Aligning higher and lower timeframes allows traders to create a strategically synergistic multi-timeframe methodology essential for consistent execution and returns.
Get access to a demo account on an easy-to-use Forex platform without registration
The long-term technical landscape revealed through higher time frame analysis provides the foundations for wise multiple time frame trading. By studying these higher periodicities, traders can determine whether market conditions and the prevailing trend support long or short-biased trades. The higher time frames do not dictate precise entries or targets – rather, they paint the structural backdrop which informs strategy and directional bias.
Combining longer-term trend analysis with shorter-term chart signals creates an invaluable, multi-dimensional perspective for maximizing profitable trading decisions across multiple time frames.
Multiple Timeframe Trading Strategies
The power of multiple time frame analysis lies in its versatility – traders can apply a variety of strategies across higher and lower timeframes.
A common approach is using indicators like moving averages or MACD on higher periodicities to define market bias, then employing candlestick signals on lower timeframes to time entries.
Traders may also trade breakouts on the lower timeframes, using the higher charts to identify significant support and resistance levels derived from multi-month or multi-year price swings. When these longer-term chart levels are broken on lower timeframes, it signals a potential shift in market structure and the start of a new trend.
Another strategy is trading bounces from key higher timeframe levels. This involves waiting for a test of major support or resistance levels on the daily or weekly charts, then turning to a lower timeframe such as the hourly chart to execute trades in the direction of the weekly bounce.
Chart pattern and candlestick pattern analysis also thrives via a multiple timeframe approach – classical chart patterns like head and shoulders often form on higher timeframes, then produce exploitable breakouts on lower intraday charts. Additionally, candlestick patterns become more robust when considered in the context of the prevailing multi-day trend.
By synergizing a confluence of technical signals across multiple time horizons, traders execute highly-defined trades structured around longer-term market bias and shorter-term entry triggers. The versatility of multiple time frame analysis empowers traders to customize strategies aligned with personal risk tolerances and return objectives within predominant market conditions.
Levels - Breakout
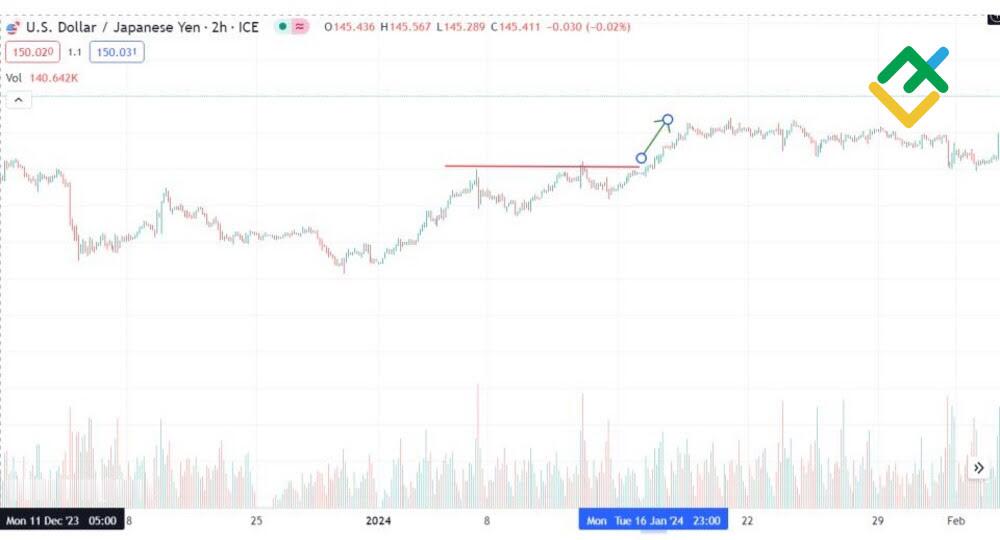
Monitoring key levels identified on higher timeframes, then trading breakouts from those levels on lower intraday charts, can offer timely entries aligned with shifts in market structure. The break of a significant higher timeframe level often propels prices further in the breakout direction as new space is discovered.
Levels - Bounce
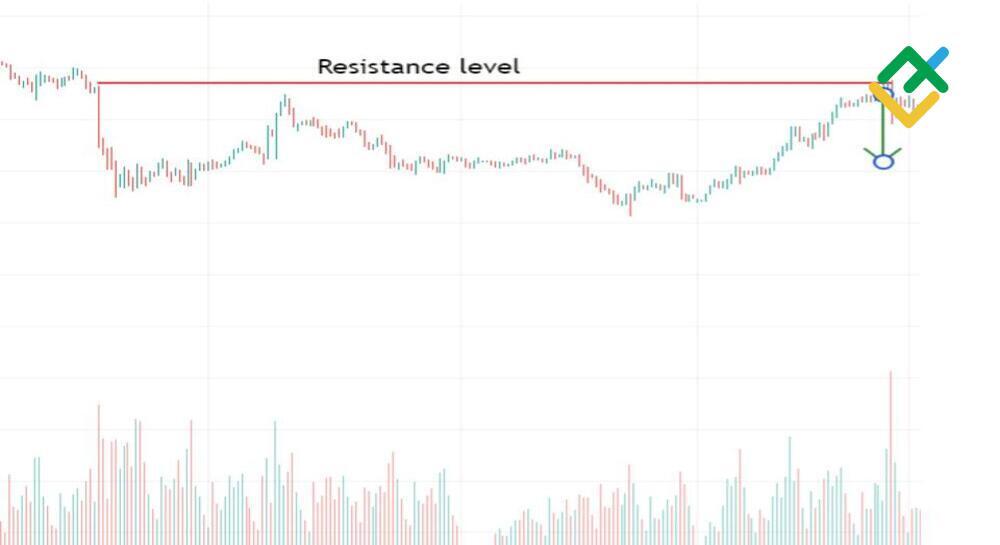
Entries can be timed on bounces from major levels spotted on higher timeframes – after a test of support/resistance; lower timeframe signals may emerge offering low-risk bounce entries with predefined exit levels. This complements higher timeframe levels analysis with lower timeframe execution.
Highs and Lows
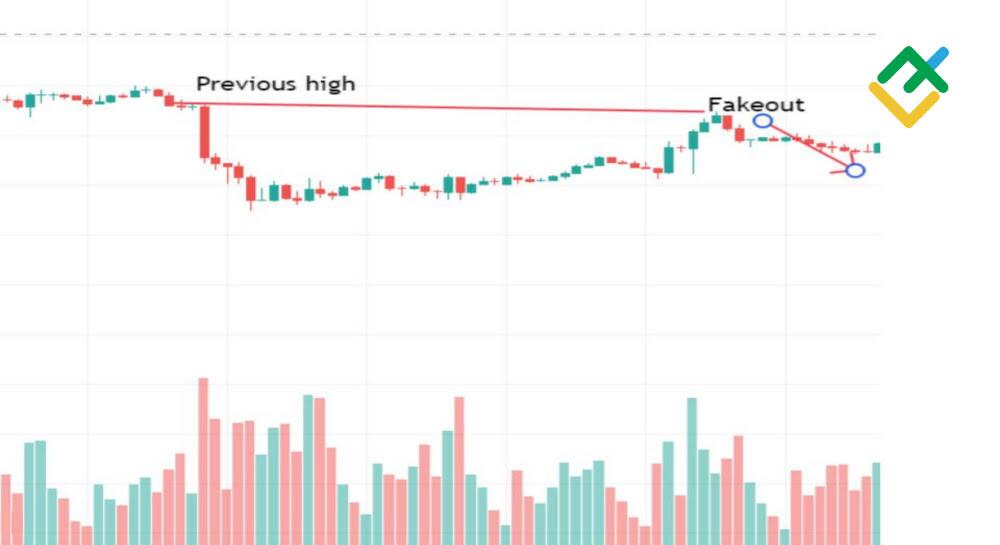
Swing points and price extremes highlighted on higher timeframes provide trade ideas to monitor or limit orders to set on lower charts. Trading in harmony with higher timeframe swing highs and lows efficiently aligns strategies to prevailing market ranges and themes.
Candlesticks
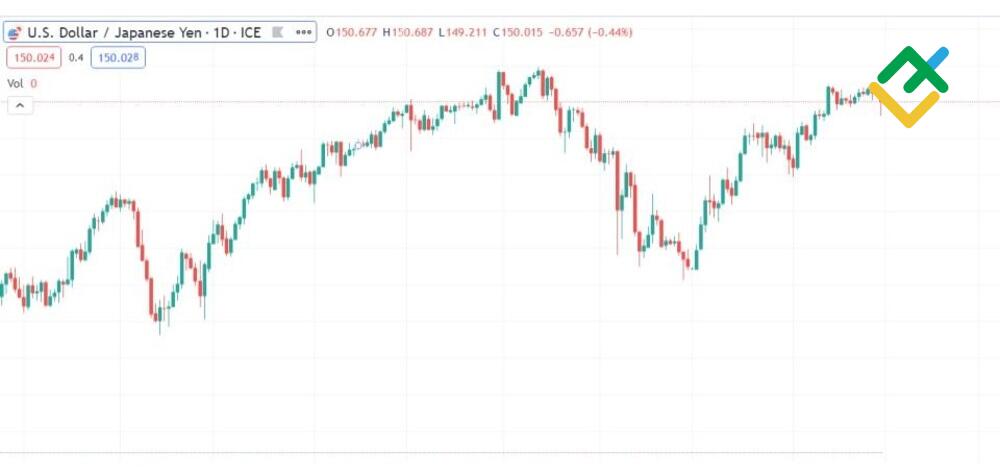
Candlestick signals become more meaningful with higher timeframe context verifying significance – a bullish engulfing candle on the hourly chart as prices lift off a daily support level, for example. Multiple timeframe confluence validates patterns.
Patterns
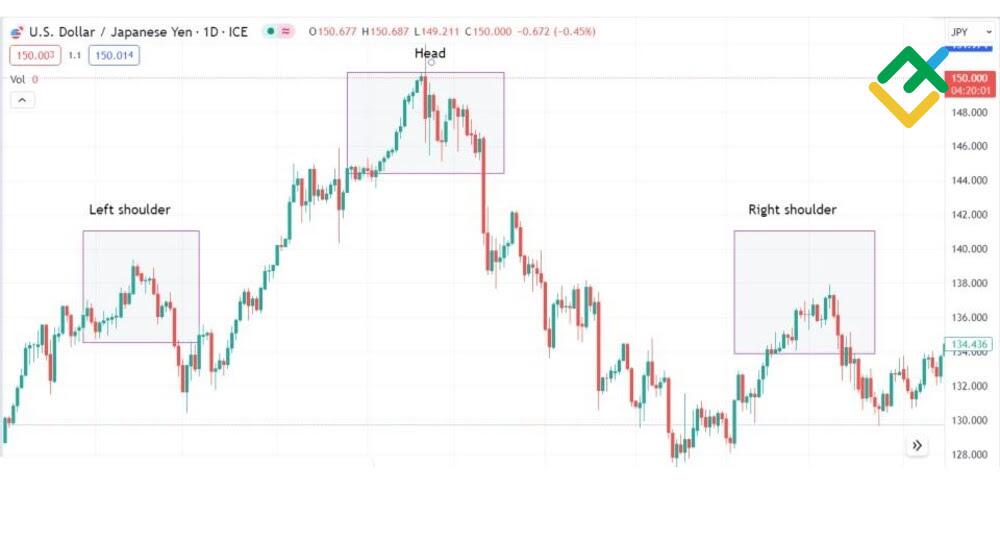
Classical chart patterns like head and shoulders or triangle formations establish on higher timeframes, with lower timeframes offering efficient risk/reward entries once the pattern breaks with projected price targets. Higher context improves pattern potency.
Backtesting Multiple Timeframes
To maximize returns, traders should backtest quantified rules that combine higher and lower timeframe signals rather than reliance on discretionary decision-making. This involves formulating a strategy with conditions such as “go long if the daily chart is above the 200-day moving average and the hourly chart prints a bullish engulfing candle above the 20-period SMA”.
The trader can then backtest this exact set of conditions across years of historical data, evaluating metrics like profit factor, win rate and drawdown to gauge historical performance. The system can then be refined by optimizing elements like indicators, entry rules, profit targets and stop losses to improve returns or lower risk.
This quantified approach proves a strategy’s edge across market conditions over long datasets. An example trade might involve signals aligning across timeframes to buy on a test of the daily trendline support with an hourly hammer candle – stochastic divergence additional verification.
Quantified backtesting enables traders to develop robust rules for entering and managing trades based on a confluence of signals across multiple time horizons.
Summary
For traders seeking to level up their technical prowess, an array of advanced trading strategies, indicators and analytical techniques await. Moving beyond rudimentary chart analysis, aspiring experts have a wealth of sophisticated tools to explore. Candlestick patterns like Three Line Strike and Two Crows provide nuanced insight into shifting momentum.
Indicators like Ichimoku clouds and the Alzheimer Oscillator identify dynamic support/resistance and volatility trends. Triangle, flag and wedge patterns highlight reliable trade setups. And keystone methodologies like Elliott Wave theory and Wyckoff analysis offer multidimensional approaches to market forecasting.
An extensive compilation of these advanced techniques, indicators, patterns and analysis methodologies is recommended for traders looking to step up their capabilities in assessing multiple timeframes and executing winning trades. By diving into these concepts, skilled practitioners can gain an enhanced understanding of market movements across time perspectives.
Platform where traders earn more

Trade on LiteFinance’s high-tech ECN platform and open an account so that beginner traders can copy you. Earn a commission for copy trading and boost your income.
Multiple Timeframe Analysis FAQs
Multiple timeframe analysis is the process of assessing market conditions and price trends across different time perspectives, from short-term 15-minute charts to long-term daily charts.
Multi time frame Open Interest (OI) analysis involves examining OI data across different time periods to assess market sentiment and potential price movements, helping traders make informed decisions.
The ratio for multi time frame analysis isn't fixed; it varies based on individual strategy and market. Traders often compare short, medium, and long-term time frames, like 15-minute, 1-hour, and daily charts, to identify trends and confirm trade signals.
Multiple timeframe analysis simply involves looking at market activity and price charts across different standard time intervals, from 1-minute bars to monthly bars, to gain valuable insights.
The content of this article reflects the author’s opinion and does not necessarily reflect the official position of LiteFinance broker. The material published on this page is provided for informational purposes only and should not be considered as the provision of investment advice for the purposes of Directive 2014/65/EU.
According to copyright law, this article is considered intellectual property, which includes a prohibition on copying and distributing it without consent.