Searching for big players and market traps by use of the volume-spread analysis
Every trader has his/her own way. It isn’t necessary to ponder over why price fluctuations take place. Instead, one can catch signals of their trading systems and finally end up buying or creating trading robots. The latter are deprived of emotions and press the buttons faster than humans. However, if every bank, hedge fund or any other huge player used only automated trading, such profession as an assets manager wouldn’t exist. But these people are still here, quite well off, and try to understand the market deeper. Doesn’t sound easy? It’s extremely hard, in fact. But the game is worth the candle!
To understand the system, one has to take it to pieces. In this respect, the use of indicators is a way to nowhere. Average indicators move us away from solving the main puzzle of understanding the nature of fluctuations. On the contrary, bar analysis seems to be the right choice. I used to use solely prices in my blog. Now I’m going to add the idea of volume. The volume reflects the interest of investors in a given instrument. It can be normal (medium), low, high, and very high. In VSA, the range from maximum to minimum is called “spread”. Based on the location of the price, up-bars and down-bars are singled out. Also, it’s important to know, in which part of the spread a trading day closes.
Main concepts of VSA
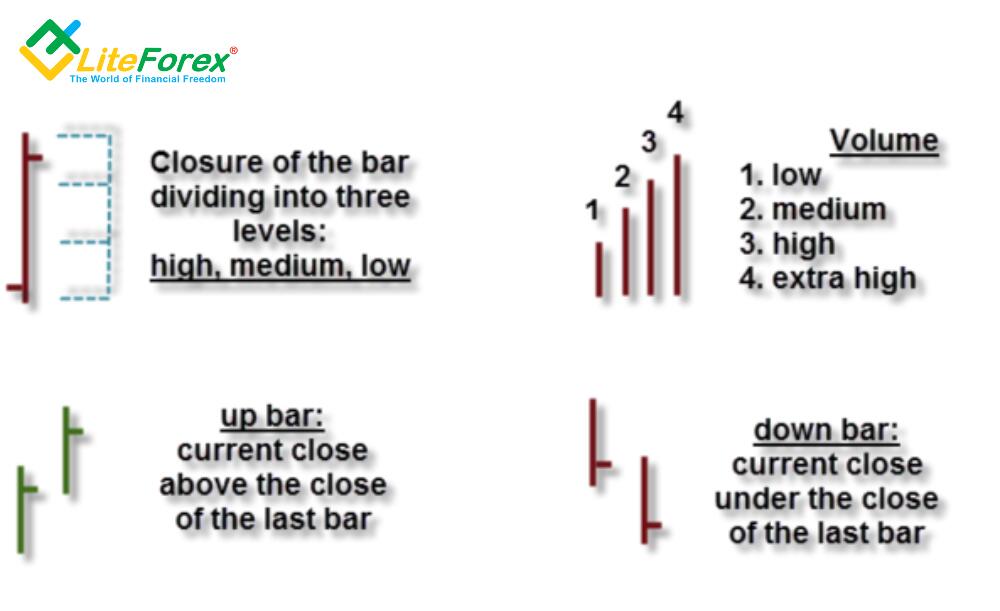
The simplest way of using VSA is searching for anomalies. Medium market volumes look natural. But as soon as there’s a low or extremely high interest of investors in an instrument, it’s time to think why. An impressive volume under the conditions of a trend market allows us to find a trace of a big trader that follows the following principle: “when all buy, it’s time to sell”. A low volume points to a trap. The demand for an instrument is weak, so someone must be checking for the presence of serious rivals. If there aren’t any, the price is most likely to move in a direction opposite to a current closure.
Volume analysis in the daily USD/CAD chart
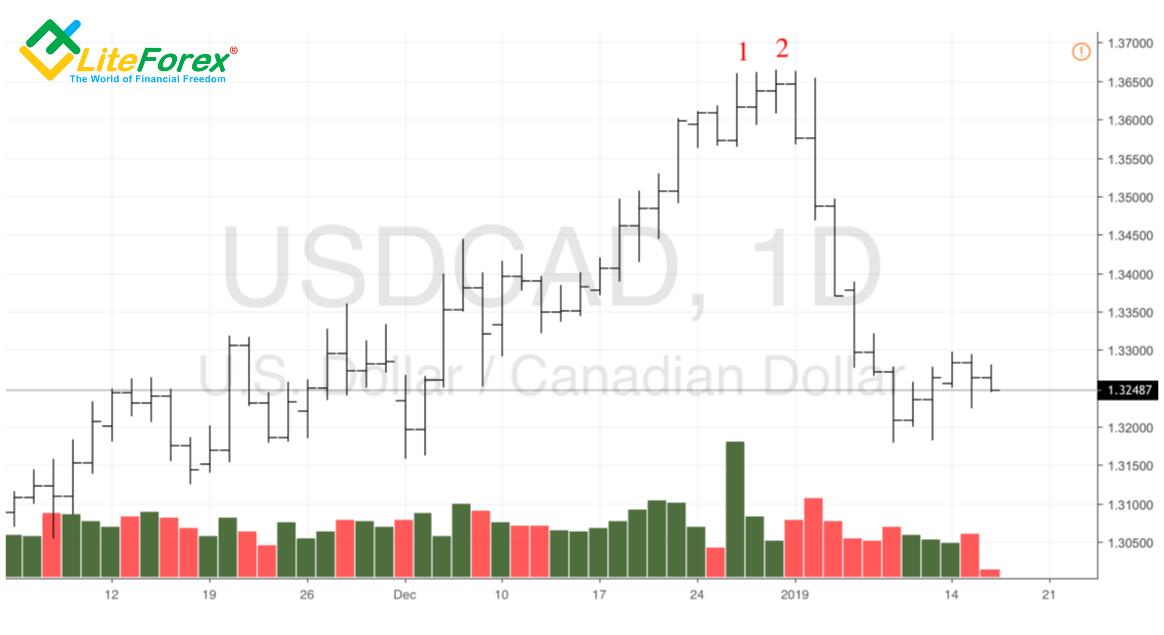
An extremely high volume appeared in the bar №1 in the daily USD/CAD chart in a clear bullish trend. It’s an up-bar closed near the middle of the trading range. We may have detected a huge seller who’s going to test the opponents. The low volume in the bar №2 closed upwards points to a bullish trap. It’s a favourable situation for a reversal and our main goal is to get into the same boat with the big bear.
Strategy of work using VSA in the USD/CAD chart
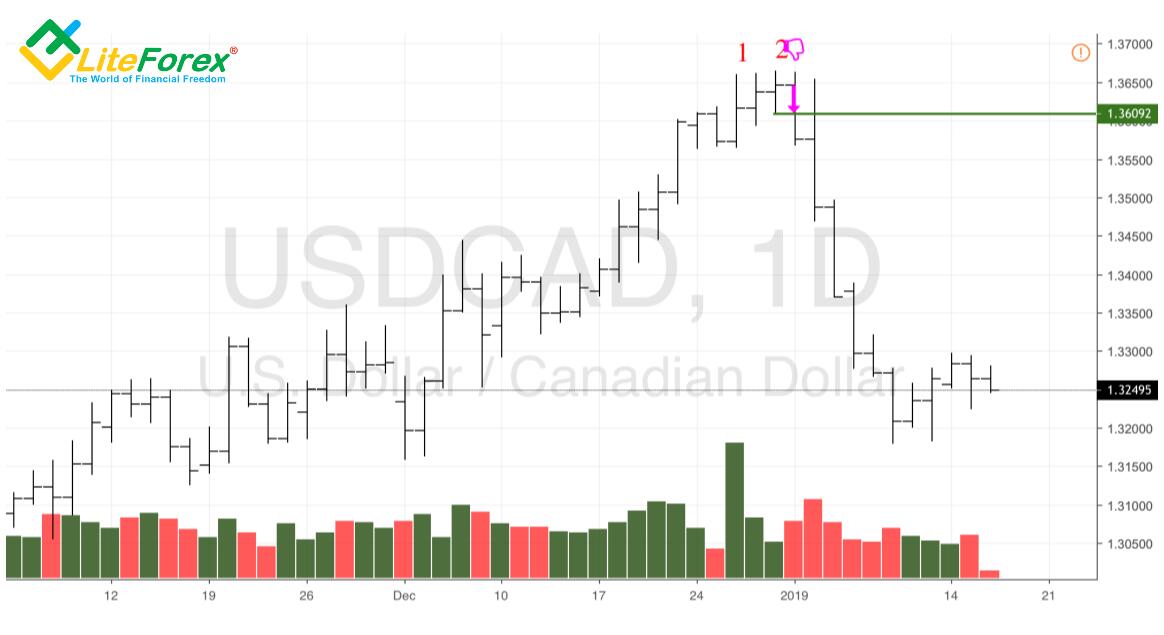
A pending order to sell shall be placed at the low of the bar-trap №2. Next, place a protective stop-order at the top of the latest price fluctuation. If and when USD/CAD quotes fall, the order shall be moved down, which will help implement the principle “keep losses low, let profits grow”.
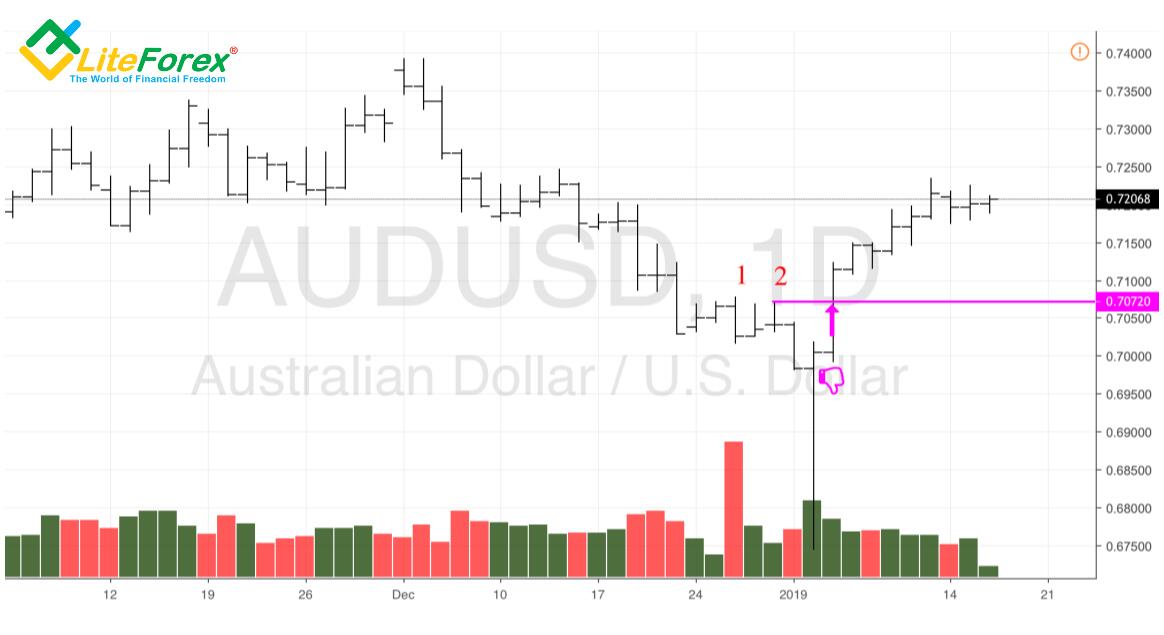
The same applies to the daily AUD/USD chart in a downtrend. A big buyer was detected in the bar №1 because of its big volume. The bar №2 is marked with a low interest in sales, which signals a bearish trap. The return of quotes to its maximum is a reason for forming long positions.
Strategy of work using VSA in the AUD/USD chart
VSA is really versatile. It includes a wide range of applicable tools which help a trader better understand the nature of price fluctuations. We will continue this talk in other articles.
P.S. Did you like my article? Share it in social networks: it will be the best "thank you" :)
Useful links:
- I recommend trying to trade with a reliable broker here. The system allows you to trade by yourself or copy successful traders from all across the globe.
- Use my promo code BLOG to get a 50% deposit bonus on the LiteFinance platform. Simply enter this code in the appropriate field when funding your trading account.
- Telegram chat for traders: https://t.me/litefinancebrokerchat. We are sharing the signals and trading experience.
- Telegram channel with high-quality analytics, Forex reviews, training articles, and other useful things for traders https://t.me/litefinance
Price chart of AUDUSD in real time mode

The content of this article reflects the author’s opinion and does not necessarily reflect the official position of LiteFinance broker. The material published on this page is provided for informational purposes only and should not be considered as the provision of investment advice for the purposes of Directive 2014/65/EU.
According to copyright law, this article is considered intellectual property, which includes a prohibition on copying and distributing it without consent.