Dear friends,
Have ever thought about in what way a successful trader differs from an unsuccessful one?
A successful trader makes profits from the market!
We are all reasonable people and understand that the exchange is not a money printing press. If one trader gains, another one loses, that is the law! The majority of participants can’t gain on the exchange, it is self-evident!
So, to make profits, you need to have your own, completely different view on the market. Wolfe’s wave theory enables to take a different view on the market and make up your own way to trade, completely different from that of the majority.
The theory specific feature is that it doesn’t follow the trend. It suggests following the waves, moving from one dynamic point on to another.
Most technical analysis patterns are based on deduction, that is, they suggest general laws for specific cases.
Wolfe Waves are, on the contrary, based on the inductive, “bottom-up” method, that is, the market is analyzed from the specific to general.
Basically, Wolfe Waves describe a natural process of forming a supply and demand wave, following the main law of physics that any action brings reaction.
A central feature of these waves is the opportunity to identify the target for profit fixing not only at price levels, but also on a timescale.
The article covers the following subjects:
Before starting a detailed description of the waves, Bill Wolfe pays special attention to the key principles of exchange trading.
You are likely to have learnt about them, or at least, have guessed them instinctively. Nevertheless, I want to pay my respect to Bill and enumerate main trading rules here:
- You will be always rewarded for being patient in the market
- Analyze the market situation when nobody and nothing distracts your attention
- Being nervous in the market results in errors
- Make up a trading plan, and trade only according to it
- Enter a trade only in “sweet zone”, the zone, providing the best trading performance
- Don’t enter the market, based on stop-loss levels
- Keep a trading journal! Write down ALL your traders, even the most unsuccessful
- Don’t be afraid of staying OUTSIDE the market
- Always calculate your risks. Don’t ever open a position, whose risk is more than your risk management allows
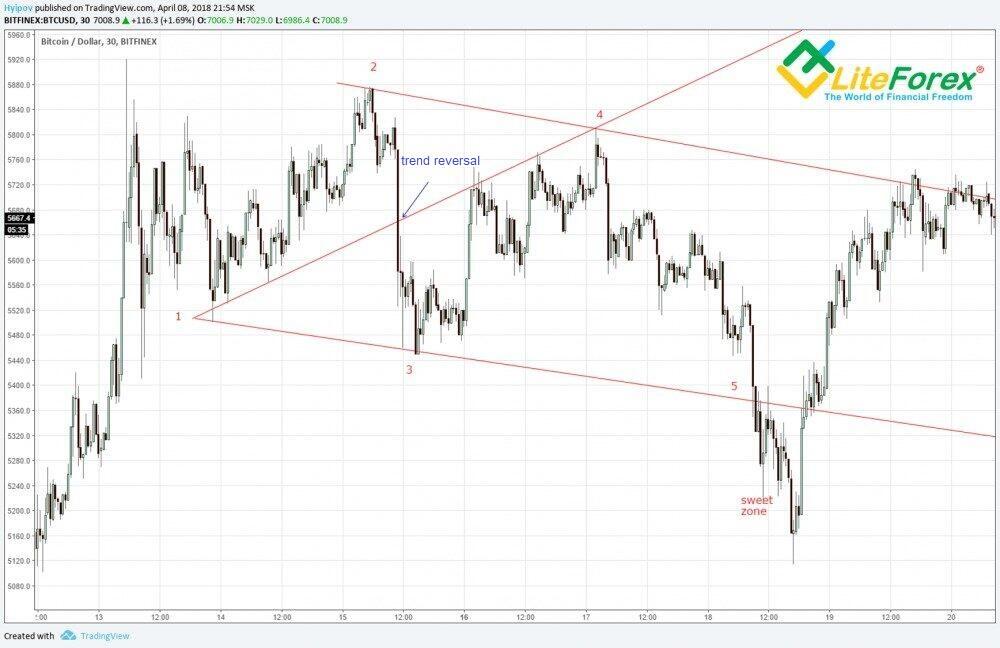
The Wolfe Waves as a variation of the Expanding Wedge pattern
The Wolfe Waves is nothing more than an expanding wedge. Indeed, we see several successive maxima and minima, and the count begins at point 1. It is called the base of the first decline for the bearish pattern (the base of the first top for the bullish pattern). The word base is used for a reason: it is understood as a line of three consecutive extremes - points 1, 3 and 5. Unlike the Three Little Indians, they do not necessarily have to be tops on the bullish market or bottoms on the bearish one. Point 1 can be formed under consolidation conditions.
Basically, it is composed of five waves.
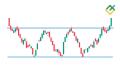
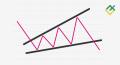
Bullish Wolfe Waves pattern
A bullish Wolf wave, in general, looks like this:
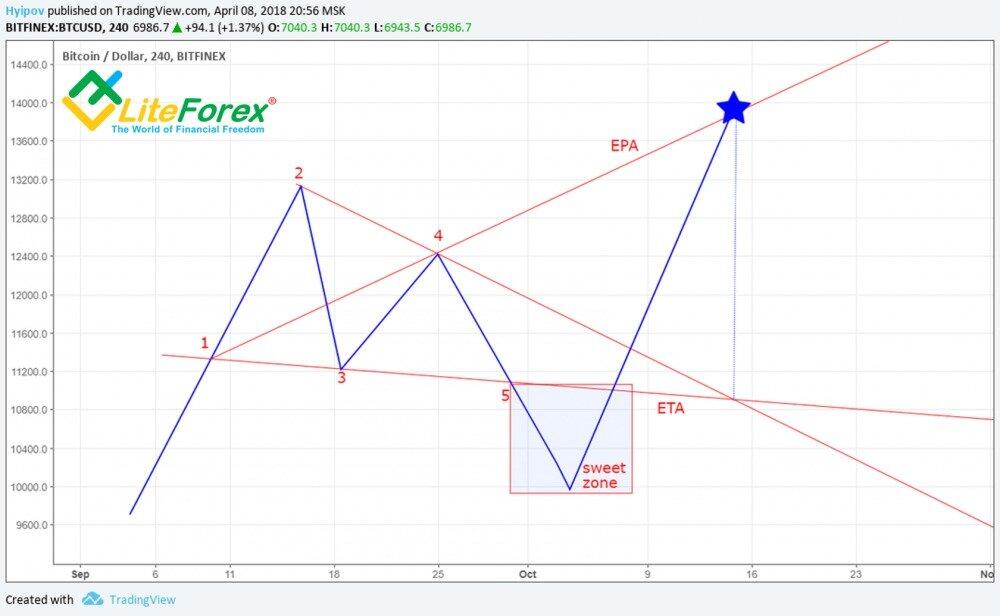
To draw it, a double top should emerge, where the second top will be lower than the first one (point 4 is lower than point 2)
Here, point 1 is the foundation of the first top (point 2)
Point 3 is the low of the retracement wave after its first top.
Point 4 is the high of the second peak.
Point 5 is the intersection of ray 1-3 (ETA)
Sweet zone is the zone to open long positions, starts from point 5 and below.
ETA – Estimated Time at Arrival, ray 1-3
EPA - Estimated Price at Arrival, ray 1-4
The intersection of ray 2-4 with ETA line indicates the date when the price will reach the target. The projection from this point on EPA estimates what is the price target level.
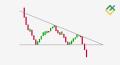
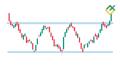
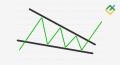
Bearish Wolfe Waves pattern
A bearish pattern looks like a mirror image of a bullish one.
In general, it looks like this:
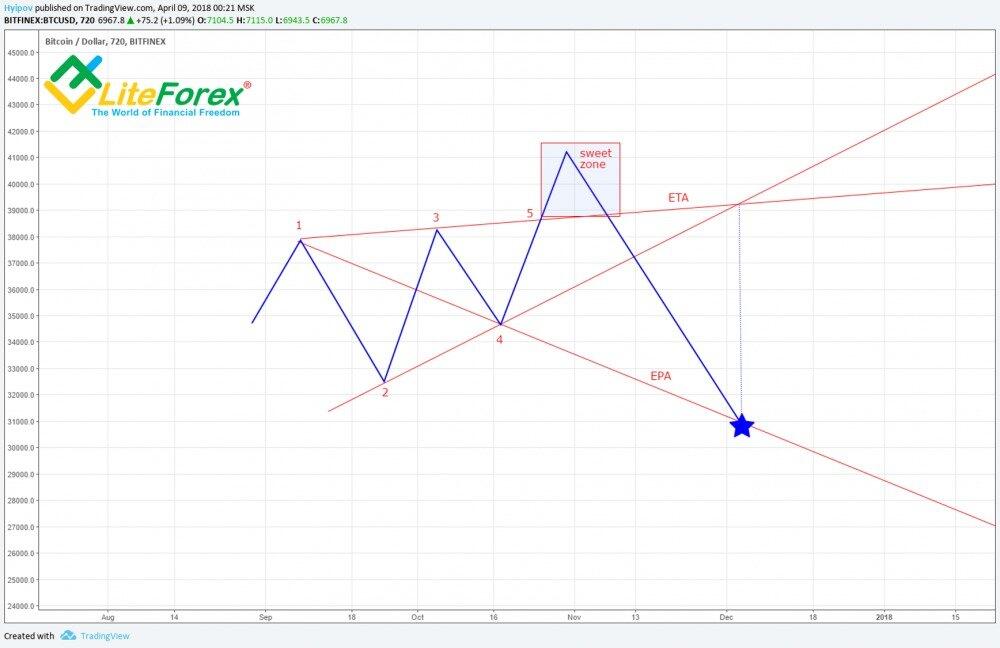
For its formation, a local double bottom should emerge, where the second bottom will be higher than the first one (point 4 is above point 2).
Here, point 1 is the apex, lower than that at point 3
Point 3 is the retracement wave’s highest point after the first bottom
Point 4 is the second bottom’s low
Point 5 is the point of ray 1-3 intersection (ETA)
Sweet Zone is the zone to open short positions, starts from point 5 and above
ETA – Estimated Time at Arrival, ray 1-3
EPA - Estimated Price at Arrival, ray 1-4
Studying the Wolfe Waves reverse pattern
As you see, the wave formation has quite a simple structure, however, Bill points out to rather many technical features that should be remembered when drawing these patterns; and you must take them into account in your analysis.
Technical notes can completely change the final target, or cancel the current pattern at all.
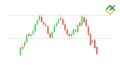
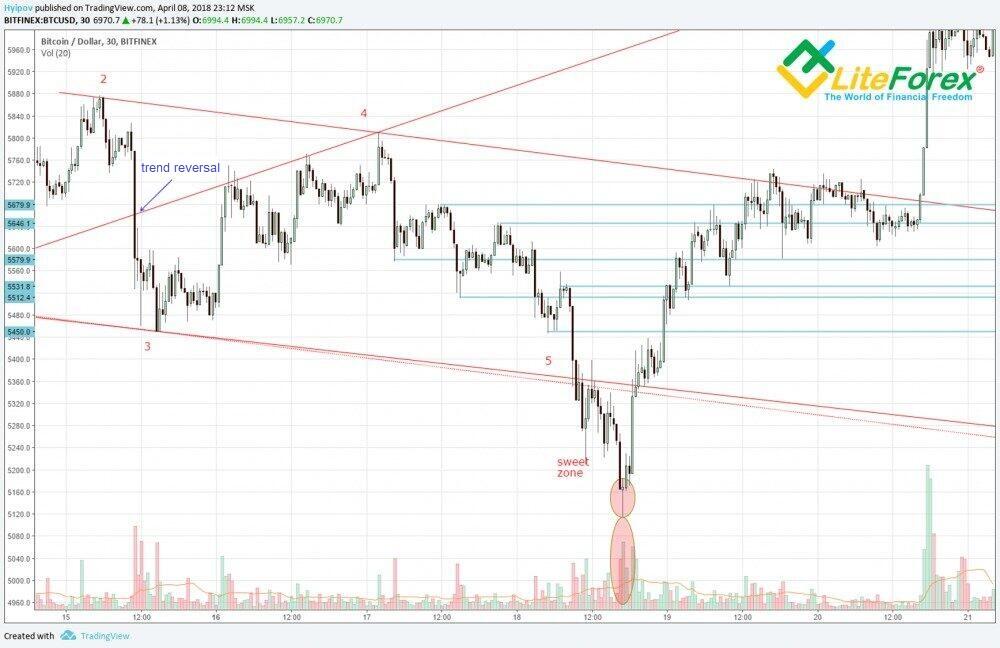
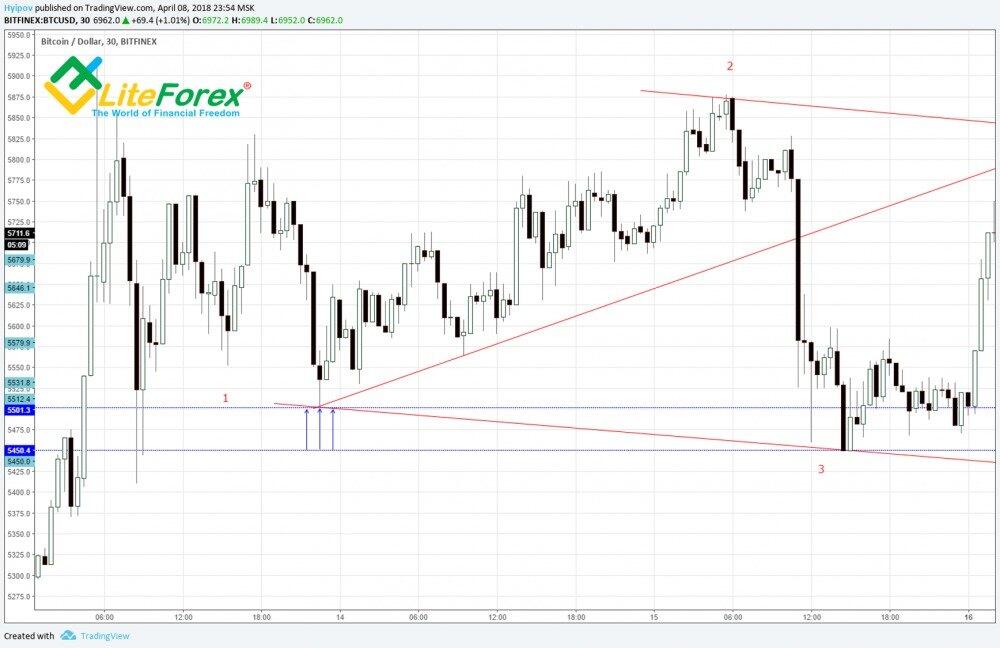
1) As a rule, reversal points are accompanied, first, by the decline in trading volume and then its increase, by the pattern completion. In the chart, the volume looks like a saucer.
With a more detailed study of the bullish Wolfe wave in the chart below, I marked these volume swings by red arcs.
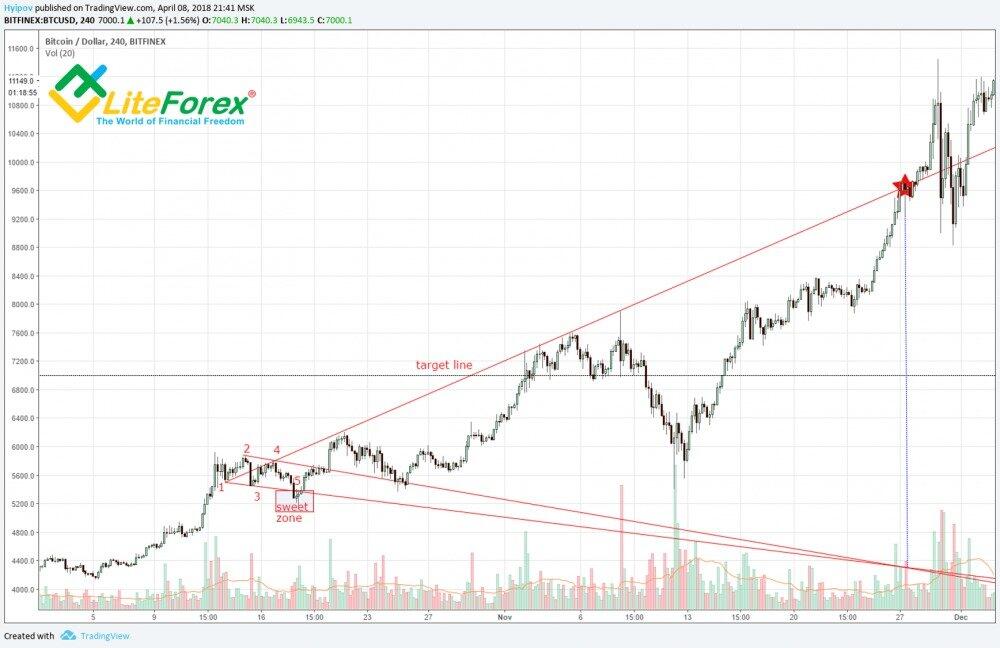
2) Trendline breakdown is a perfect situation for Wolfe Wave to emerge. The market’s nature itself supports the pattern formation.
Any action causes reaction, and so, any rupture of the trendline will result in an attempt to draw the price back, to the former levels.
3) Bill strongly suggests eliminating all unnecessary elements from the chart when you are looking for Wolfe Wave pattern, to keep your attention focused. The only indicator he allows is the volume indicator.
4) Waves in the longer timeframe are cancelled by the waves in the shorter one.
For example, you are inside a bullish Wolfe Wave in the daily chart and moving your position along arrow 1-4 up towards the suggested target. But, if there is a bearish Wolfe wave in 12-hour chart, it is a strong signal to fix your profits. Here, what matters is comparability of scopes. If you are working with bullish Wolfe wave in the daily timeframe, you needn’t worry about a bearish wave in 5-minute chart.
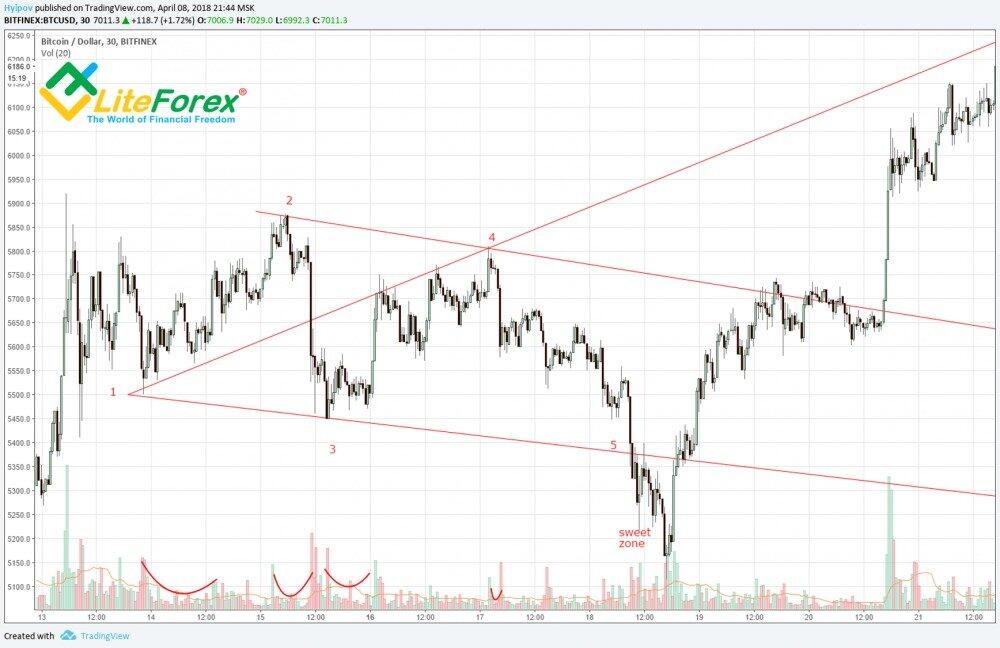
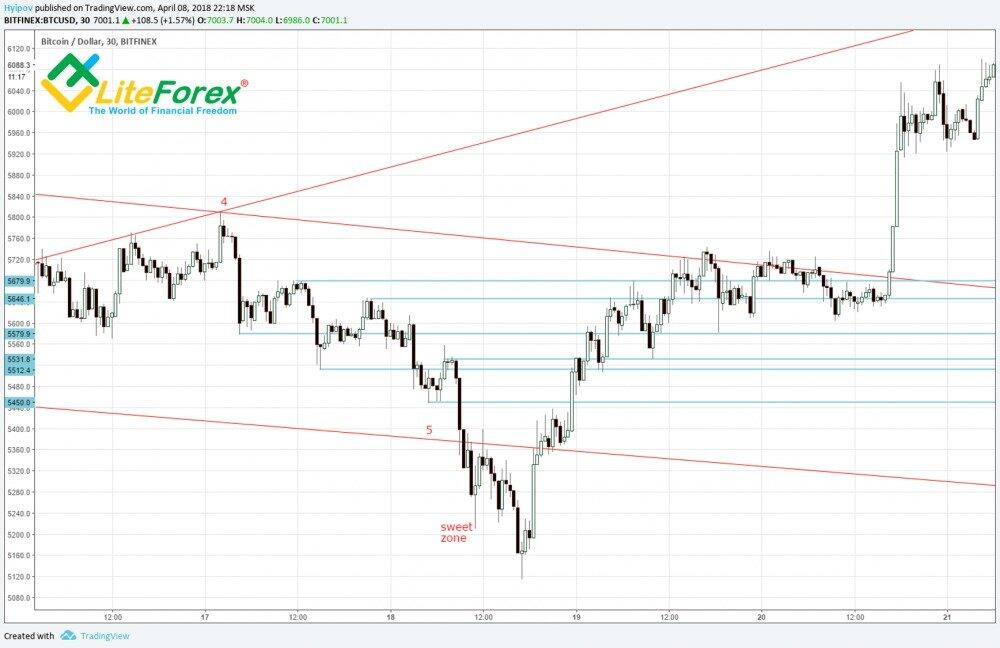
5) How to predict reversal waves?You need to analyze the line segment between points 4 and 5. Each microwave here creates the corresponding support and resistance levels. They should be taken into account when you enter a trade in sweet zone with a target at ray 1-4. These marked structures are highly likely to create similar microwaves on the price way to the target
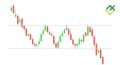
6) How to find point 4?
You need to know where points 1, 2, 3 are.
You draw a ray from point 2, parallel to ray 1-3. Now, you understand that point 4 should be below this line, otherwise, rays 1-3 and 1-4 won’t converge, and so, the pattern won’t be formed.
Next, you need to follow the trendline; each touching the trend during the return from point 3 is a potential reversal point for wave 4.
Here, I should note that, as a rule, point 4 will be the highest point in five-wave formation (see chart below)
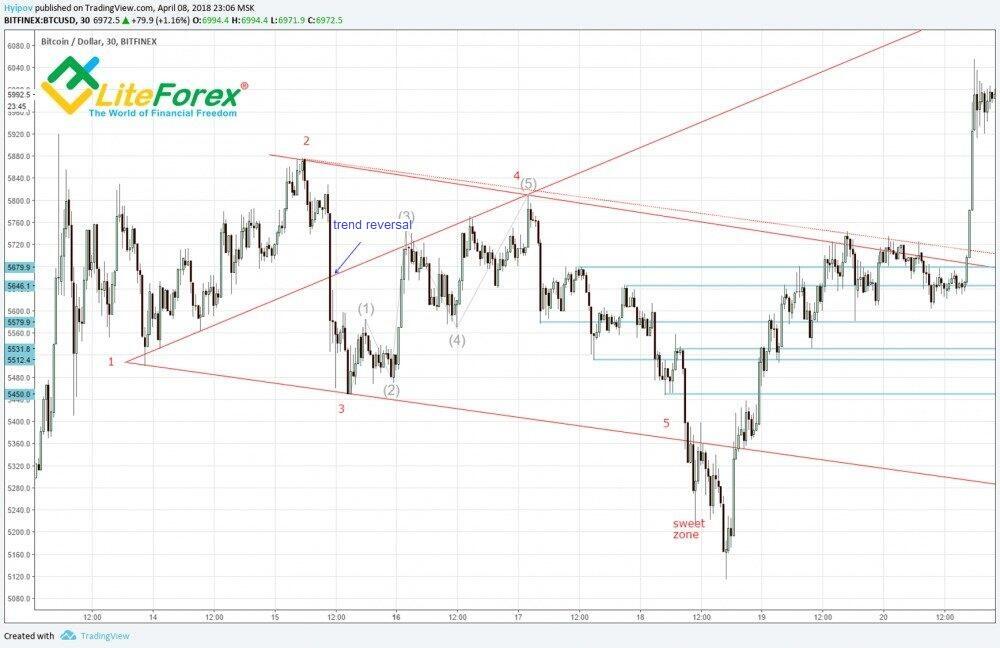
7) How to estimate the depth of Sweet zone?
Unfortunately, Bill doesn’t suggest any certain ways to predict this wave’s depth. However, he suggests you not worry about this, as any position below point 5 is quite promising. You now only need to have the PATIENCE, he writes about so much.
Nevertheless, there is a way to find out at least its approximate borders. To do it, you need to draw a parallel line from ray 2-4 to point 3.
Ideally, sweet zone should be bordered by the space between ray 1-3 and this projection
Unfortunately, this method didn’t work in our case.
Another signal here is the ticker volume highs. As clear in the chart above, the highest volume is exactly at the bar that formed the extreme in sweet zone.
Here, it is very important to follow the rules of money and risk management, to avoid margin call in case of a deep sweet zone.
8) Signs that the price will reach the target at line 1-4:
- Completely formed wave 4-5 with some micro waves
- Volume growth during the reversal in sweet zone
- Passing through ray 2-4 with large volume
9) To find point 1, you need to draw a projection of the horizontal line from point 3 towards point 2. The first bar, whose tail (shadow) converges with this line, will identify the needed point.
I want to emphasize once again that Bill Wolfe pays special attention to the converging point of rays 1-3 and 2-4, which allows finding out the estimated date, when the price is to reach the target.
There are a lot of Internet resource that describe Wolfe Waves pattern and its application, but this feature is often forgotten about. However, that is the main advantage of the indicator; it enables to predict the targets in time.
Besides, the property of rays 1-3 and 2-4 intersection is quite a good filter, which helps one not confuse every double top or double bottom pattern with Wolfe’s five-wave formation.
I should note that to use this tool in practice, you will need a certain knack.
I recommend practicing on your own and looking for similar patterns in trading retrospective, making sure, they worked out.
Get access to a demo account on an easy-to-use Forex platform without registration
Forex trading strategy Wolfe Waves
In the previous article, we learned how to find the Wolfe graphs on the charts, now it's time to get the pattern to work for us. Any trading system includes four elements: entry, setting a protective stop order, identifying the target, and controlling the position. In this case, the opening of longs for the bullish model or shorts for the bearish one occurs within the previously described strategy of tests and peaks. Let me remind you, the first system tries to catch the falling daggers, the second one assumes a more cautious approach.
The entry based on tests in the case of Wolfe Waves is the use of the sweet zone described by the author. It is built by transferring line 2-4 to point 3. The resulting triangle is a place for the creativity of traders. A position can be opened at the time of the return of quotations within the limits of the traded pattern. In the example with GBP/USD, the buy order is set at the resistance breakout level in the form of line 1-3, the stop order is placed at the bar's low at point 5. It should not be forgotten that for the tests, the protective stop orders are narrow, and the entry into the position can be made several times in succession as the stop signal is worked out.
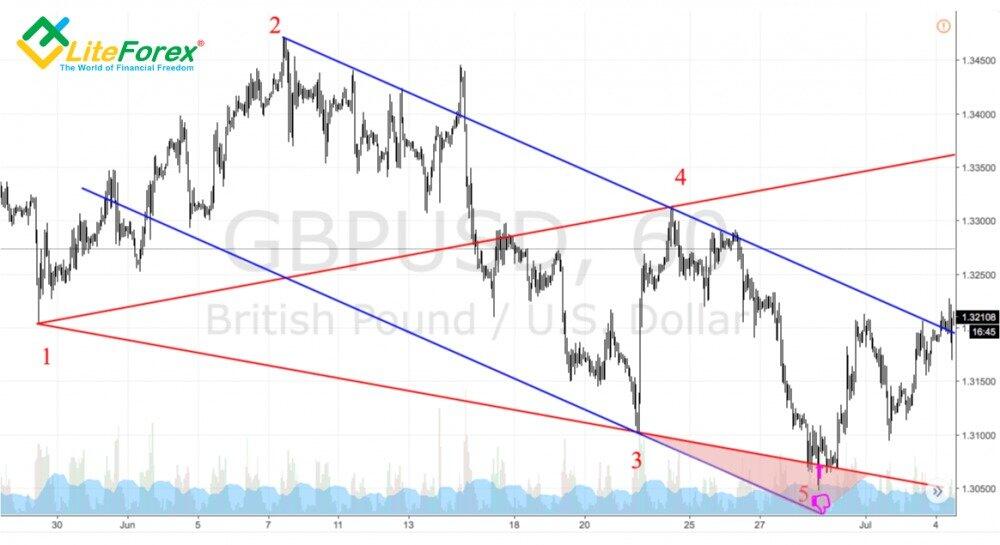
Trading on peaks involves additional signals confirming the reversal. This can be the Head and Shoulders pattern (or any other countertrend trading pattern), as in the case of GBP/USD, or the break of trend lines acting as diagonal support or resistance levels. Exit of the quotations of the currency pair outside the trading channel is in itself a serious signal, and coupled with the Wolfe Waves pattern it is a good reason for the formation of positions. The protective stop order in the first case (combination of patterns) is placed below the bar low at point 5, in the second (combination of the pattern and trend lines) - in the correctional low area. It should be noted that trading with Wolfe's Waves does not exclude the possibility of building up positions, including through joint use of tests and peaks.

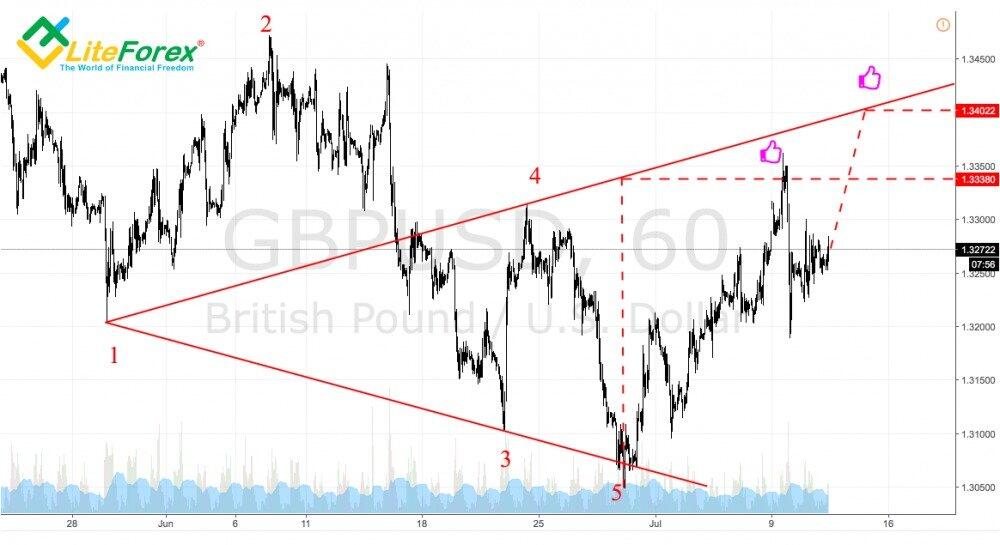
The classical approach provides for an exit from the transaction as the quotations of the currency pair reach the line 1-4. At the same time, a perpendicular projection drawn to wave 1-4 from point 5 can be used. It will give you an intermediate target, which is achieved much more often than the previous target benchmark. Using the projection allows you to customize the process of controlling the position. For example, as it is reached, a trader can:
- close the position completely,
- move the protective stop order to the breakeven point,
- take a part of profit and move the protective stop order to the breakeven point.
Thus, the Wolfe Waves pattern represents ready-made solutions for forex trader that allow the past patterns to be transferred to the future and traded out on the basis of extrapolation. Simply put, this is a classic price action pattern, a trading system without indicators. However, as we said in relation to other patterns, no one will punish you if you use the system filters.
If you have any personal experience in applying the tool, share it in the comments.
I wish you good luck and good profits!
P.S. Did you like my article? Share it in social networks: it will be the best "thank you" :)
Useful links:
- I recommend trying to trade with a reliable broker here. The system allows you to trade by yourself or copy successful traders from all across the globe.
- Use my promo code BLOG to get a 50% deposit bonus on the LiteFinance platform. Simply enter this code in the appropriate field when funding your trading account.
- Telegram chat for traders: https://t.me/litefinancebrokerchat. We are sharing the signals and trading experience.
- Telegram channel with high-quality analytics, Forex reviews, training articles, and other useful things for traders https://t.me/litefinance
The content of this article reflects the author’s opinion and does not necessarily reflect the official position of LiteFinance broker. The material published on this page is provided for informational purposes only and should not be considered as the provision of investment advice for the purposes of Directive 2014/65/EU.
According to copyright law, this article is considered intellectual property, which includes a prohibition on copying and distributing it without consent.